
This article is based on publicly available IR materials and is not a recommendation to buy or sell any specific securities.
Toho Gas reported FY2025 (April 2025 – March 2026) consolidated net sales of 651.0 billion yen, down 0.8% year on year, with operating income of 31.7 billion yen (+2.9%), ordinary income of 37.8 billion yen (+16.9%) and net income attributable to owners of the parent of 31.4 billion yen (+23.6%). City gas sales volume declined 1.5% to 3,300 million cubic meters while electricity sales volume rose 2.9% to 2,897 million kWh. For FY2026 the company guides for higher net sales of 670.0 billion yen but sharply lower profit, with ordinary income of 25.0 billion yen (-34.0%), mainly reflecting a 24.5 billion yen negative swing in the time lag on the cost adjustment system.
Consolidated Results (Full-Year Actual)
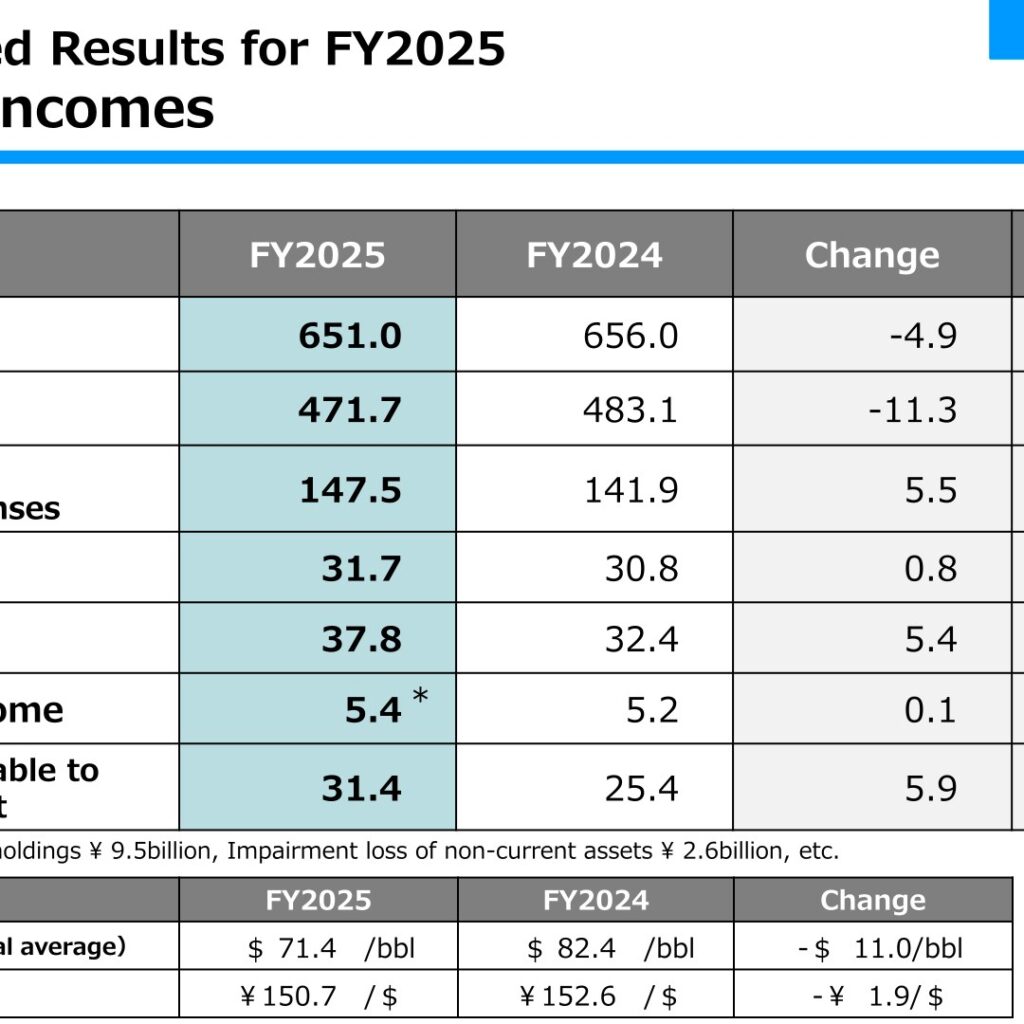
Net sales fell 4.9 billion yen (-0.8%) to 651.0 billion yen. Cost of sales declined 11.3 billion yen (-2.4%) to 471.7 billion yen while selling, general and administrative expenses rose 5.5 billion yen (+3.9%) to 147.5 billion yen, leaving operating income 0.8 billion yen higher (+2.9%) at 31.7 billion yen. Ordinary income rose 5.4 billion yen (+16.9%) to 37.8 billion yen, and net income attributable to owners of the parent rose 5.9 billion yen (+23.6%) to 31.4 billion yen. Extraordinary income of 5.4 billion yen included a gain on sales of cross-shareholdings of 9.5 billion yen and an impairment loss of non-current assets of 2.6 billion yen. The assumptions behind the period were a crude oil price (CIF national average) of $71.4/bbl versus $82.4/bbl a year earlier and an exchange rate (TTM) of 150.7 yen/$ versus 152.6 yen/$.
| Item (¥ billion) | FY2025 | FY2024 | Change | Rate of Change |
|---|---|---|---|---|
| Net Sales | 651.0 | 656.0 | -4.9 | -0.8% |
| Cost of sales | 471.7 | 483.1 | -11.3 | -2.4% |
| Selling, General and Administrative Expenses | 147.5 | 141.9 | 5.5 | 3.9% |
| Operating Income | 31.7 | 30.8 | 0.8 | 2.9% |
| Ordinary Income | 37.8 | 32.4 | 5.4 | 16.9% |
| Extraordinary Income | 5.4 | 5.2 | 0.1 | 3.2% |
| Net Income Attributable to Owners of the Parent | 31.4 | 25.4 | 5.9 | 23.6% |
| Crude Oil Price (CIF national average) | $71.4 /bbl | $82.4 /bbl | -$11.0/bbl | – |
| Exchange Rate (TTM) | ¥150.7 /$ | ¥152.6 /$ | -¥1.9/$ | – |
Energy Sales Volume and Customer Accounts
Energy sales volumes are reported separately from the financial figures. City gas sales volume fell 50 million cubic meters (-1.5%) to 3,300 million cubic meters, with residential volume down 0.5% to 559 million cubic meters on the impact of high February and March temperatures and non-residential volume down 1.7% to 2,741 million cubic meters (demand development +20, impact of temperatures -4, others -64). LPG volume was almost flat at 473 thousand tons (-0.2%), while electricity volume rose 82 million kWh (+2.9%) to 2,897 million kWh on an increase in the customer base. The average temperature was 17.7 degrees Celsius, unchanged from the previous year. Total customer accounts rose 34 thousand (+1.1%) to 3,121 thousand, led by a 25 thousand increase in electricity accounts to 716 thousand.
| Item | FY2025 | FY2024 | Change | Rate of Change |
|---|---|---|---|---|
| City Gas (million m3) | 3,300 | 3,350 | -50 | -1.5% |
| Residential | 559 | 562 | -3 | -0.5% |
| Non-Residential | 2,741 | 2,788 | -48 | -1.7% |
| LPG (thousand tons) | 473 | 474 | -1 | -0.2% |
| Electricity (million kWh) | 2,897 | 2,815 | 82 | 2.9% |
| Average temperature (degrees C) | 17.7 | 17.7 | 0.0 | – |
| Number of customer accounts (thousand) | 3,121 | 3,086 | 34 | 1.1% |
| City Gas | 1,759 | 1,750 | 9 | 0.5% |
| LPG | 646 | 645 | 1 | 0.1% |
| Electricity | 716 | 691 | 25 | 3.6% |
Segment Results
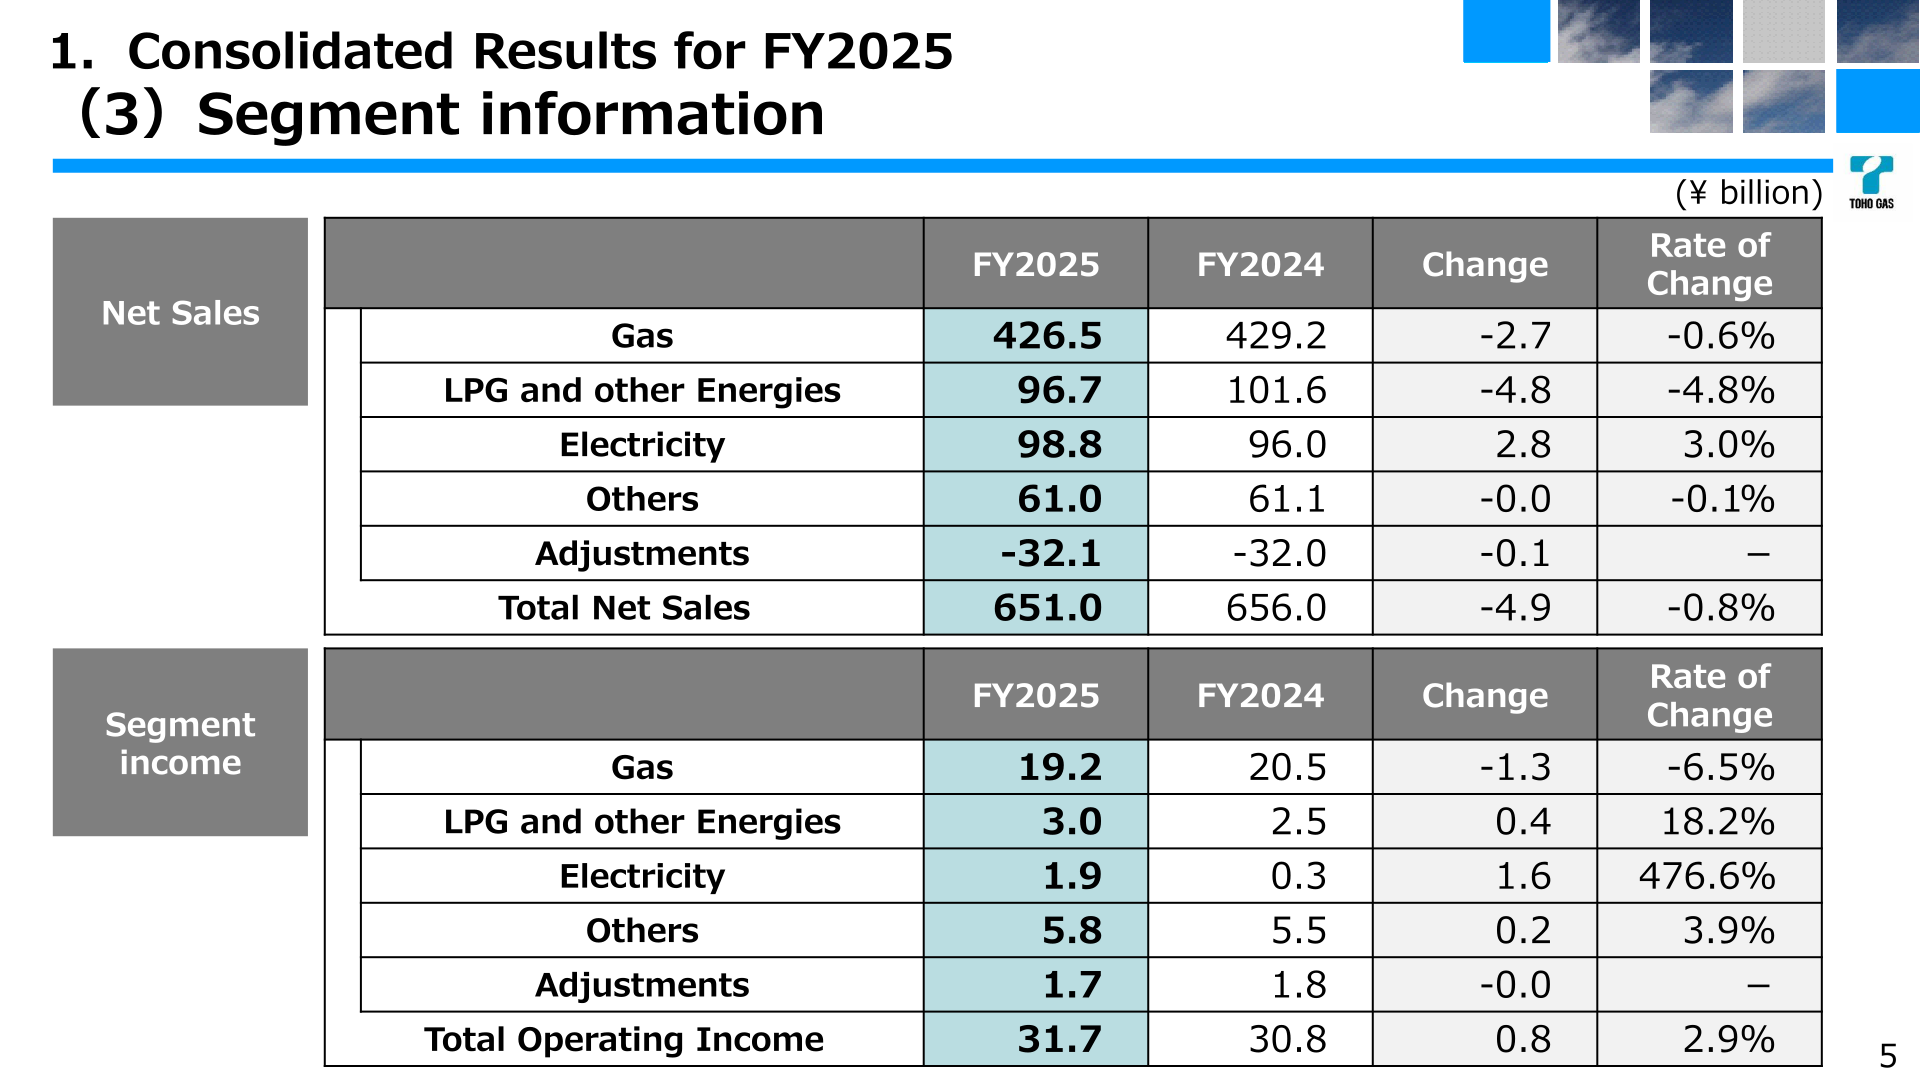
In the Gas segment, net sales fell 0.6% to 426.5 billion yen and segment income fell 6.5% to 19.2 billion yen. LPG and other Energies saw net sales fall 4.8% to 96.7 billion yen but segment income rise 18.2% to 3.0 billion yen. Electricity net sales rose 3.0% to 98.8 billion yen and segment income rose 476.6% to 1.9 billion yen from 0.3 billion yen. Others recorded net sales of 61.0 billion yen (-0.1%) and segment income of 5.8 billion yen (+3.9%), with adjustments of -32.1 billion yen on net sales and 1.7 billion yen on income.
| Segment (¥ billion) | Net Sales FY2025 | Net Sales FY2024 | Segment Income FY2025 | Segment Income FY2024 |
|---|---|---|---|---|
| Gas | 426.5 | 429.2 | 19.2 | 20.5 |
| LPG and other Energies | 96.7 | 101.6 | 3.0 | 2.5 |
| Electricity | 98.8 | 96.0 | 1.9 | 0.3 |
| Others | 61.0 | 61.1 | 5.8 | 5.5 |
| Adjustments | -32.1 | -32.0 | 1.7 | 1.8 |
| Total | 651.0 | 656.0 | 31.7 | 30.8 |
Ordinary Income Factors and the Cost Adjustment System
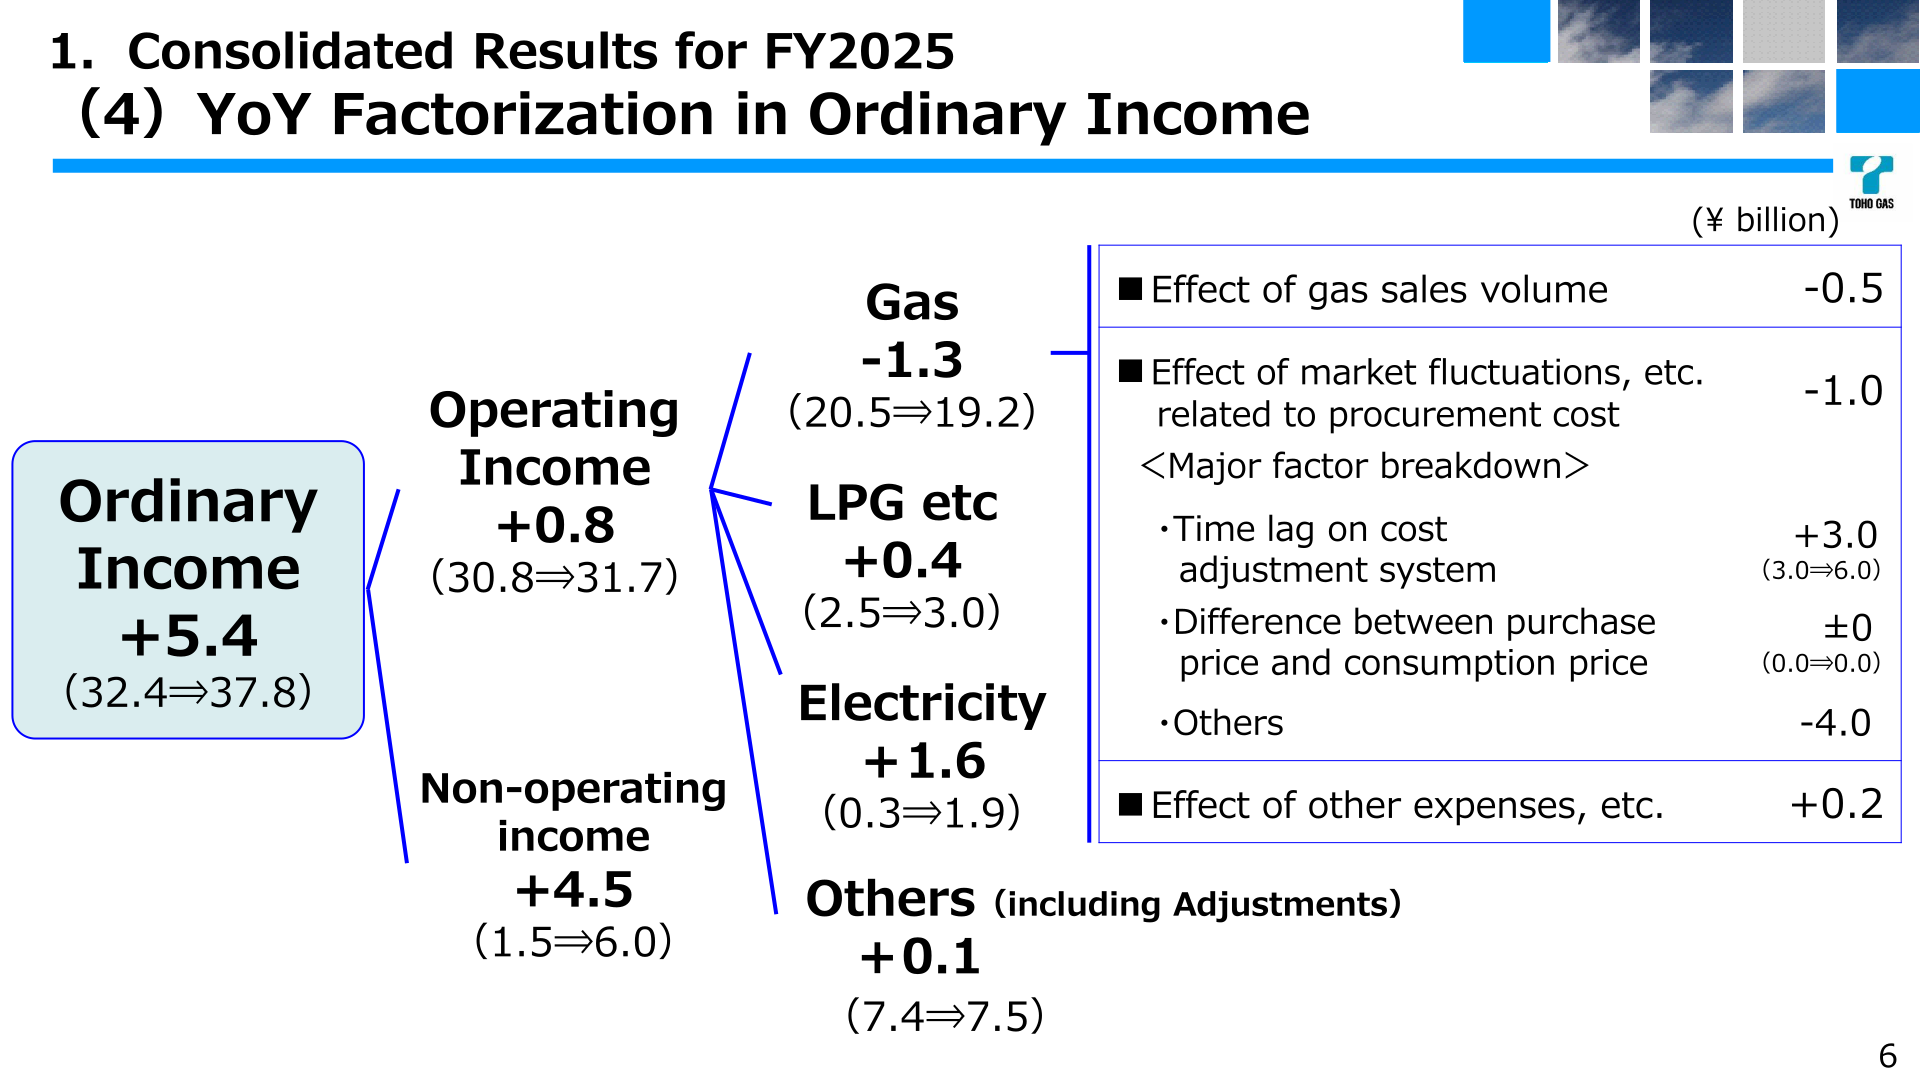
The company breaks the 5.4 billion yen year-on-year increase in ordinary income (32.4 to 37.8 billion yen) into a 0.8 billion yen increase in operating income (30.8 to 31.7 billion yen) and a 4.5 billion yen increase in non-operating income (1.5 to 6.0 billion yen). Within operating income, Gas contributed -1.3 billion yen (20.5 to 19.2), LPG etc. +0.4 billion yen (2.5 to 3.0), Electricity +1.6 billion yen (0.3 to 1.9) and Others including adjustments +0.1 billion yen (7.4 to 7.5). For the Gas segment, the effect of gas sales volume was -0.5 billion yen and the effect of market fluctuations related to procurement cost was -1.0 billion yen; within that, the time lag on the cost adjustment system contributed +3.0 billion yen (3.0 to 6.0), the difference between purchase price and consumption price was unchanged at zero (0.0 to 0.0), and others were -4.0 billion yen. The effect of other expenses was +0.2 billion yen.
Financial Position and Cash Flows
Total assets grew 50.6 billion yen to 809.4 billion yen and net assets rose 29.1 billion yen to 477.5 billion yen, leaving the equity ratio broadly unchanged at 59.0% (-0.1Pt). Interest-bearing debts increased 12.0 billion yen to 172.9 billion yen and the D/E ratio was unchanged at 0.36 times. ROA improved 0.6Pt to 4.0% and ROE improved 1.2Pt to 6.8%. Cash flows from operating activities were 65.6 billion yen (down 17.4 billion yen) and cash flows from investment activities were -41.7 billion yen, giving free cash flows of 23.8 billion yen versus 37.9 billion yen a year earlier. Cash flows from financing activities were -26.7 billion yen, and cash and cash equivalents at the end of the period were 42.9 billion yen. CAPEX including investment was 59.2 billion yen and depreciation was 38.6 billion yen.
FY2026 Forecast
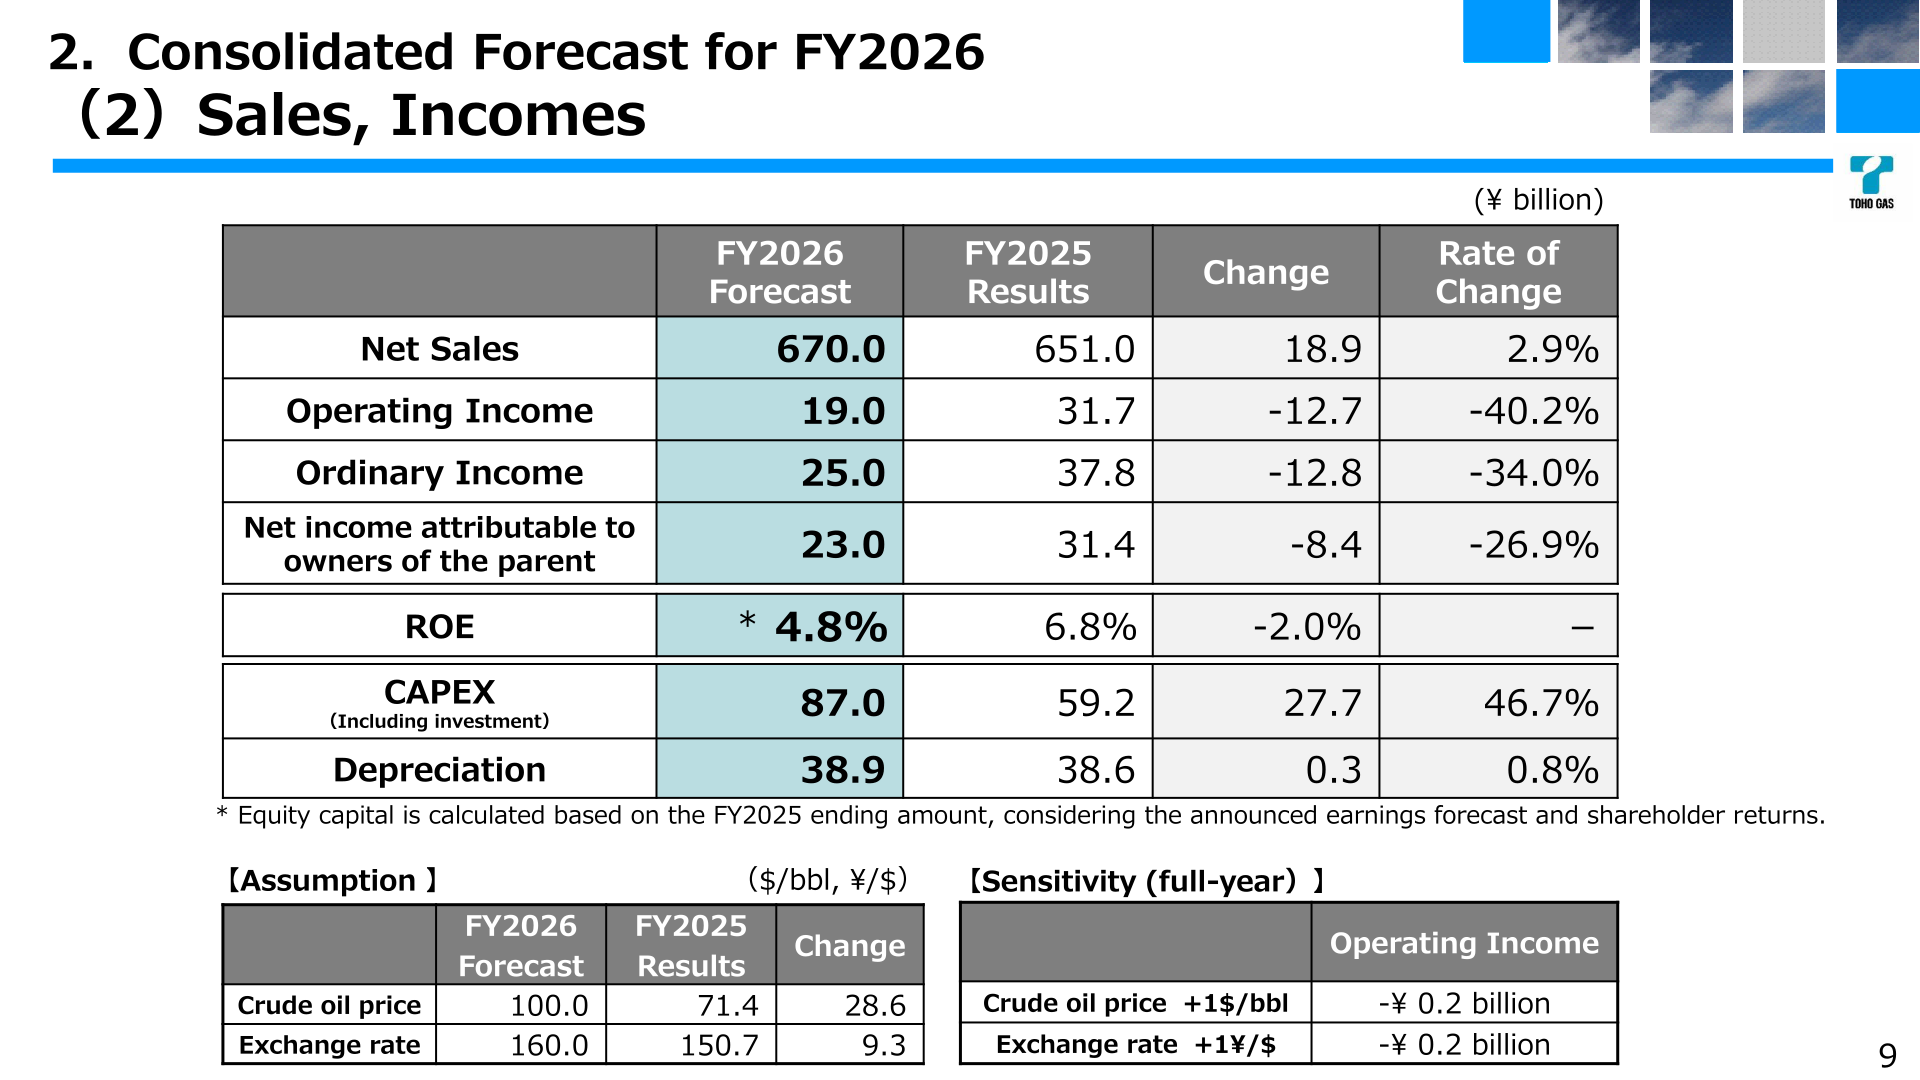
For FY2026 the company forecasts net sales of 670.0 billion yen (+2.9%), operating income of 19.0 billion yen (-40.2%), ordinary income of 25.0 billion yen (-34.0%) and net income attributable to owners of the parent of 23.0 billion yen (-26.9%), with ROE of 4.8% against 6.8% in FY2025. CAPEX including investment is planned to rise 46.7% to 87.0 billion yen and depreciation to 38.9 billion yen. The assumptions are a crude oil price of 100.0 $/bbl and an exchange rate of 160.0 yen/$, versus 71.4 and 150.7 respectively in FY2025; full-year sensitivity of operating income is -0.2 billion yen per $1/bbl rise in the crude oil price and -0.2 billion yen per 1 yen/$ move in the exchange rate. The 12.8 billion yen decline in ordinary income is driven by the Gas segment (-9.7 billion yen, 19.2 to 9.5), Electricity (-1.9 billion yen, 1.9 to 0.0) and LPG etc. (-1.0 billion yen, 3.0 to 2.0); within the Gas segment the time lag on the cost adjustment system swings by -24.5 billion yen (from +6.0 to -18.5 billion yen), partly offset by +4.5 billion yen from the difference between purchase price and consumption price and +7.5 billion yen from others. On volumes, city gas sales are forecast to fall 1.5% to 3,251 million cubic meters and electricity to fall 2.5% to 2,824 million kWh, while customer accounts are expected to rise 1.2% to 3,158 thousand.
| Item (¥ billion) | FY2026 Forecast | FY2025 Results | Change | Rate of Change |
|---|---|---|---|---|
| Net Sales | 670.0 | 651.0 | 18.9 | 2.9% |
| Operating Income | 19.0 | 31.7 | -12.7 | -40.2% |
| Ordinary Income | 25.0 | 37.8 | -12.8 | -34.0% |
| Net income attributable to owners of the parent | 23.0 | 31.4 | -8.4 | -26.9% |
| ROE | 4.8% | 6.8% | -2.0% | – |
| CAPEX (Including investment) | 87.0 | 59.2 | 27.7 | 46.7% |
| Depreciation | 38.9 | 38.6 | 0.3 | 0.8% |
| Crude oil price ($/bbl) | 100.0 | 71.4 | 28.6 | – |
| Exchange rate (¥/$) | 160.0 | 150.7 | 9.3 | – |
Shareholder Returns
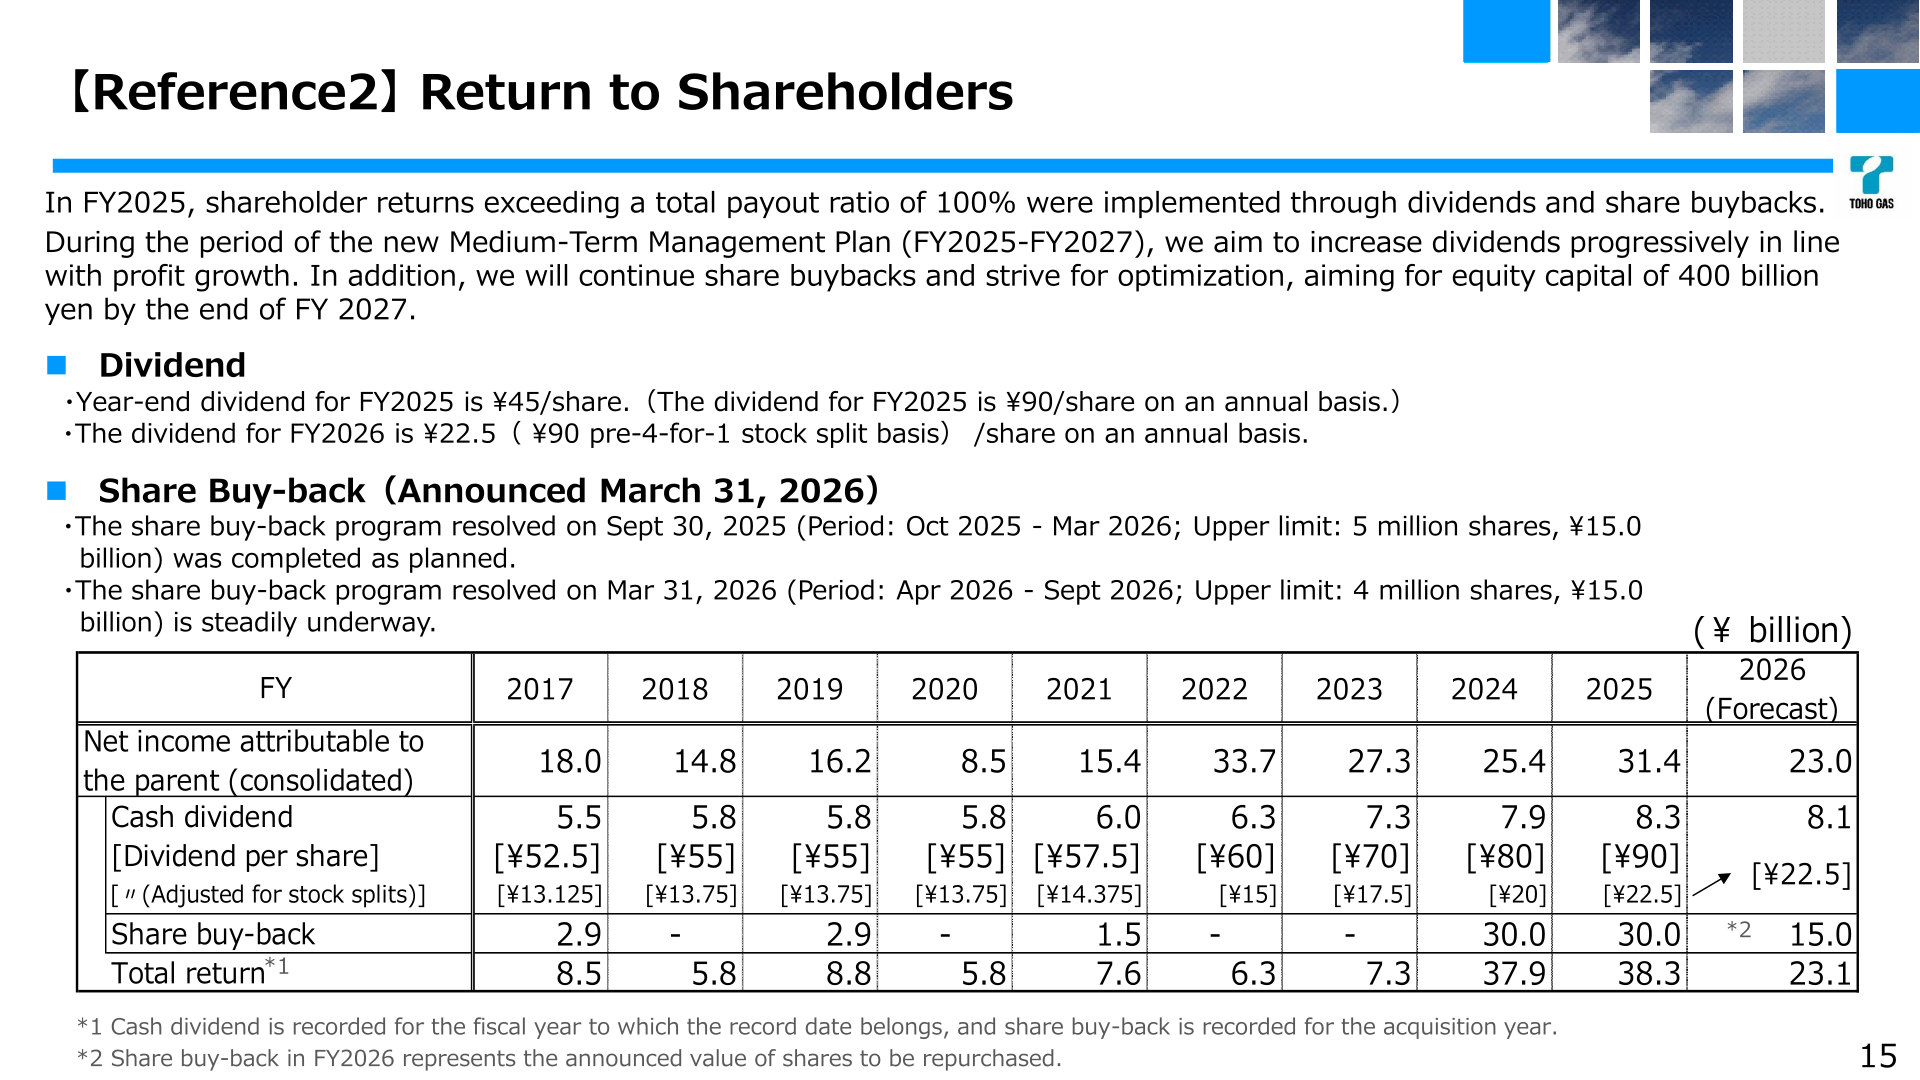
In FY2025, shareholder returns exceeding a total payout ratio of 100% were implemented through dividends and share buybacks. The year-end dividend for FY2025 is 45 yen per share, taking the annual dividend to 90 yen per share. The dividend for FY2026 is 22.5 yen per share on an annual basis, equivalent to 90 yen on a pre-4-for-1 stock split basis. The share buy-back program resolved on September 30, 2025 (period October 2025 to March 2026; upper limit 5 million shares, 15.0 billion yen) was completed as planned, and the program resolved on March 31, 2026 (period April 2026 to September 2026; upper limit 4 million shares, 15.0 billion yen) is steadily underway. During the new Medium-Term Management Plan period (FY2025-FY2027) the company aims to increase dividends progressively in line with profit growth while continuing share buybacks, targeting equity capital of 400 billion yen by the end of FY2027.
| Item (¥ billion) | FY2023 | FY2024 | FY2025 | FY2026 (Forecast) |
|---|---|---|---|---|
| Net income attributable to the parent (consolidated) | 27.3 | 25.4 | 31.4 | 23.0 |
| Cash dividend | 7.3 | 7.9 | 8.3 | 8.1 |
| Dividend per share | ¥70 | ¥80 | ¥90 | ¥22.5 (¥90 on a pre-4-for-1 stock split basis) |
| Dividend per share (adjusted for stock splits) | ¥17.5 | ¥20 | ¥22.5 | ¥22.5 |
| Share buy-back | – | 30.0 | 30.0 | 15.0 |
| Total return | 7.3 | 37.9 | 38.3 | 23.1 |
Capital Policy and Cash Allocation
Equity capital rose from 448.3 billion yen as of March 31, 2025 to 477.5 billion yen as of March 31, 2026, as an increase in accumulated other comprehensive income of 36.9 billion yen from a sharp rise in the market value of held shares outweighed the decrease in shareholders’ equity of 7.8 billion yen; net income and related items added 30.3 billion yen while dividends took out 8.1 billion yen and treasury stock repurchases 30.0 billion yen, for shareholder returns of 38.1 billion yen. The company aims to optimize equity capital toward a target of 400.0 billion yen by the end of March 2028. On cross-shareholdings, the balance at the end of FY2025 increased to 129.7 billion yen because of a significant rise in valuation gains driven by favorable stock market conditions, even though the company sold 10.0 billion yen in FY2025 (including a 9.5 billion yen gain on sale) after 10.0 billion yen in FY2024 (including a 7.5 billion yen gain on sale). It plans to complete the sale of approximately one-third of its holdings, measured against the balance as of the end of FY2023, by the end of FY2027.
On cash allocation, FY2025 cash out comprised core business investments of 31.4 billion yen, strategic business investments of 27.7 billion yen and shareholder returns of 38.1 billion yen. The FY2026 plan is core business investments of 37 billion yen, strategic business investments of 50 billion yen and shareholder returns of approximately 40 billion yen. Within strategic business investments, electricity is planned at 16.0 billion yen (11.4 billion yen in FY2025), overseas business at 18.0 billion yen (5.9 billion yen) and community-based value creation businesses and others at 16.0 billion yen (10.3 billion yen). Cross-shareholding sales of over 10 billion yen are planned for FY2026 after 10 billion yen of completed sales in FY2025.
Medium-Term Management Plan (FY2025-FY2027) and Topics
Under the Medium-Term Management Plan covering FY2025 to FY2027, the company targets consolidated ordinary income of 30 billion yen in FY2027, described as current normalized base income plus 5 billion yen. Current normalized base income is shown as 25 billion yen, of which core business is 16 billion yen and strategic business 4 billion yen; the FY2027 plan of 30 billion yen comprises core business of 18 billion yen and strategic business of 10 billion yen. ROE for the final year of the plan is expected to be 6% plus alpha, above a cost of equity of approximately 5%. Over the three years of the plan, cash in is expected to consist of approximately 210 billion yen of cash flow generation and approximately 130 billion yen from utilizing borrowing capacity, with operating cash flow of approximately 60 billion yen in FY2027 and a general upper limit on the D/E ratio of 0.8 times; cash out is planned as approximately 130 billion yen of strategic business investments, approximately 110 billion yen of core business investments and approximately 100 billion yen of shareholder returns, with estimated cross-shareholding sales of approximately 30 billion yen. On dividends the company aims to increase them progressively in line with profit growth, with a base dividend of 80 yen per share.
Among topics, the company disclosed plans to construct gas engine power generation facilities at a proposed site in Handa City, Aichi Prefecture, within the grounds of JFE Steel Corporation’s Chita Works, with a generation capacity of 105,000 kW (7,500 kW x 14 units) fuelled by city gas, construction starting in April 2027 and operations commencing by FY2030; the gas engines are intended as balancing capacity to offset renewable energy fluctuations. On the situation in the Middle East, the company states that its dependency on the region is low, with no LNG procurement from the Middle East and LPG procured from domestic wholesalers with low Middle East reliance, and that no disruptions to stable supply are expected at present. It notes that if LNG procurement costs rise, a short-term negative impact may occur due to the time lag of the cost adjustment system, although this is expected to be neutralized over the long term.
This article is an analysis based on publicly available information and is not a recommendation to buy or sell any specific securities. Investment decisions are your own responsibility.
![[Obayashi] Investors’ Guide 2026 — The Complete 24-Article Breakdown](https://japan-equity.com/wp-content/uploads/2026/07/hub_cover-1024x1024.png)
![[Obayashi] IR & SR Policy — Feeding Dialogue Back into Management](https://japan-equity.com/wp-content/uploads/2026/07/p32_sq-1024x1024.jpg)
![[Obayashi] Real Estate Development — 18.7% Margin, ¥287.7bn Unrealized Gains](https://japan-equity.com/wp-content/uploads/2026/07/p20_sq-1024x1024.jpg)
![[Obayashi] Domestic Civil Engineering — Resilience Spending Supports 9.6% Margin](https://japan-equity.com/wp-content/uploads/2026/07/p11_sq-1024x1024.jpg)
![[Obayashi] Share Price & External Ratings — vs TOPIX, ESG Index Inclusion](https://japan-equity.com/wp-content/uploads/2026/07/p40_sq-1024x1024.jpg)
![[Construction] ¥75.5tn Investment, Shrinking Workforce — Big-5 Market Share](https://japan-equity.com/wp-content/uploads/2026/07/p12_sq-1024x1024.jpg)



![[Obayashi] Capital Policy & Shareholder Returns — ROE 10%+, DOE ~5%, ¥100bn Buyback](https://japan-equity.com/wp-content/uploads/2026/07/p27_sq-1024x1024.jpg)
![[Obayashi] Reducing Cross-Shareholdings — ¥285.2bn Sold in Five Years](https://japan-equity.com/wp-content/uploads/2026/07/p29_sq-1024x1024.jpg)
![[Obayashi] ¥750bn Investment Plan — ¥300bn to Development, ¥190bn to Tech/DX](https://japan-equity.com/wp-content/uploads/2026/07/p30_sq-1024x1024.jpg)
![[Obayashi] MTP2022 KPIs — Operating Profit ~2x Target, ROE 14.4%](https://japan-equity.com/wp-content/uploads/2026/07/p25_sq-1024x1024.jpg)
![[Obayashi] Cash Allocation — ¥420bn Investment CF Over Five Years](https://japan-equity.com/wp-content/uploads/2026/07/p26_sq-1024x1024.jpg)
![[Obayashi] Green Energy — 44 Plants, 344MW, and the Green Hydrogen Challenge](https://japan-equity.com/wp-content/uploads/2026/07/p21_sq-1024x1024.jpg)
![[Obayashi] Tackling the Labor Shortage — Robotics Construction®](https://japan-equity.com/wp-content/uploads/2026/07/p14_sq-1024x1024.jpg)
