
This article is based on publicly available IR materials and is not a recommendation to buy or sell any specific securities.
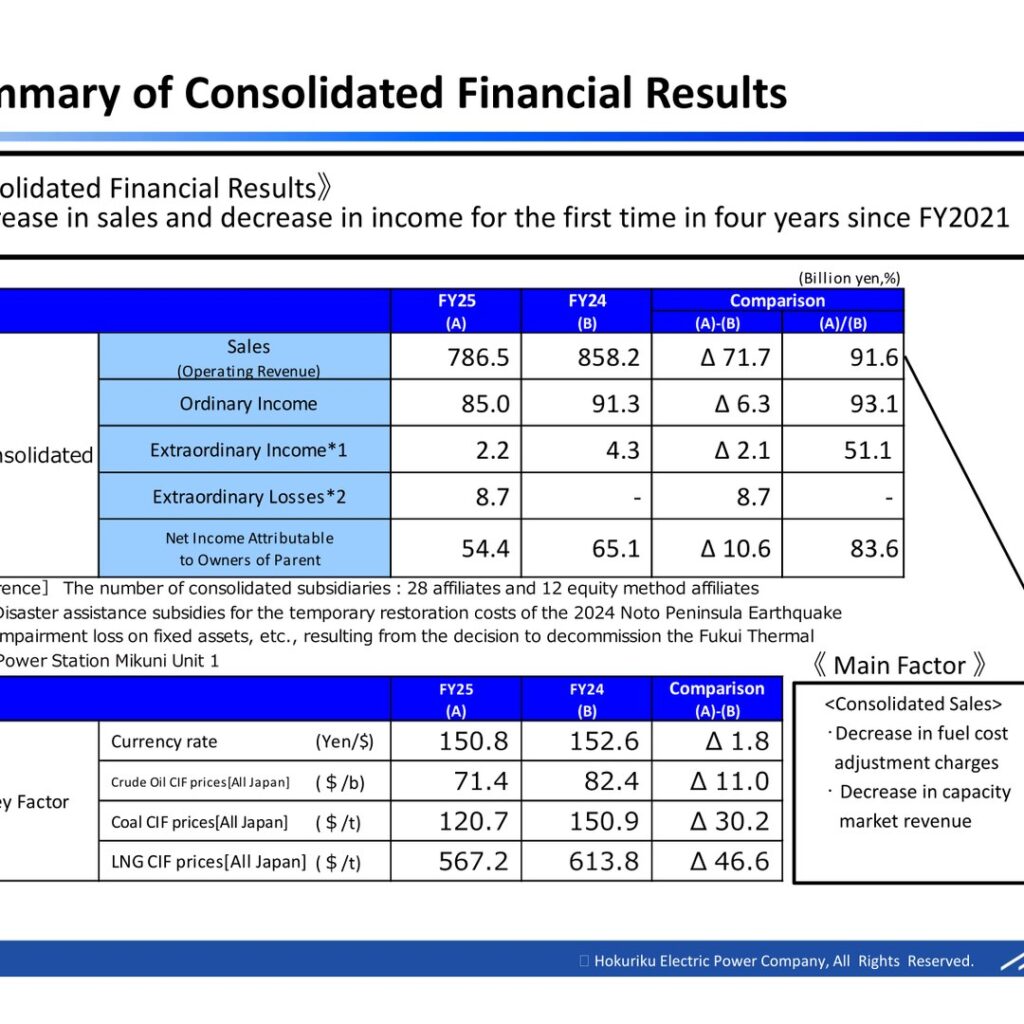
Hokuriku Electric Power Company reported FY2025 consolidated sales (operating revenue) of 786.5 billion yen and ordinary income of 85.0 billion yen, with net income attributable to owners of parent of 54.4 billion yen. The company describes the results as a decrease in sales and a decrease in income for the first time in four years since FY2021. For FY2026 the company forecasts sales of approximately 760.0 billion yen and ordinary income of approximately 35.0 billion yen. The presentation is dated April 28, 2026 and was revised on June 5, 2026.
Consolidated Results (Full-Year Actual)
Sales fell 71.7 billion yen year on year to 786.5 billion yen (91.6% of the previous year), and ordinary income declined 6.3 billion yen to 85.0 billion yen (93.1%). Extraordinary income of 2.2 billion yen represents disaster assistance subsidies for the temporary restoration costs of the 2024 Noto Peninsula Earthquake, while extraordinary losses of 8.7 billion yen relate to an impairment loss on fixed assets, etc., resulting from the decision to decommission the Fukui Thermal Power Station Mikuni Unit 1. Net income attributable to owners of parent was 54.4 billion yen (83.6%). The materials note 28 consolidated subsidiaries and 12 equity method affiliates. On the five-year reference table, operating income was 87.4 billion yen in FY25 against 101.0 billion yen in FY24.
| Item (Billion yen, %) | FY25 (A) | FY24 (B) | (A)-(B) | (A)/(B) |
|---|---|---|---|---|
| Sales (Operating Revenue) | 786.5 | 858.2 | Δ71.7 | 91.6 |
| Ordinary Income | 85.0 | 91.3 | Δ6.3 | 93.1 |
| Extraordinary Income | 2.2 | 4.3 | Δ2.1 | 51.1 |
| Extraordinary Losses | 8.7 | – | 8.7 | – |
| Net Income Attributable to Owners of Parent | 54.4 | 65.1 | Δ10.6 | 83.6 |
| Operating Income (Reference, P.15) | 87.4 | 101.0 | – | – |
| Currency rate (Yen/$) | 150.8 | 152.6 | Δ1.8 | – |
| Crude Oil CIF prices [All Japan] ($/b) | 71.4 | 82.4 | Δ11.0 | – |
| Coal CIF prices [All Japan] ($/t) | 120.7 | 150.9 | Δ30.2 | – |
| LNG CIF prices [All Japan] ($/t) | 567.2 | 613.8 | Δ46.6 | – |
Electricity Sales and Power Generation
Total electricity sales, which exclude sales related to the power transmission and distribution business, rose to 33.16 billion kWh (103.9% of the previous year). Retail sales increased to 24.78 billion kWh, with lighting down to 7.40 billion kWh on a decrease in air conditioning demand in winter and power up to 17.38 billion kWh on an increase in contract demand; wholesale rose to 8.38 billion kWh on an increase in trading at JEPX. On the generation side, hydro increased to 6.11 billion kWh on higher self-flowing and reservoir type power generated (flow rate 101.5 against 96.1), thermal decreased to 19.06 billion kWh on lower coal-fired thermal power generated, and nuclear was reported as a dash for both years.
| Item (Billion kWh, %) | FY25 (A) | FY24 (B) | (A)-(B) | (A)/(B) |
|---|---|---|---|---|
| Electricity sales: Retail | 24.78 | 24.24 | 0.53 | 102.2 |
| Electricity sales: Retail — Lighting | 7.40 | 7.54 | Δ0.14 | 98.2 |
| Electricity sales: Retail — Power | 17.38 | 16.71 | 0.67 | 104.0 |
| Electricity sales: Wholesale | 8.38 | 7.68 | 0.70 | 109.2 |
| Electricity sales: Total | 33.16 | 31.92 | 1.24 | 103.9 |
| Generated Power: Hydro | 6.11 | 5.73 | 0.39 | 106.7 |
| Generated Power: Thermal | 19.06 | 20.29 | Δ1.23 | 93.9 |
| Generated Power: Nuclear | — | — | — | — |
| Generated Power: Renewable | 0.00 | 0.00 | 0.00 | 114.0 |
| Generated Power: Subtotal | 25.18 | 26.03 | Δ0.85 | 96.7 |
| Purchased Power | 10.15 | 8.33 | 1.82 | 121.8 |
| Consumed for pumped storage | Δ0.02 | Δ0.03 | 0.01 | 70.5 |
| Total | 35.30 | 34.32 | 0.98 | 102.8 |
Main Factors Behind the Change in Ordinary Income
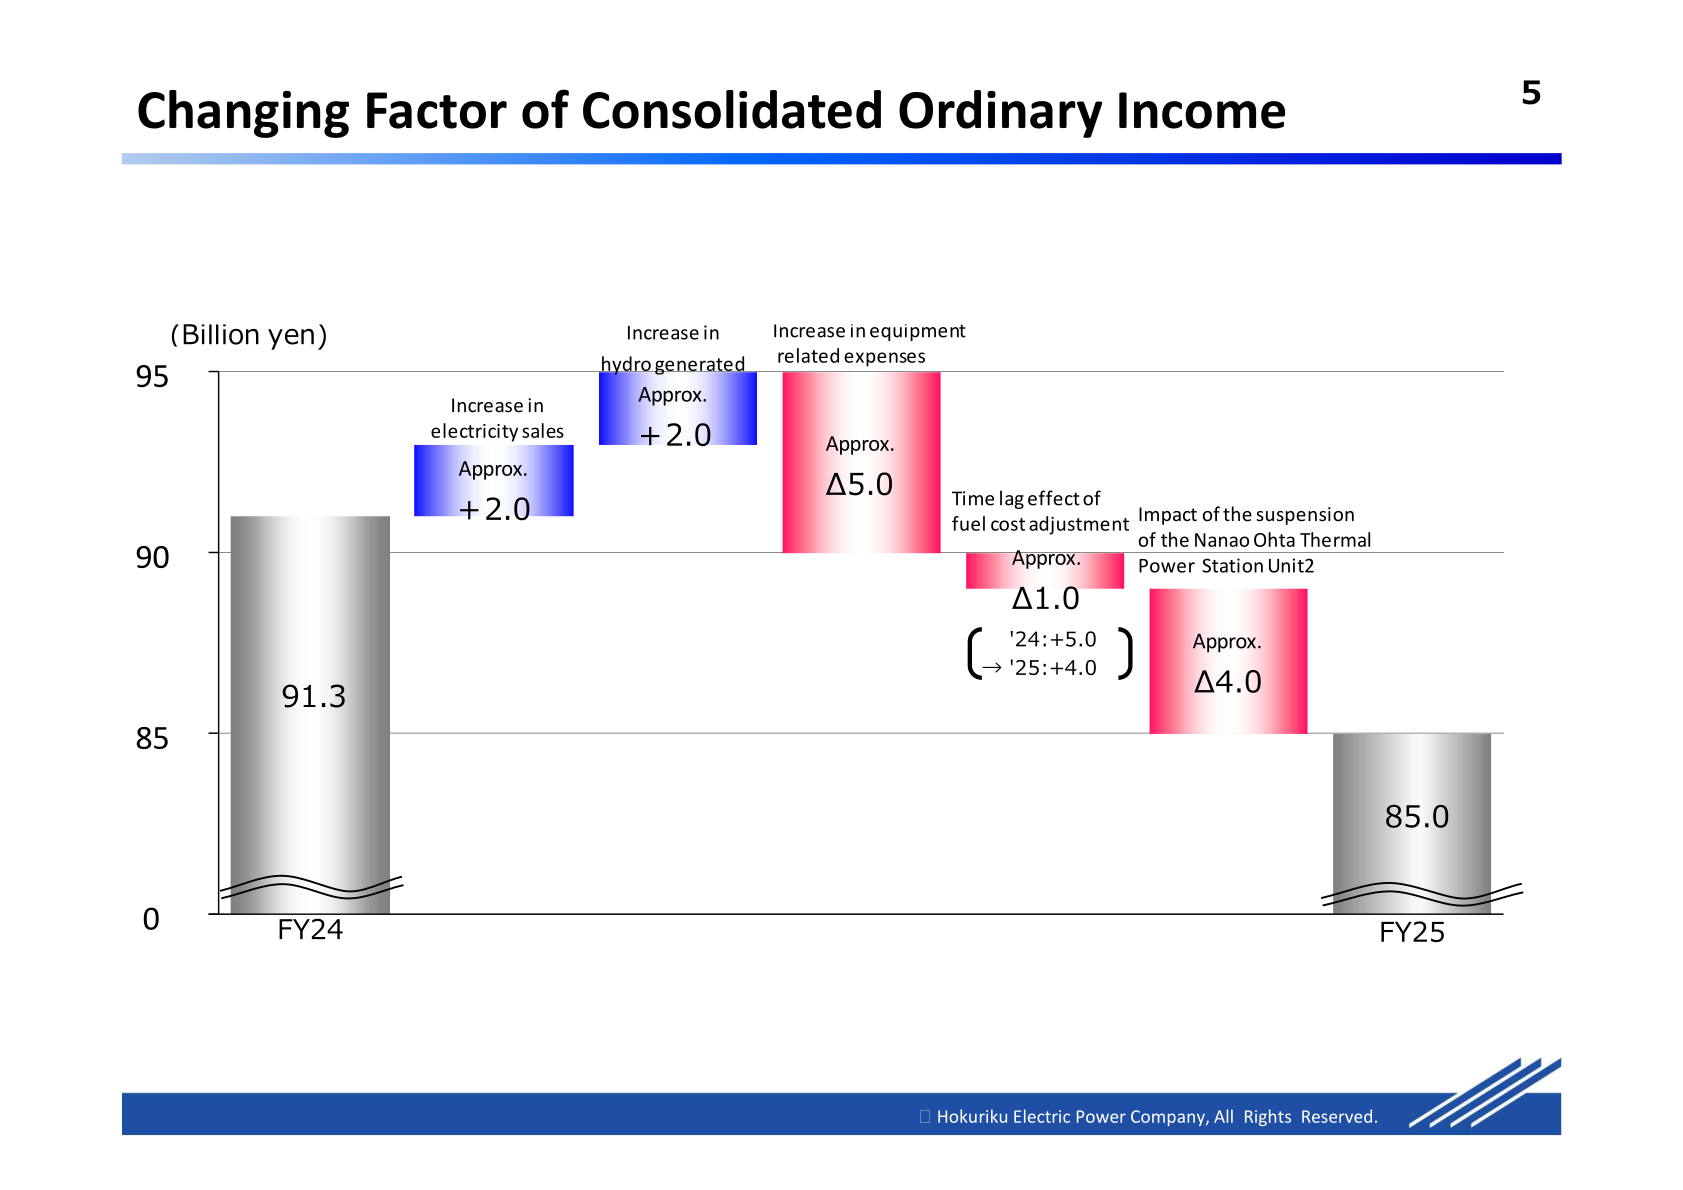
The bridge from FY24 ordinary income of 91.3 billion yen to FY25 ordinary income of 85.0 billion yen shows an increase in electricity sales of approximately +2.0 billion yen and an increase in hydro generated of approximately +2.0 billion yen, against an increase in equipment related expenses of approximately Δ5.0 billion yen, a time lag effect of fuel cost adjustment of approximately Δ1.0 billion yen (’24: +5.0 to ’25: +4.0) and an impact of the suspension of the Nanao Ohta Thermal Power Station Unit 2 of approximately Δ4.0 billion yen. On the sales bridge, an increase in electricity sales of approximately +9.0 billion yen was more than offset by a decrease in fuel cost adjustment charges, etc. of approximately Δ32.0 billion yen, a decrease in capacity market revenue of approximately Δ29.0 billion yen and the impact of transition to the equity method for Hokuriku Electrical Construction Co., Ltd of approximately Δ20.0 billion yen.
Segment Results
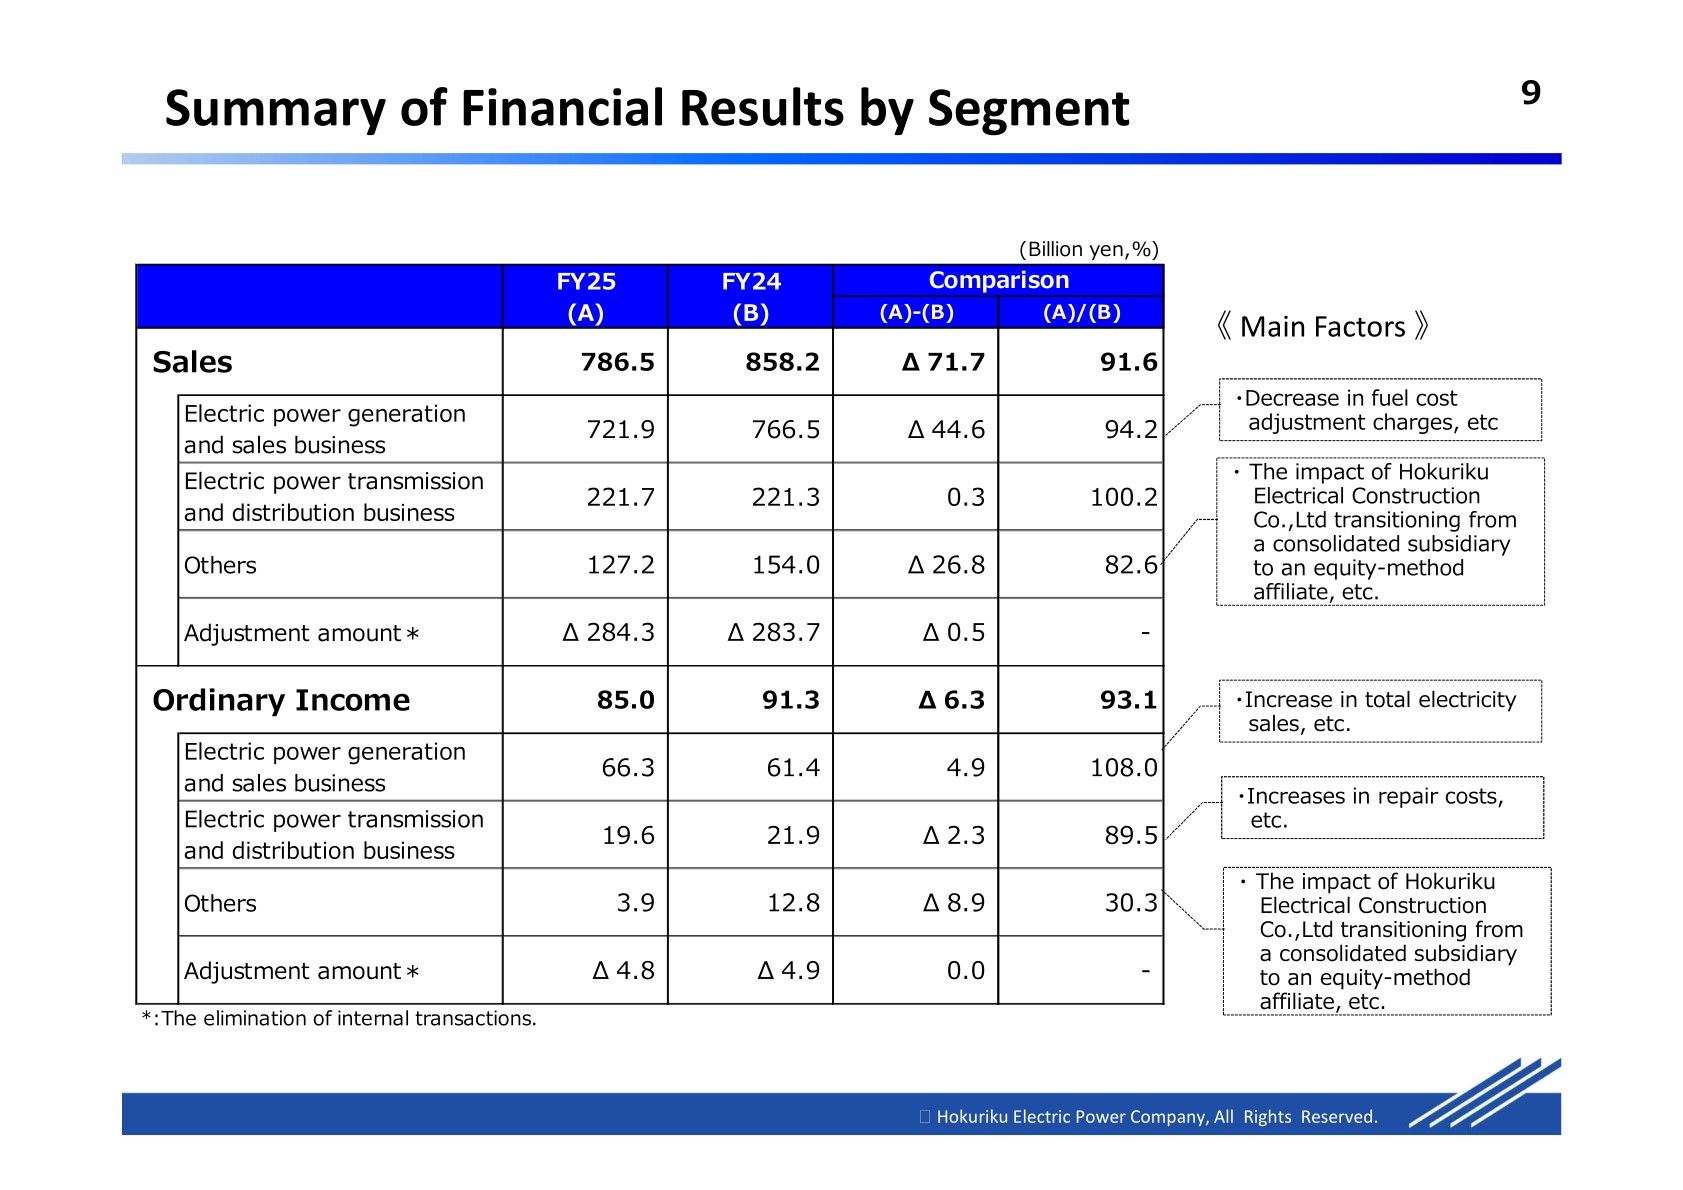
In the electric power generation and sales business, sales decreased to 721.9 billion yen on a decrease in fuel cost adjustment charges, etc., while ordinary income increased to 66.3 billion yen on an increase in total electricity sales, etc. The electric power transmission and distribution business posted almost flat sales of 221.7 billion yen and ordinary income of 19.6 billion yen, reflecting increases in repair costs, etc. Others saw sales fall to 127.2 billion yen and ordinary income fall to 3.9 billion yen, reflecting the impact of Hokuriku Electrical Construction Co., Ltd transitioning from a consolidated subsidiary to an equity-method affiliate, etc.
| Segment (Billion yen, %) | FY25 (A) | FY24 (B) | (A)-(B) | (A)/(B) |
|---|---|---|---|---|
| Sales — Total | 786.5 | 858.2 | Δ71.7 | 91.6 |
| Sales — Electric power generation and sales business | 721.9 | 766.5 | Δ44.6 | 94.2 |
| Sales — Electric power transmission and distribution business | 221.7 | 221.3 | 0.3 | 100.2 |
| Sales — Others | 127.2 | 154.0 | Δ26.8 | 82.6 |
| Sales — Adjustment amount | Δ284.3 | Δ283.7 | Δ0.5 | – |
| Ordinary Income — Total | 85.0 | 91.3 | Δ6.3 | 93.1 |
| Ordinary Income — Electric power generation and sales business | 66.3 | 61.4 | 4.9 | 108.0 |
| Ordinary Income — Electric power transmission and distribution business | 19.6 | 21.9 | Δ2.3 | 89.5 |
| Ordinary Income — Others | 3.9 | 12.8 | Δ8.9 | 30.3 |
| Ordinary Income — Adjustment amount | Δ4.8 | Δ4.9 | 0.0 | – |
FY2026 Forecast
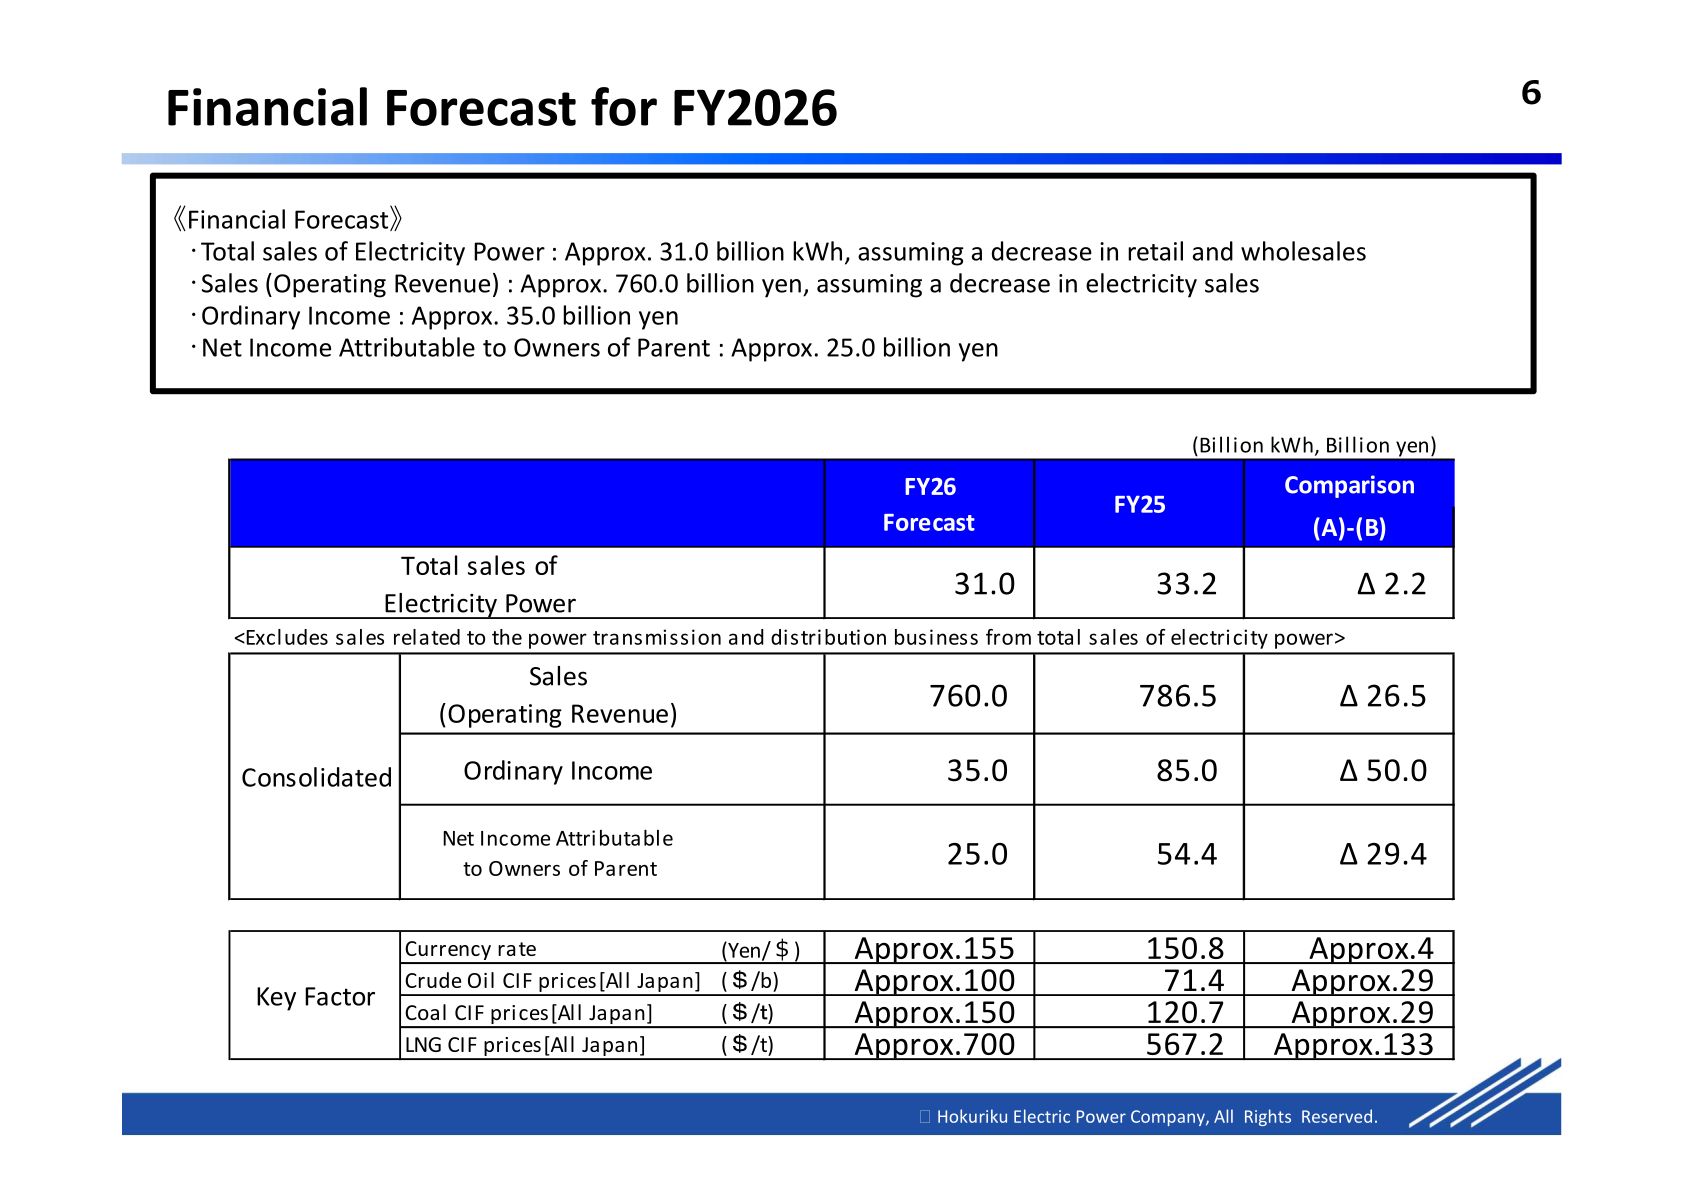
For FY2026 the company forecasts total sales of electricity power of approximately 31.0 billion kWh, assuming a decrease in retail and wholesales, sales (operating revenue) of approximately 760.0 billion yen assuming a decrease in electricity sales, ordinary income of approximately 35.0 billion yen and net income attributable to owners of parent of approximately 25.0 billion yen. Assumptions are a currency rate of approximately 155 yen/$, crude oil CIF prices of approximately $100/b, coal CIF prices of approximately $150/t and LNG CIF prices of approximately $700/t. The bridge from FY25 ordinary income of 85.0 billion yen shows a decrease in electricity sales of approximately Δ7.0 billion yen, a decrease in hydro generated of approximately Δ4.0 billion yen, an increase in equipment related expenses of approximately Δ7.0 billion yen, a time lag effect of fuel cost adjustment of approximately Δ12.0 billion yen (’25: +4.0 to ’26: Δ8.0, impact of the situation in the Middle East) and an impact of the suspension of the Nanao Ohta Thermal Power Station Unit 2 of approximately Δ20.0 billion yen.
| Item (Billion kWh, Billion yen) | FY26 Forecast | FY25 | Comparison |
|---|---|---|---|
| Total sales of Electricity Power | 31.0 | 33.2 | Δ2.2 |
| Sales (Operating Revenue) | 760.0 | 786.5 | Δ26.5 |
| Ordinary Income | 35.0 | 85.0 | Δ50.0 |
| Net Income Attributable to Owners of Parent | 25.0 | 54.4 | Δ29.4 |
| Currency rate (Yen/$) | Approx.155 | 150.8 | Approx.4 |
| Crude Oil CIF prices [All Japan] ($/b) | Approx.100 | 71.4 | Approx.29 |
| Coal CIF prices [All Japan] ($/t) | Approx.150 | 120.7 | Approx.29 |
| LNG CIF prices [All Japan] ($/t) | Approx.700 | 567.2 | Approx.133 |
Shareholder Returns
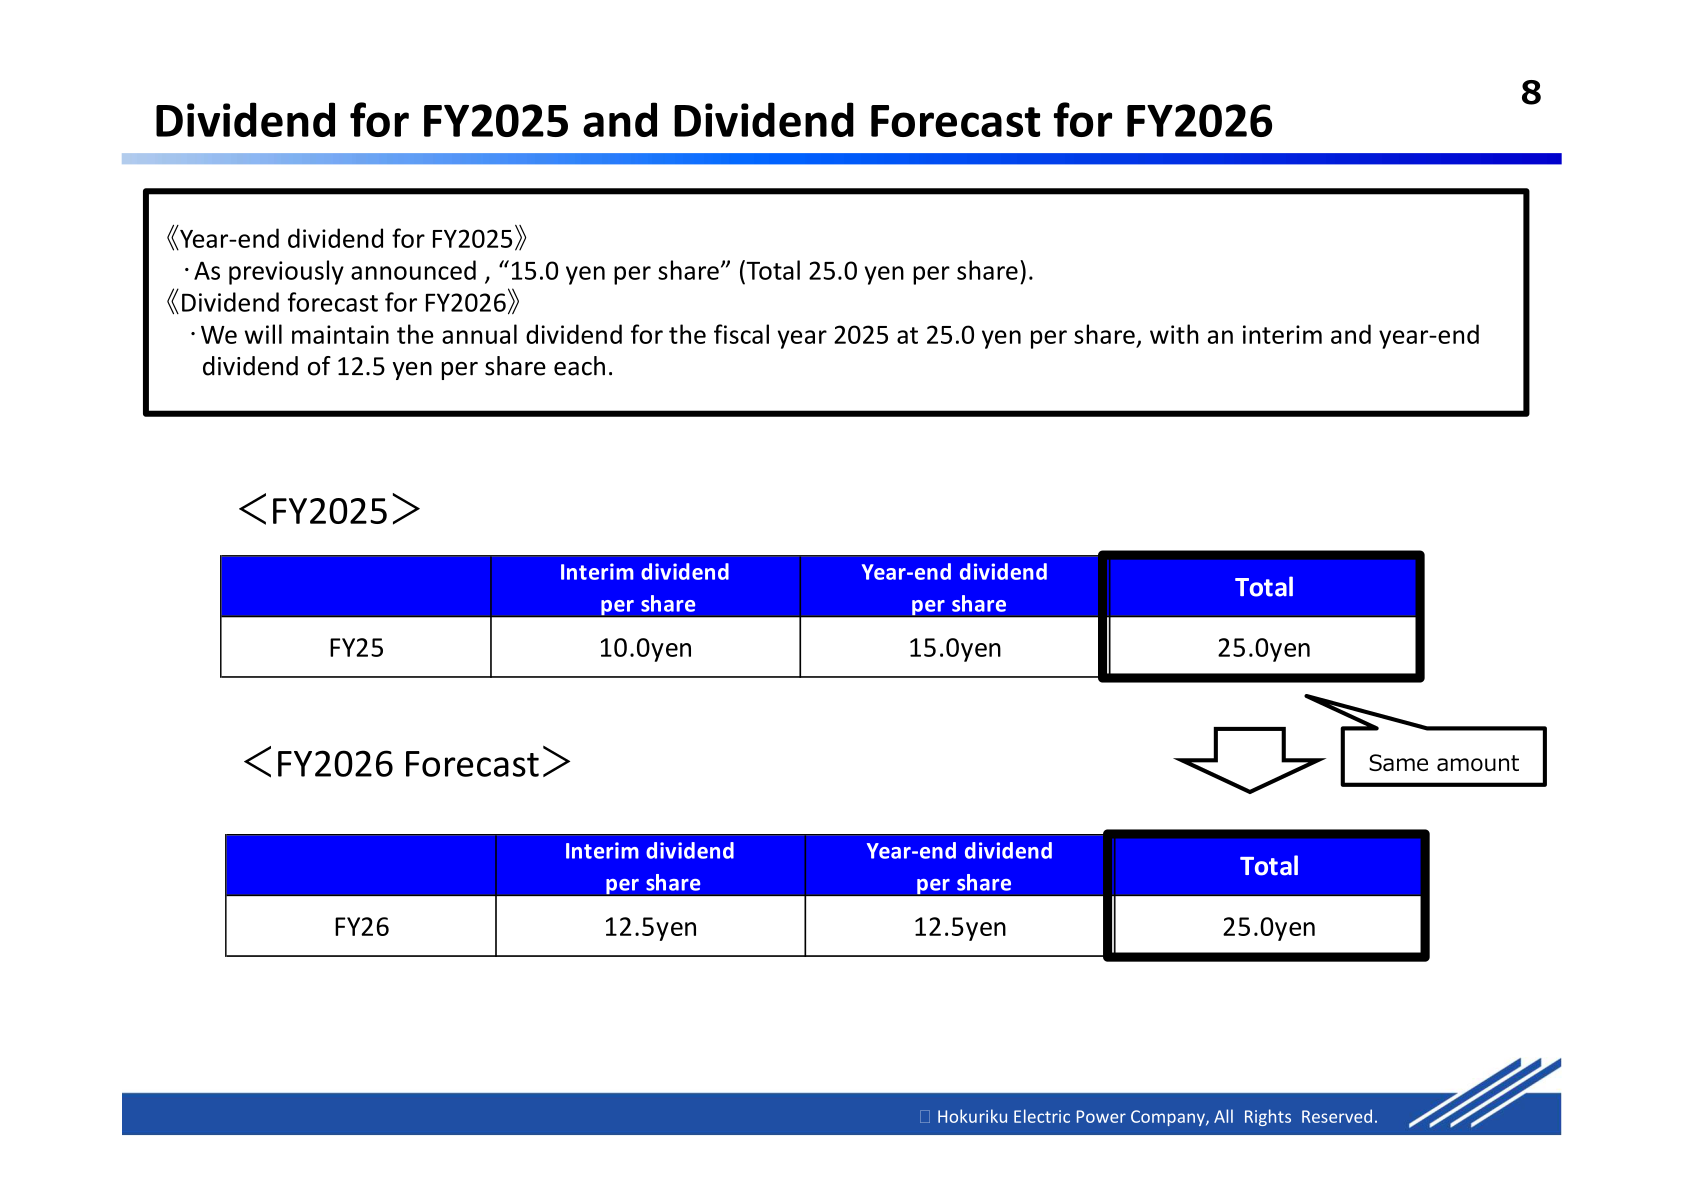
For FY2025 the year-end dividend is 15.0 yen per share as previously announced, giving an annual total of 25.0 yen per share alongside the interim dividend of 10.0 yen per share. For FY2026 the company plans to maintain the annual dividend at 25.0 yen per share, with an interim and year-end dividend of 12.5 yen per share each.
| Dividend per share | Interim | Year-end | Total |
|---|---|---|---|
| FY25 | 10.0yen | 15.0yen | 25.0yen |
| FY26 (Forecast) | 12.5yen | 12.5yen | 25.0yen |
Financial Position and Cash Flows
Total assets were 1,842.0 billion yen against 1,859.8 billion yen a year earlier, net assets rose to 451.3 billion yen from 400.8 billion yen, and the equity ratio improved to 24.4% from 20.5%. Outstanding interest-bearing debt decreased to 1,097.8 billion yen from 1,149.1 billion yen, and ROE was 13.1% against 18.9%. Cash flows from operating activities were 117.4 billion yen, investing activities were Δ48.5 billion yen and financing activities were Δ57.9 billion yen, giving free cash flow of 63.8 billion yen. Consolidated capital investment was 97.0 billion yen against 92.8 billion yen in FY24.
Topics: Time Lag Effect of Fuel Cost Adjustment Charges
The materials explain that fluctuation in fuel prices causes a time lag between payment of fuel cost and reception of fuel cost adjustment charges, resulting in a temporary increase or decrease in income. The time lag effect was approximately 5.0 billion yen in FY24 and approximately 4.0 billion yen in FY25, and the FY2026 forecast bridge assumes it turns to Δ8.0 billion yen.
This article is an analysis based on publicly available information and is not a recommendation to buy or sell any specific securities. Investment decisions are your own responsibility.
![[Obayashi] Investors’ Guide 2026 — The Complete 24-Article Breakdown](https://japan-equity.com/wp-content/uploads/2026/07/hub_cover-1024x1024.png)
![[Obayashi] IR & SR Policy — Feeding Dialogue Back into Management](https://japan-equity.com/wp-content/uploads/2026/07/p32_sq-1024x1024.jpg)
![[Obayashi] Real Estate Development — 18.7% Margin, ¥287.7bn Unrealized Gains](https://japan-equity.com/wp-content/uploads/2026/07/p20_sq-1024x1024.jpg)
![[Obayashi] Domestic Civil Engineering — Resilience Spending Supports 9.6% Margin](https://japan-equity.com/wp-content/uploads/2026/07/p11_sq-1024x1024.jpg)
![[Obayashi] Share Price & External Ratings — vs TOPIX, ESG Index Inclusion](https://japan-equity.com/wp-content/uploads/2026/07/p40_sq-1024x1024.jpg)
![[Construction] ¥75.5tn Investment, Shrinking Workforce — Big-5 Market Share](https://japan-equity.com/wp-content/uploads/2026/07/p12_sq-1024x1024.jpg)



![[Obayashi] Capital Policy & Shareholder Returns — ROE 10%+, DOE ~5%, ¥100bn Buyback](https://japan-equity.com/wp-content/uploads/2026/07/p27_sq-1024x1024.jpg)
![[Obayashi] Reducing Cross-Shareholdings — ¥285.2bn Sold in Five Years](https://japan-equity.com/wp-content/uploads/2026/07/p29_sq-1024x1024.jpg)
![[Obayashi] ¥750bn Investment Plan — ¥300bn to Development, ¥190bn to Tech/DX](https://japan-equity.com/wp-content/uploads/2026/07/p30_sq-1024x1024.jpg)
![[Obayashi] MTP2022 KPIs — Operating Profit ~2x Target, ROE 14.4%](https://japan-equity.com/wp-content/uploads/2026/07/p25_sq-1024x1024.jpg)
![[Obayashi] Cash Allocation — ¥420bn Investment CF Over Five Years](https://japan-equity.com/wp-content/uploads/2026/07/p26_sq-1024x1024.jpg)
![[Obayashi] Green Energy — 44 Plants, 344MW, and the Green Hydrogen Challenge](https://japan-equity.com/wp-content/uploads/2026/07/p21_sq-1024x1024.jpg)
![[Obayashi] Tackling the Labor Shortage — Robotics Construction®](https://japan-equity.com/wp-content/uploads/2026/07/p14_sq-1024x1024.jpg)
