
This article is based on publicly available IR materials and is not a recommendation to buy or sell any specific securities.
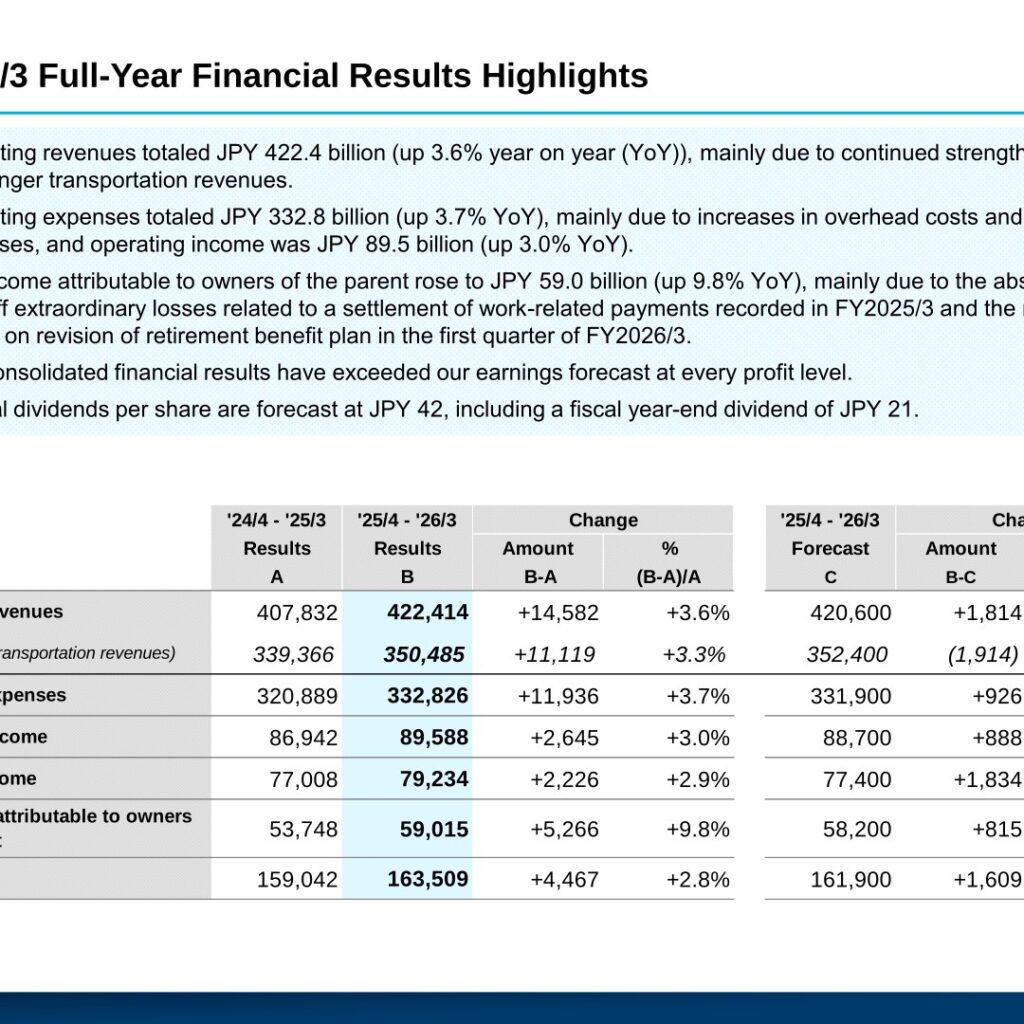
Tokyo Metro reported operating revenues of JPY 422.4 billion for FY2026/3, up 3.6% year on year (YoY), mainly due to continued strength in passenger transportation revenues. Operating expenses totaled JPY 332.8 billion (up 3.7% YoY) and operating income was JPY 89.5 billion (up 3.0% YoY), while net income attributable to owners of the parent rose to JPY 59.0 billion (up 9.8% YoY). The company states that its consolidated financial results exceeded its earnings forecast at every profit level. Note: the presentation states that “FY2026/3 means the fiscal year ended March 31, 2026”; this article is classified as FY2025 under our site’s fiscal-year convention, while the text, tables and segment data below keep the labels used in the source materials.
Consolidated Results (Full-Year Actual)
Net income attributable to owners of the parent increased mainly due to the absence of one-off extraordinary losses related to a settlement of work-related payments recorded in FY2025/3 and the recording of a gain on revision of retirement benefit plan in the first quarter of FY2026/3. EBITDA was JPY 163,509 million, up 2.8% YoY. Against the company’s own forecast for the year, operating revenues came in JPY 1,814 million higher (+0.4%), operating income JPY 888 million higher (+1.0%), and net income attributable to owners of the parent JPY 815 million higher (+1.4%).
| Item (JPY mm) | ’24/4 – ’25/3 Results | ’25/4 – ’26/3 Results | Change (Amount) | Change (%) |
|---|---|---|---|---|
| Operating revenues | 407,832 | 422,414 | +14,582 | +3.6% |
| (Passenger transportation revenues) | 339,366 | 350,485 | +11,119 | +3.3% |
| Operating expenses | 320,889 | 332,826 | +11,936 | +3.7% |
| Operating income | 86,942 | 89,588 | +2,645 | +3.0% |
| Ordinary income | 77,008 | 79,234 | +2,226 | +2.9% |
| Net income attributable to owners of the parent | 53,748 | 59,015 | +5,266 | +9.8% |
| EBITDA | 159,042 | 163,509 | +4,467 | +2.8% |
Segment Results
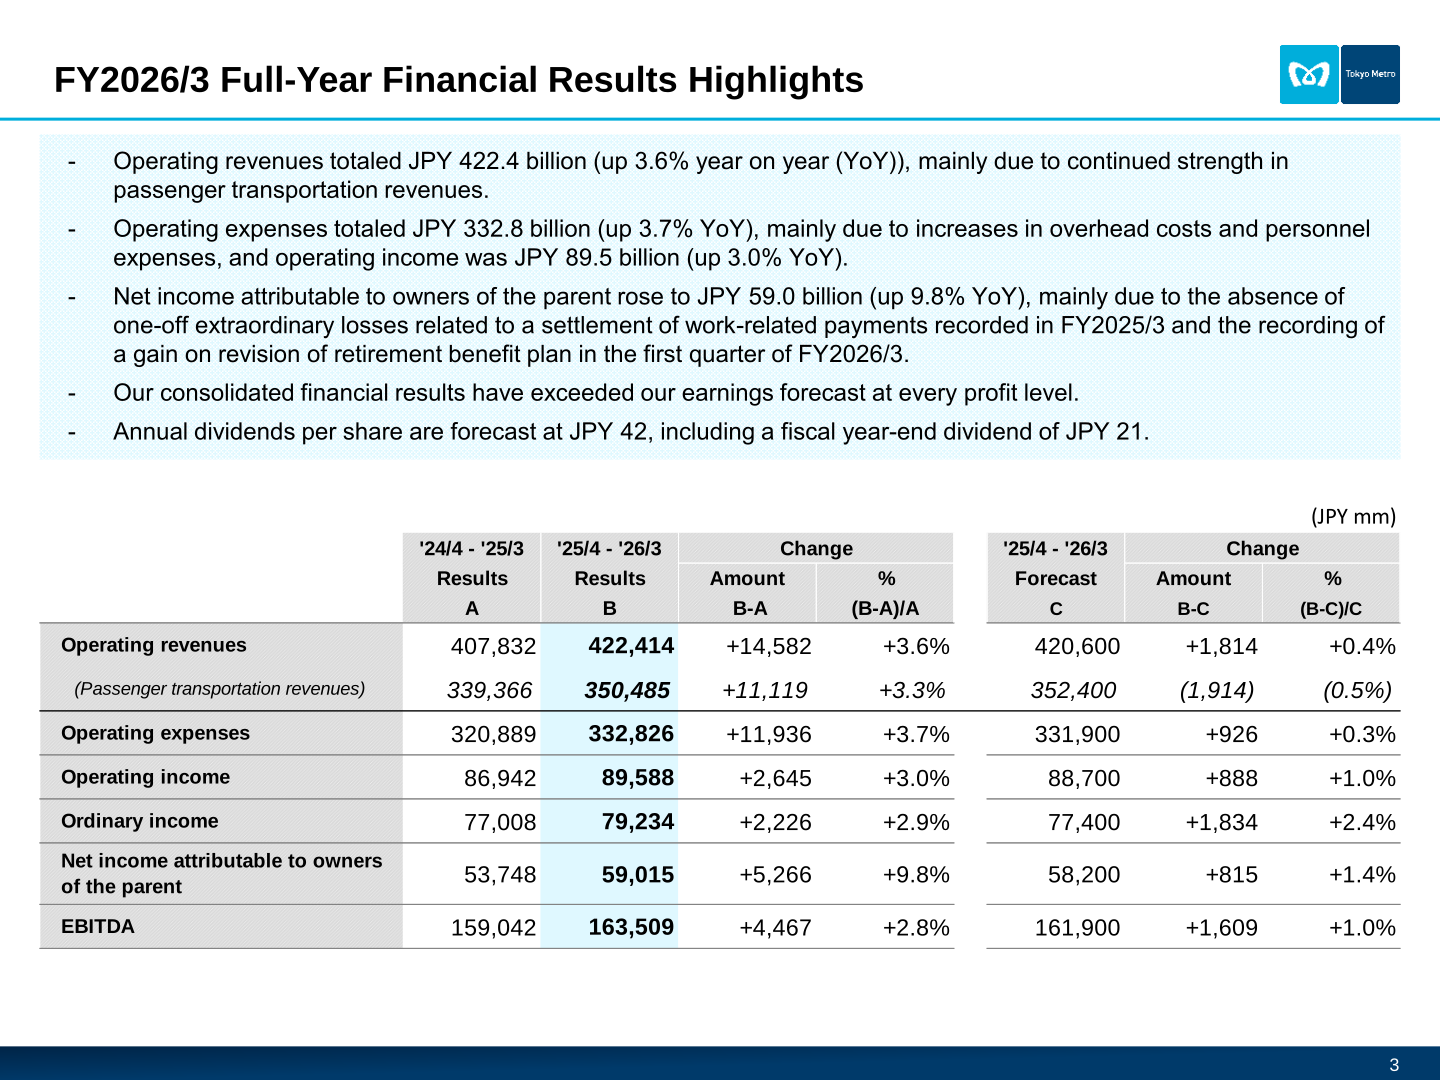
In the Transportation Business, operating revenues totaled JPY 386.6 billion (up 3.8% YoY) and operating income totaled JPY 76.1 billion (up 2.7% YoY), mainly due to continued strength in passenger transportation revenues. Passenger transportation revenues of JPY 350,485 million comprised commuter revenues of JPY 134,162 million (up 3.2% YoY) and non-commuter revenues of JPY 216,323 million (up 3.3% YoY). The number of transported passengers was 2,571,229 thousand, up 3.0% YoY. Ticket gate entries and exits increased by 3.1% on weekdays and by 3.0% on weekends and holidays; by area, weekday ticket gate entries and exits increased by 3.2% in the five central wards of Tokyo and by 2.9% in areas outside the five central wards.
In the Real Estate Business, operating revenues totaled JPY 14.6 billion (up 0.2% YoY), mainly due to contributions from acquired and newly opened properties, including TS Aoyama Building and Metro Stage PLUS Nakano-Yayoicho, as well as an increase in rental income from Shibuya Mark City, despite a decrease in rental income following property sales carried out in FY2025/3. Operating income totaled JPY 4.3 billion (up 4.7% YoY), as expenses also declined following property sales.
In the Consumer and Corporate Services Business, operating revenues were JPY 26.3 billion (up 2.5% YoY) and operating income was JPY 8.5 billion (up 3.2% YoY). By service, consumer service revenues were JPY 14.5 billion (up 2.2% YoY) with operating income of JPY 3.5 billion (up 4.2% YoY), mainly reflecting higher rental income from existing stores and newly opened properties including M’av Urayasu EAST; advertising service revenues were JPY 7.2 billion (up 4.1% YoY) with operating income of JPY 1.4 billion (up 34.8% YoY), mainly on higher sales of advertising media in stations and on trains; and communication service revenues were JPY 4.2 billion (down 0.2% YoY) with operating income of JPY 4.0 billion (up 0.7% YoY).
| Segment | Metric (JPY mm) | ’24/4 – ’25/3 | ’25/4 – ’26/3 | Change (%) |
|---|---|---|---|---|
| Transportation Business | Operating revenues | 372,500 | 386,618 | +3.8% |
| Transportation Business | Operating income | 74,217 | 76,189 | +2.7% |
| Real Estate Business | Operating revenues | 14,663 | 14,694 | +0.2% |
| Real Estate Business | Operating income | 4,200 | 4,399 | +4.7% |
| Consumer and Corporate Services Business | Operating revenues | 25,757 | 26,388 | +2.5% |
| Consumer and Corporate Services Business | Operating income | 8,259 | 8,527 | +3.2% |
| Others | Operating revenues | 3,743 | 3,994 | +6.7% |
| Others | Operating income | 152 | 349 | +129.1% |
| Adjustments | Operating income | 112 | 120 | +7.6% |
FY2027/3 Forecast
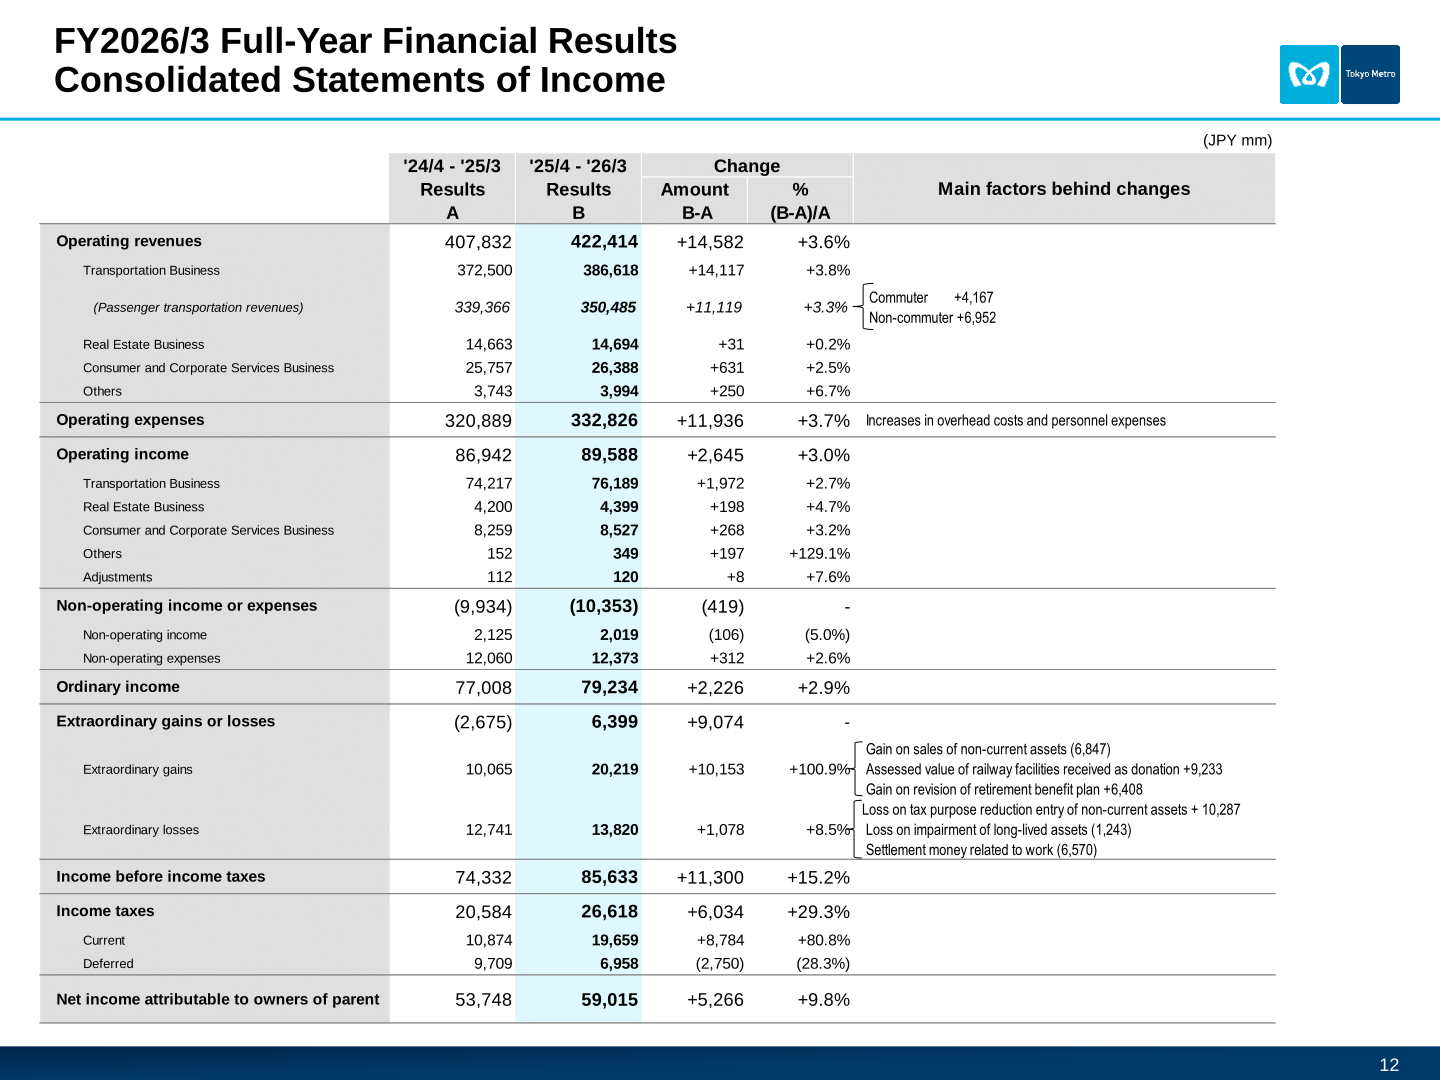
For FY2027/3, operating revenues are forecast at JPY 437.2 billion (up 3.5% YoY), mainly due to higher passenger transportation revenues driven by increased commuting demand and the solid economy along the company’s lines; passenger transportation revenues for FY2027/3 also include the positive demand shift to Tokyo Metro’s lines following JR East’s fare revisions implemented on March 14, 2026, which is expected to affect non-commuter revenues only. Operating expenses are forecast at JPY 355.7 billion (up 6.9% YoY), as the company has decided to secure in a planned manner the expenses necessary for the repair and renewal of railway facilities amid rising labor costs and material prices. As a result, operating income is forecast at JPY 81.4 billion (down 9.1% YoY) and net income attributable to owners of the parent at JPY 50.0 billion (down 15.3% YoY), with gains on sales of properties expected to be recorded alongside an increase in interest expenses and other factors. The company states that the impact of the situation in the Middle East is still under review and has therefore not been factored into the earnings forecast at this time.
| Item (JPY mm) | ’25/4 – ’26/3 Results | ’26/4 – ’27/3 Forecast | Change (Amount) | Change (%) |
|---|---|---|---|---|
| Operating revenues | 422,414 | 437,200 | +14,785 | +3.5% |
| (Passenger transportation revenues) | 350,485 | 365,000 | +14,514 | +4.1% |
| Operating expenses | 332,826 | 355,700 | +22,873 | +6.9% |
| Operating income | 89,588 | 81,400 | (8,188) | (9.1%) |
| Ordinary income | 79,234 | 69,000 | (10,234) | (12.9%) |
| Net income attributable to owners of the parent | 59,015 | 50,000 | (9,015) | (15.3%) |
| EBITDA | 163,509 | 157,700 | (5,809) | (3.6%) |
By segment, Transportation Business operating revenues are forecast at JPY 398,300 million (up 3.0% YoY) with operating income of JPY 66,800 million (down 12.3% YoY); Real Estate Business operating revenues at JPY 15,300 million (up 4.1% YoY) with operating income of JPY 4,000 million (down 9.1% YoY), mainly due to higher expenses associated with property development and renewals; and Consumer and Corporate Services Business operating revenues at JPY 27,800 million (up 5.3% YoY) with operating income of JPY 10,100 million (up 18.4% YoY). Beginning in FY2027/3, the classification of certain properties within the Real Estate Business segment and of certain businesses within the Consumer and Corporate Services Business segment has been changed, and FY2026/3 figures in those segment tables have also been reclassified based on the revised classification.
Shareholder Returns
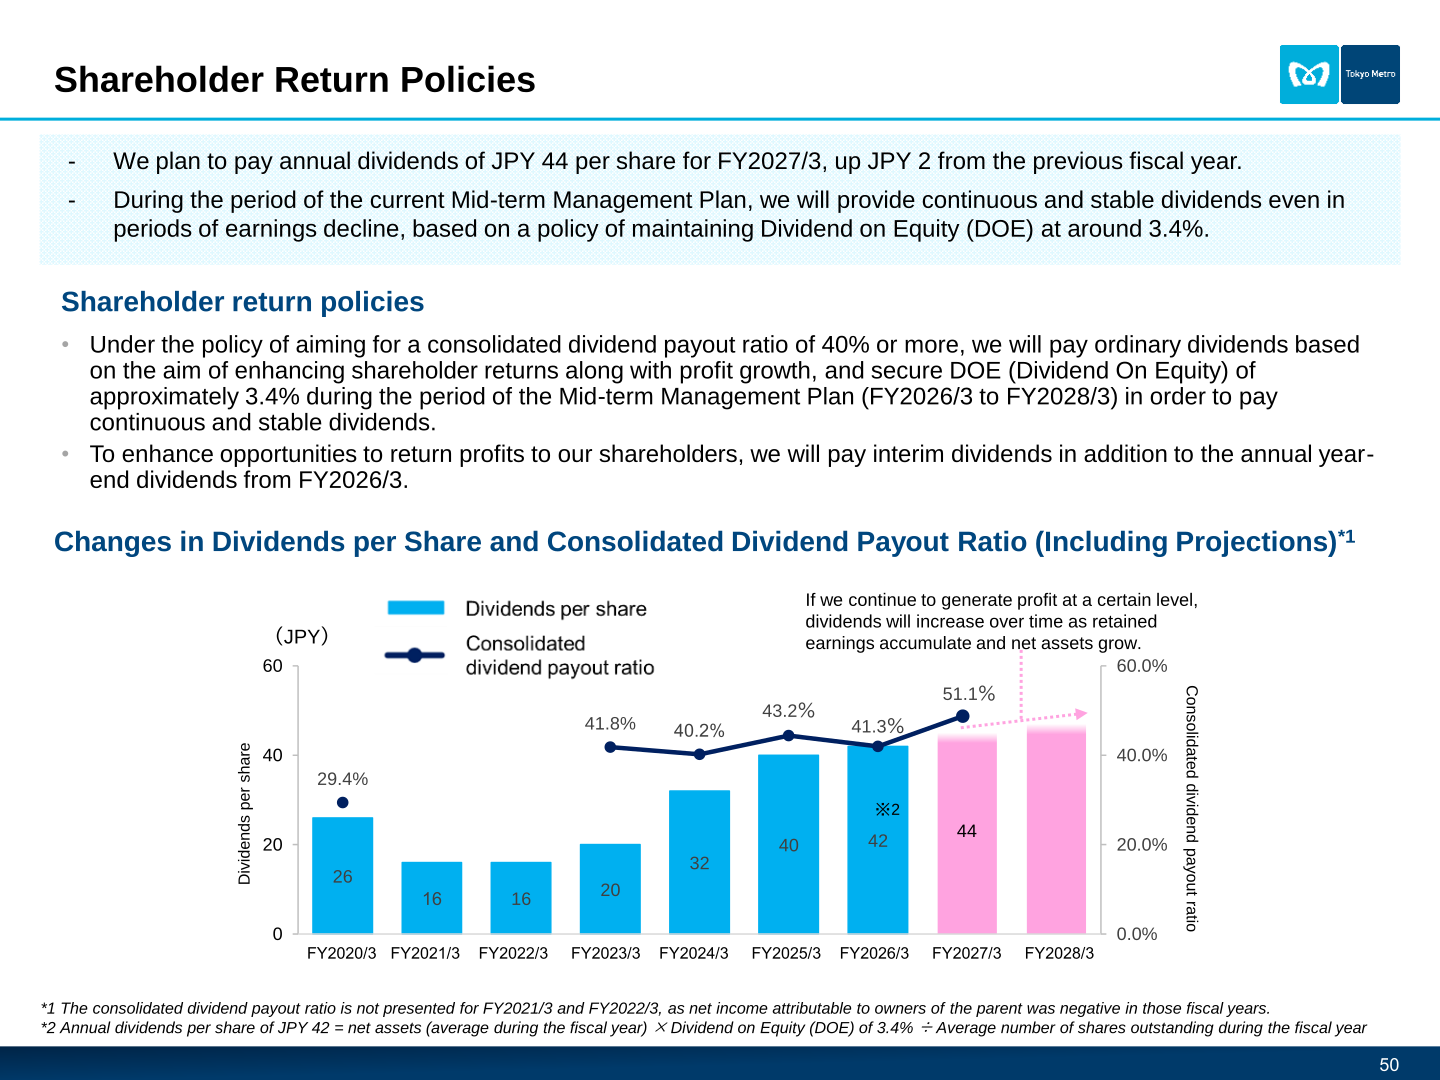
Annual dividends per share for FY2026/3 are JPY 42, including a fiscal year-end dividend of JPY 21. For FY2027/3, Tokyo Metro plans to pay annual dividends of JPY 44 per share, up JPY 2 from the previous fiscal year. Under its shareholder return policy, the company aims for a consolidated dividend payout ratio of 40% or more, paying ordinary dividends based on the aim of enhancing shareholder returns along with profit growth, and securing DOE (Dividend On Equity) of approximately 3.4% during the period of the Mid-term Management Plan (FY2026/3 to FY2028/3) in order to pay continuous and stable dividends. To enhance opportunities to return profits to shareholders, the company will pay interim dividends in addition to the annual year-end dividends from FY2026/3. The presentation notes that annual dividends per share of JPY 42 equal net assets (average during the fiscal year) multiplied by DOE of 3.4% divided by the average number of shares outstanding during the fiscal year.
| Item | FY2024/3 | FY2025/3 | FY2026/3 | FY2027/3 (Projection) |
|---|---|---|---|---|
| Dividends per share (JPY) | 32 | 40 | 42 | 44 |
| Consolidated dividend payout ratio | 40.2% | 43.2% | 41.3% | 51.1% |
Mid-term Management Plan and Topics
Consolidated ROE was 8.1% at the end of FY2026/3, having temporarily declined due to the spread of the COVID pandemic. The company recognizes its cost of equity at around 6% and acknowledges the expectation from stakeholders to further enhance ROE through profit growth and shareholder returns. Management targets in the current Mid-term Management Plan cover consolidated ROE, consolidated operating income, consolidated EBITDA and the consolidated net interest-bearing debt / EBITDA ratio: for FY2028/3 the initial targets are ROE of 7.7%, operating income of 93.0 billion JPY, EBITDA of 174.0 billion JPY and a net debt / EBITDA ratio of 6.3x (5.2x when new line construction promotion long-term loans are excluded). Due to changes in the business environment, including rising labor costs and material prices, achieving the targets set in the current Mid-term Management Plan has become challenging; the company is assessing the impact and plans to provide an update around the time of the FY2027/3 second quarter financial results announcement.
In response to the changing business environment, Tokyo Metro is addressing four priorities with urgency: enhancing the sustainability of the railway business, pursuing new growth opportunities, scaling up growth investments, and considering fare revisions. Measures include securing repair expenses on a planned basis, strengthening cost management, promoting human capital management, and responding to a declining labor force through automated train operation, Condition Based Maintenance, AI and DX, aiming to build an operating structure that will allow the entire railway business to be operated with a workforce of 9,000 by FY2031/3. The Yurakucho Line and Namboku Line extensions are being advanced with service commencement targeted in the mid-2030s. A dedicated team to execute investments and M&A was established in FY2027/3, and the company has newly established an investment and M&A allocation of JPY 100.0 billion over the two-year period covering FY2027/3 and FY2028/3.
Non-consolidated capital investment in FY2026/3 totaled JPY 98,973 million, comprising JPY 71,203 million in the railway business, JPY 16,008 million in the urban design and lifestyle creation business, and JPY 11,760 million in new railway line construction. For FY2027/3 the plan is JPY 136,546 million in total, comprising JPY 82,394 million in the railway business, JPY 37,203 million in the non-railway (urban design and lifestyle creation) business and JPY 16,948 million in new railway line construction.
This article is an analysis based on publicly available information and is not a recommendation to buy or sell any specific securities. Investment decisions are your own responsibility.
![[Obayashi] Investors’ Guide 2026 — The Complete 24-Article Breakdown](https://japan-equity.com/wp-content/uploads/2026/07/hub_cover-1024x1024.png)
![[Obayashi] IR & SR Policy — Feeding Dialogue Back into Management](https://japan-equity.com/wp-content/uploads/2026/07/p32_sq-1024x1024.jpg)
![[Obayashi] Real Estate Development — 18.7% Margin, ¥287.7bn Unrealized Gains](https://japan-equity.com/wp-content/uploads/2026/07/p20_sq-1024x1024.jpg)
![[Obayashi] Domestic Civil Engineering — Resilience Spending Supports 9.6% Margin](https://japan-equity.com/wp-content/uploads/2026/07/p11_sq-1024x1024.jpg)
![[Obayashi] Share Price & External Ratings — vs TOPIX, ESG Index Inclusion](https://japan-equity.com/wp-content/uploads/2026/07/p40_sq-1024x1024.jpg)
![[Construction] ¥75.5tn Investment, Shrinking Workforce — Big-5 Market Share](https://japan-equity.com/wp-content/uploads/2026/07/p12_sq-1024x1024.jpg)



![[Obayashi] Capital Policy & Shareholder Returns — ROE 10%+, DOE ~5%, ¥100bn Buyback](https://japan-equity.com/wp-content/uploads/2026/07/p27_sq-1024x1024.jpg)
![[Obayashi] Reducing Cross-Shareholdings — ¥285.2bn Sold in Five Years](https://japan-equity.com/wp-content/uploads/2026/07/p29_sq-1024x1024.jpg)
![[Obayashi] ¥750bn Investment Plan — ¥300bn to Development, ¥190bn to Tech/DX](https://japan-equity.com/wp-content/uploads/2026/07/p30_sq-1024x1024.jpg)
![[Obayashi] MTP2022 KPIs — Operating Profit ~2x Target, ROE 14.4%](https://japan-equity.com/wp-content/uploads/2026/07/p25_sq-1024x1024.jpg)
![[Obayashi] Cash Allocation — ¥420bn Investment CF Over Five Years](https://japan-equity.com/wp-content/uploads/2026/07/p26_sq-1024x1024.jpg)
![[Obayashi] Green Energy — 44 Plants, 344MW, and the Green Hydrogen Challenge](https://japan-equity.com/wp-content/uploads/2026/07/p21_sq-1024x1024.jpg)
![[Obayashi] Tackling the Labor Shortage — Robotics Construction®](https://japan-equity.com/wp-content/uploads/2026/07/p14_sq-1024x1024.jpg)
