
This article is based on publicly available IR materials and is not a recommendation to buy or sell any specific securities.
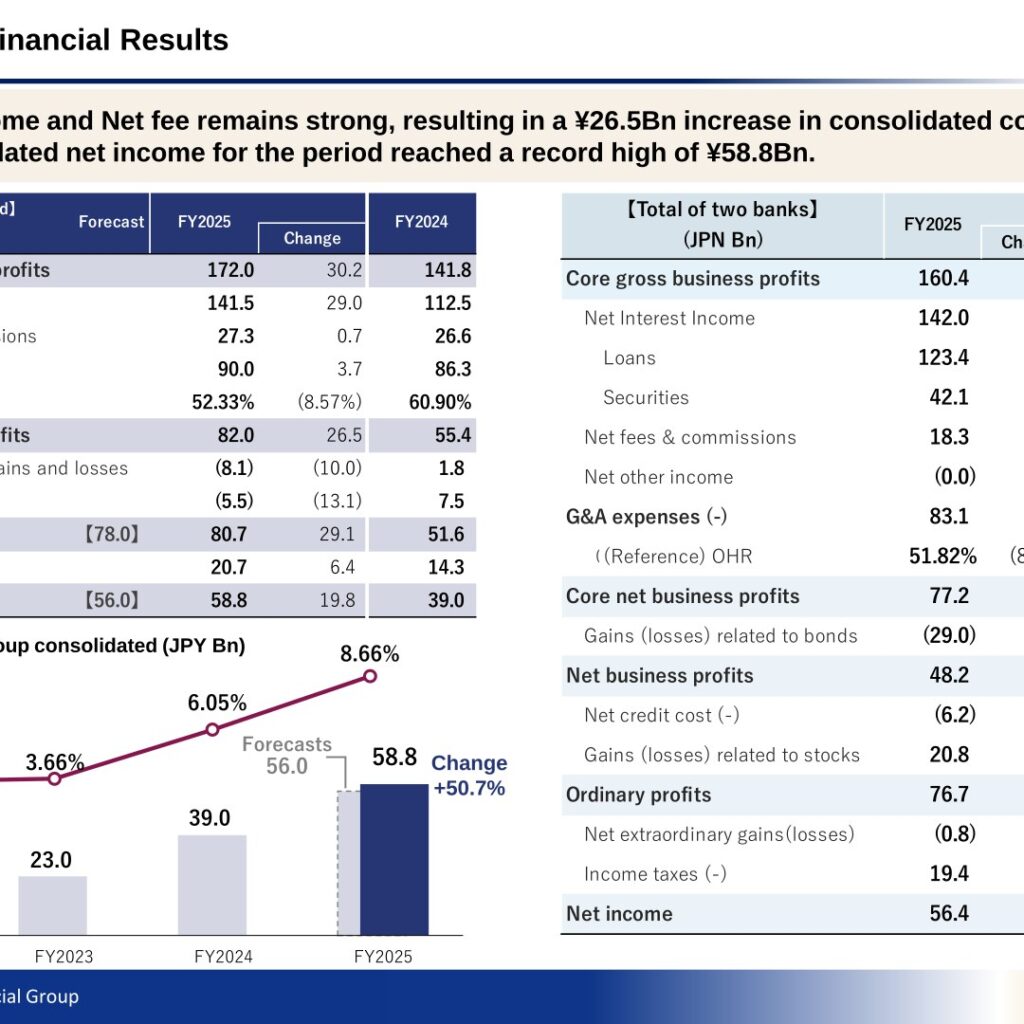
Hokuhoku Financial Group, the holding company of The Hokuriku Bank and The Hokkaido Bank, reported results for FY2025 (ended March 31, 2026). Core net business profits on a group consolidated basis increased by ¥26.5 billion year on year to ¥82.0 billion, driven mainly by higher net interest income on the back of higher interest rates. Consolidated net income rose by ¥19.8 billion to ¥58.8 billion, which the company describes as a record high, and ROE improved by 2.61 percentage points to 8.66%. For FY2026 the company forecasts consolidated ordinary profits of ¥89.0 billion and consolidated net income of ¥62.0 billion, with a common stock dividend of ¥150 per share and an acquisition of treasury shares of ¥10 billion.
Consolidated Results (Full-Year Actual)
On a group consolidated basis, core gross business profits rose ¥30.2 billion to ¥172.0 billion, with net interest income up ¥29.0 billion to ¥141.5 billion and net fees & commissions up ¥0.7 billion to ¥27.3 billion. G&A expenses increased ¥3.7 billion to ¥90.0 billion, and OHR improved to 52.33% from 60.90%. Ordinary profits of ¥80.7 billion and net income of ¥58.8 billion both exceeded the company’s forecasts of ¥78.0 billion and ¥56.0 billion shown in the results table. Figures are in JPY billion (JPN Bn) as presented in the materials; parentheses indicate negative figures.
| 【Group Consolidated】(JPN Bn) | FY2025 | Change | FY2024 |
|---|---|---|---|
| Core gross business profits | 172.0 | 30.2 | 141.8 |
| Net Interest Income | 141.5 | 29.0 | 112.5 |
| Net fees & commissions | 27.3 | 0.7 | 26.6 |
| G&A expenses (-) | 90.0 | 3.7 | 86.3 |
| (Reference) OHR | 52.33% | (8.57%) | 60.90% |
| Core net business profits | 82.0 | 26.5 | 55.4 |
| Securities-related gains and losses | (8.1) | (10.0) | 1.8 |
| Net credit cost (-) | (5.5) | (13.1) | 7.5 |
| Ordinary profits | 80.7 | 29.1 | 51.6 |
| Income taxes (-) | 20.7 | 6.4 | 14.3 |
| Net income | 58.8 | 19.8 | 39.0 |
For the two banks combined, core gross business profits increased ¥28.7 billion to ¥160.4 billion and core net business profits increased ¥25.3 billion to ¥77.2 billion, with OHR improving to 51.82% from 60.54%. Gains (losses) related to bonds were (¥29.0 billion), while gains (losses) related to stocks were ¥20.8 billion, and net credit cost was (¥6.2 billion), a reversal of ¥13.1 billion from the previous period.
| 【Total of two banks】(JPN Bn) | FY2025 | Change | FY2024 |
|---|---|---|---|
| Core gross business profits | 160.4 | 28.7 | 131.7 |
| Net Interest Income | 142.0 | 28.4 | 113.5 |
| Loans | 123.4 | 27.0 | 96.4 |
| Securities | 42.1 | 13.1 | 29.0 |
| Net fees & commissions | 18.3 | (0.4) | 18.8 |
| Net other income | (0.0) | 0.6 | (0.7) |
| G&A expenses (-) | 83.1 | 3.3 | 79.7 |
| (Reference) OHR | 51.82% | (8.72%) | 60.54% |
| Core net business profits | 77.2 | 25.3 | 51.9 |
| Gains (losses) related to bonds | (29.0) | (20.6) | (8.3) |
| Net business profits | 48.2 | 4.6 | 43.6 |
| Net credit cost (-) | (6.2) | (13.1) | 6.8 |
| Gains (losses) related to stocks | 20.8 | 10.8 | 10.0 |
| Ordinary profits | 76.7 | 29.4 | 47.2 |
| Net extraordinary gains (losses) | (0.8) | (2.9) | 2.1 |
| Income taxes (-) | 19.4 | 6.2 | 13.2 |
| Net income | 56.4 | 20.3 | 36.1 |
Breakdown by Subsidiary Bank
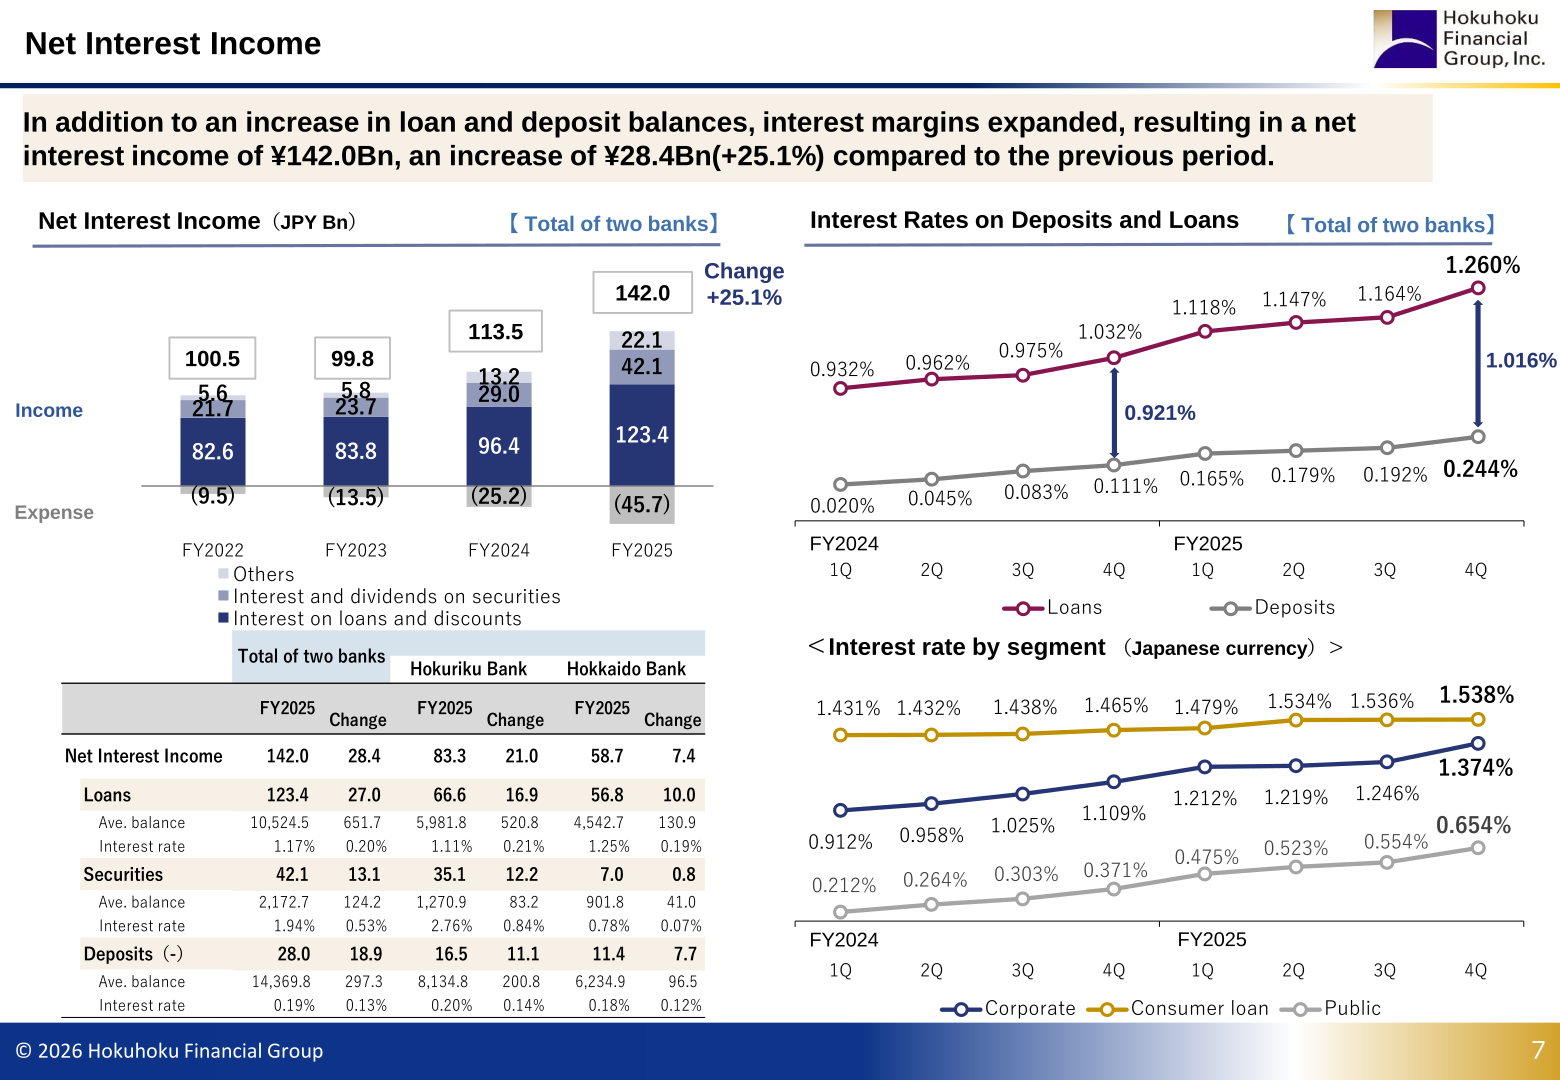
Net interest income for the two banks combined reached ¥142.0 billion, an increase of ¥28.4 billion (+25.1%), as loan and deposit balances grew and interest margins expanded. Hokuriku Bank contributed ¥83.3 billion (up ¥21.0 billion) and Hokkaido Bank ¥58.7 billion (up ¥7.4 billion). The average balance of loans for the two banks combined was ¥10,524.5 billion at an interest rate of 1.17%, and the average balance of deposits was ¥14,369.8 billion at 0.19%. G&A expenses rose ¥3.3 billion to ¥83.1 billion on investments in human capital and systems. Net credit costs were a net reversal of (¥6.2 billion) for the two banks combined, split (¥3.1 billion) at Hokuriku Bank and (¥3.1 billion) at Hokkaido Bank.
| FY2025 (JPY Bn) | Total of two banks | Hokuriku Bank | Hokkaido Bank |
|---|---|---|---|
| Net Interest Income | 142.0 | 83.3 | 58.7 |
| Loans | 123.4 | 66.6 | 56.8 |
| Ave. balance (loans) | 10,524.5 | 5,981.8 | 4,542.7 |
| Interest rate (loans) | 1.17% | 1.11% | 1.25% |
| Securities | 42.1 | 35.1 | 7.0 |
| Deposits (-) | 28.0 | 16.5 | 11.4 |
| Ave. balance (deposits) | 14,369.8 | 8,134.8 | 6,234.9 |
| G&A expenses (-) Total | 83.1 | 44.2 | 38.8 |
| Personal | 38.9 | 21.1 | 17.7 |
| Non-Personal | 37.3 | 19.4 | 17.8 |
| Taxes | 6.8 | 3.7 | 3.1 |
| Net credit costs | (6.2) | (3.1) | (3.1) |
Capital Adequacy and Non-Performing Loans
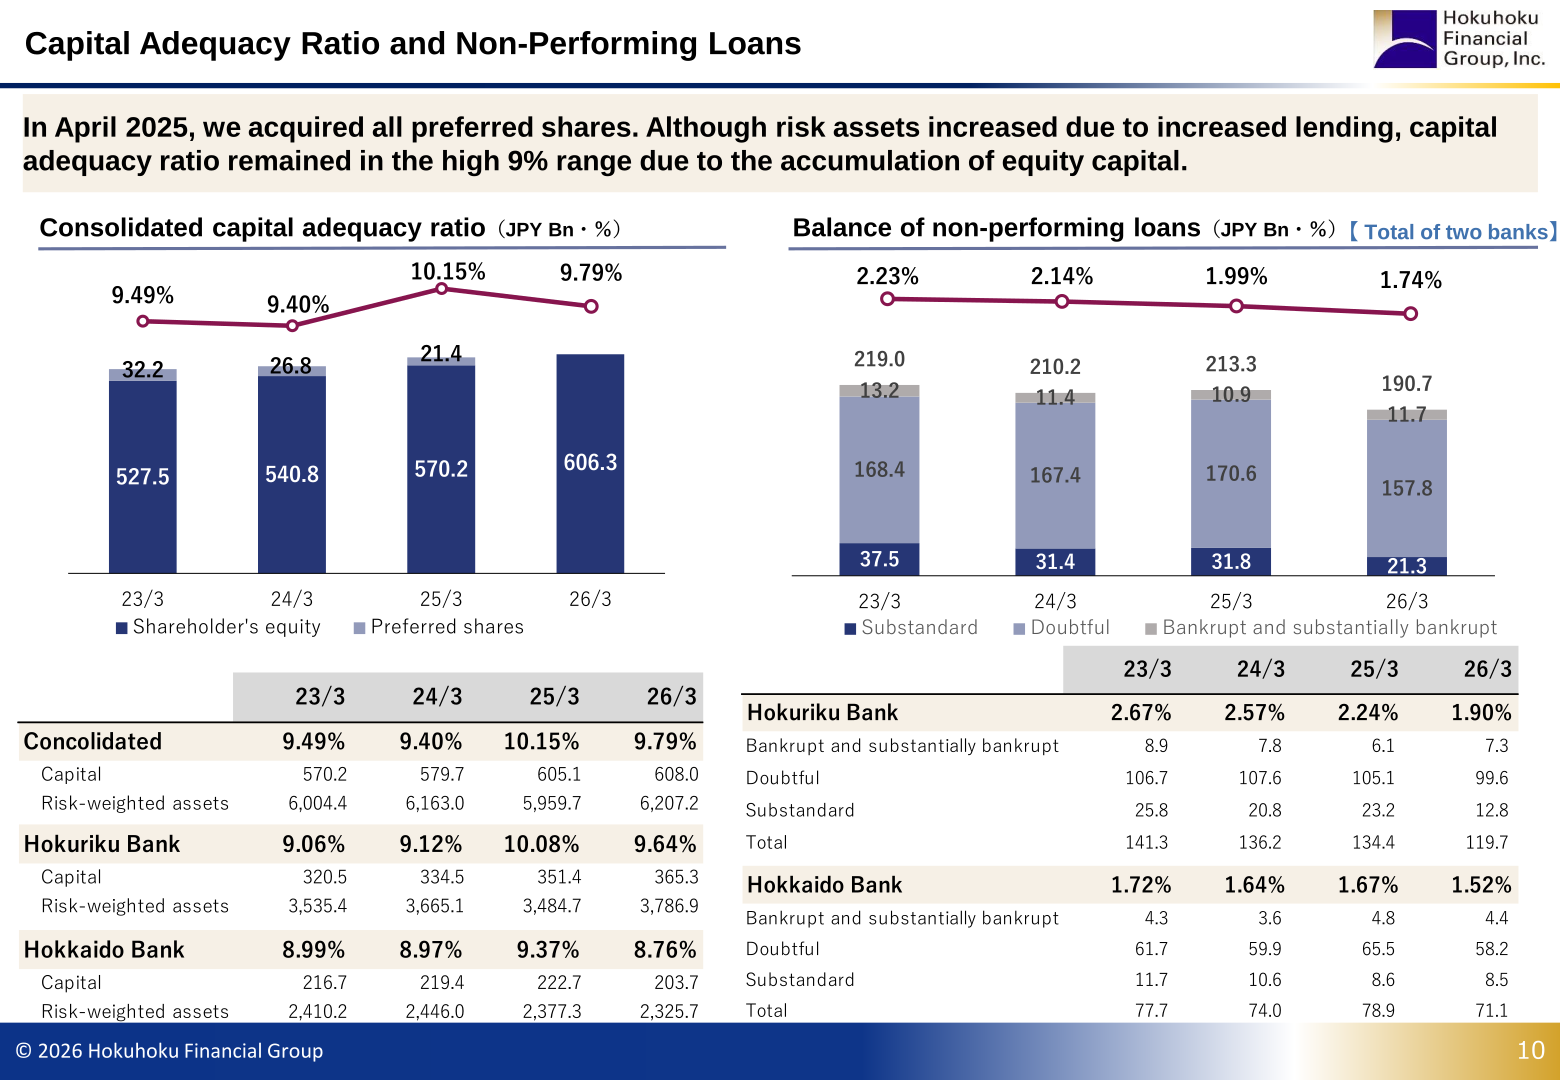
In April 2025 the company acquired all preferred shares. Although risk assets increased due to increased lending, the consolidated capital adequacy ratio remained in the high 9% range at 9.79% as of March 31, 2026 (10.15% a year earlier), supported by the accumulation of equity capital. Capital was ¥608.0 billion against risk-weighted assets of ¥6,207.2 billion. By bank, the ratio was 9.64% at Hokuriku Bank and 8.76% at Hokkaido Bank. The balance of non-performing loans for the two banks combined declined to ¥190.7 billion from ¥213.3 billion, and the non-performing loan ratio improved to 1.74% from 1.99% (Hokuriku Bank 1.90%, Hokkaido Bank 1.52%).
FY2026 Forecast
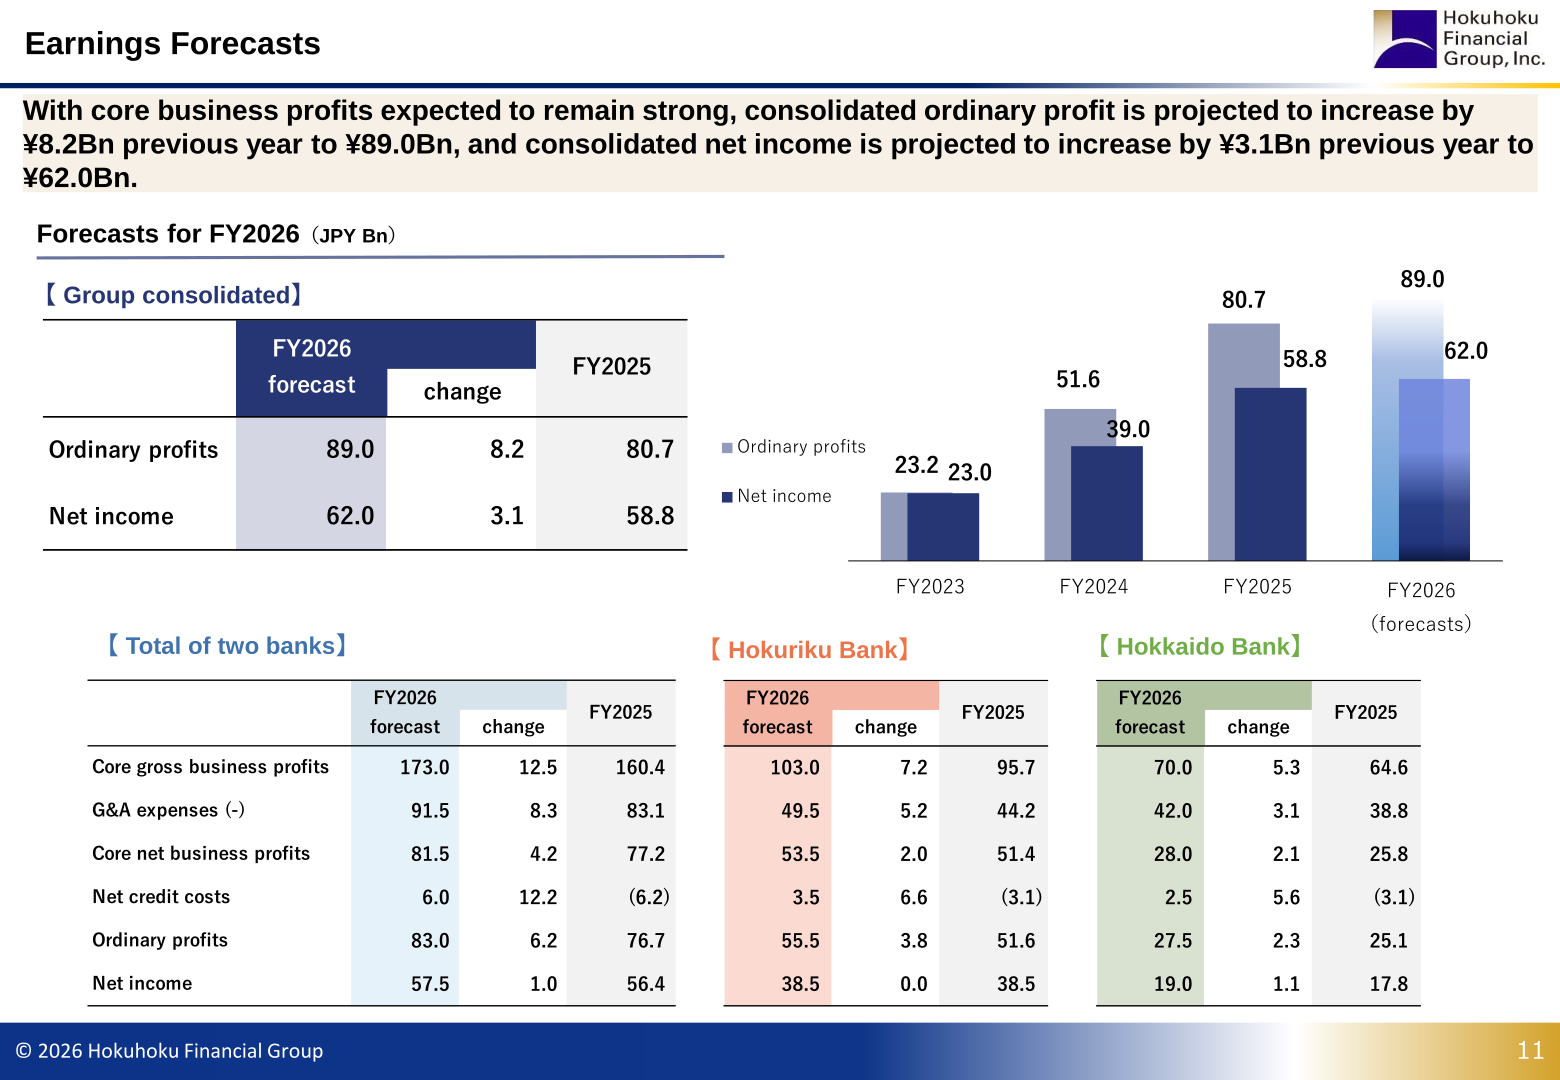
With core business profits expected to remain strong, consolidated ordinary profits are projected to increase by ¥8.2 billion to ¥89.0 billion and consolidated net income by ¥3.1 billion to ¥62.0 billion. For the two banks combined, core gross business profits are forecast at ¥173.0 billion and core net business profits at ¥81.5 billion, with net credit costs turning to a ¥6.0 billion charge.
| Forecasts for FY2026 (JPY Bn) | FY2026 forecast | change | FY2025 |
|---|---|---|---|
| 【Group consolidated】Ordinary profits | 89.0 | 8.2 | 80.7 |
| 【Group consolidated】Net income | 62.0 | 3.1 | 58.8 |
| 【Total of two banks】Core gross business profits | 173.0 | 12.5 | 160.4 |
| 【Total of two banks】G&A expenses (-) | 91.5 | 8.3 | 83.1 |
| 【Total of two banks】Core net business profits | 81.5 | 4.2 | 77.2 |
| 【Total of two banks】Net credit costs | 6.0 | 12.2 | (6.2) |
| 【Total of two banks】Ordinary profits | 83.0 | 6.2 | 76.7 |
| 【Total of two banks】Net income | 57.5 | 1.0 | 56.4 |
| 【Hokuriku Bank】Core net business profits | 53.5 | 2.0 | 51.4 |
| 【Hokuriku Bank】Ordinary profits | 55.5 | 3.8 | 51.6 |
| 【Hokuriku Bank】Net income | 38.5 | 0.0 | 38.5 |
| 【Hokkaido Bank】Core net business profits | 28.0 | 2.1 | 25.8 |
| 【Hokkaido Bank】Ordinary profits | 27.5 | 2.3 | 25.1 |
| 【Hokkaido Bank】Net income | 19.0 | 1.1 | 17.8 |
Shareholder Returns
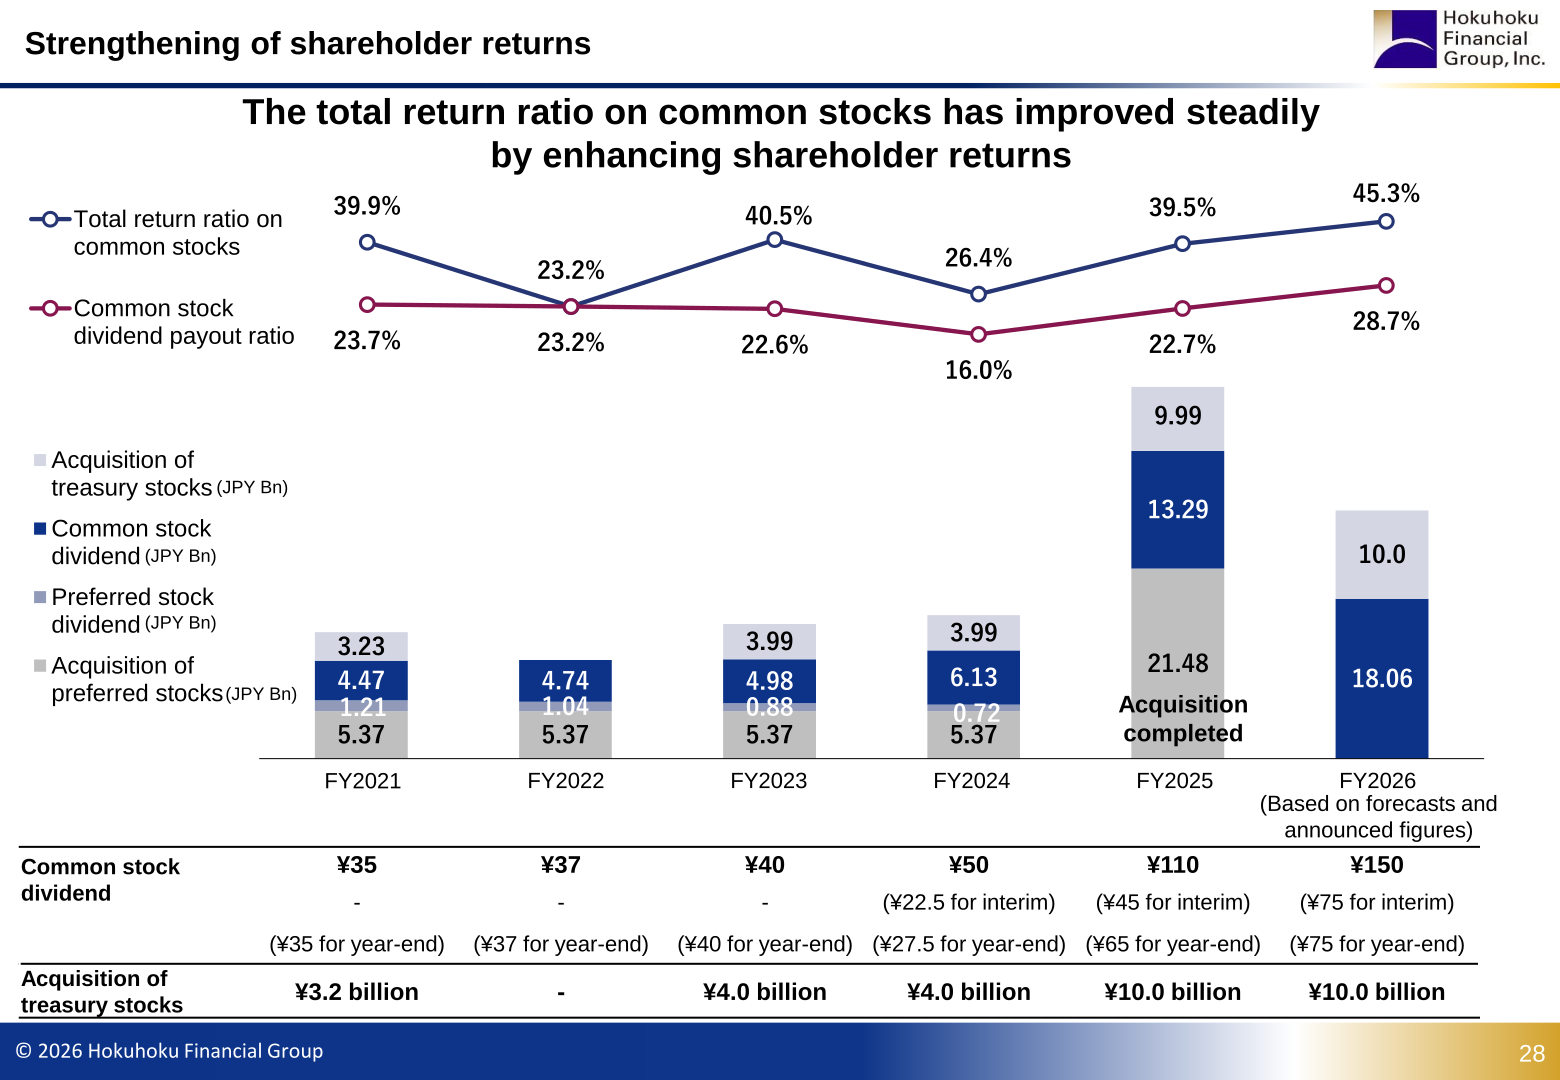
The common stock dividend for FY2025 was ¥110 per share (¥45 for interim, ¥65 for year-end), and the dividend for FY2026 is forecast at ¥150 per share (¥75 for interim, ¥75 for year-end), an increase of ¥40 year on year. An acquisition of treasury shares of ¥10.0 billion was conducted in FY2025 and ¥10.0 billion is planned for FY2026. The common stock dividend payout ratio was 22.7% in FY2025 and 28.7% in FY2026, while the total return ratio on common stocks was 39.5% and 45.3% respectively (FY2026 based on forecasts and announced figures). Acquisition of preferred stocks was completed in FY2025.
| Item | FY2024 | FY2025 | FY2026 |
|---|---|---|---|
| Common stock dividend (per share) | ¥50 | ¥110 | ¥150 |
| Interim | ¥22.5 | ¥45 | ¥75 |
| Year-end | ¥27.5 | ¥65 | ¥75 |
| Acquisition of treasury stocks | ¥4.0 billion | ¥10.0 billion | ¥10.0 billion |
| Common stock dividend payout ratio | 16.0% | 22.7% | 28.7% |
| Total return ratio on common stocks | 26.4% | 39.5% | 45.3% |
Revision of the Medium-Term Management Plan
Based on steady performance trends, the company revised upward the management indicator targets of the Sixth Medium-term Management Plan “NEXT STAGE” (April 2025 to March 2028). For the final year (FY2027), the ROE target was raised from the 8% level to 8.5%, net income from ¥55.0 billion to ¥65.0 billion, and OHR (the two banks combined) from the 50% level to the High-40% range; the capital adequacy ratio target was left at the 10% level. Long-term targets were also revised: ROE from 10% to 11%, net income from ¥80.0 billion to ¥90.0 billion, capital adequacy ratio from the 10–11% level to the 11% level, and OHR from approx. 50% to the Low-40% range. Policy rate assumptions are that the rate was raised to 0.75% in FY2025 and remains unchanged thereafter (FY2026: 0.75%, FY2027: 1.00%).
Against these targets, FY2025 results were consolidated ROE of 8.66% (up 2.61%), consolidated net income of ¥58.8 billion (up ¥19.8 billion), a consolidated capital adequacy ratio of 9.79% (down 0.36%) and OHR for the two banks combined of 51.82% (down 8.72%). ROE is compared in the materials with a current cost of equity (CAPM) of 8–9%, and PBR stood at 0.97 as of the end of March 2026.
This article is an analysis based on publicly available information and is not a recommendation to buy or sell any specific securities. Investment decisions are your own responsibility.
![[Obayashi] Investors’ Guide 2026 — The Complete 24-Article Breakdown](https://japan-equity.com/wp-content/uploads/2026/07/hub_cover-1024x1024.png)
![[Obayashi] IR & SR Policy — Feeding Dialogue Back into Management](https://japan-equity.com/wp-content/uploads/2026/07/p32_sq-1024x1024.jpg)
![[Obayashi] Domestic Civil Engineering — Resilience Spending Supports 9.6% Margin](https://japan-equity.com/wp-content/uploads/2026/07/p11_sq-1024x1024.jpg)
![[Obayashi] Overseas Construction — Orders Reach ¥1.2tn](https://japan-equity.com/wp-content/uploads/2026/07/p15_sq-1024x1024.jpg)
![[Obayashi] Share Price & External Ratings — vs TOPIX, ESG Index Inclusion](https://japan-equity.com/wp-content/uploads/2026/07/p40_sq-1024x1024.jpg)
![[Construction] ¥75.5tn Investment, Shrinking Workforce — Big-5 Market Share](https://japan-equity.com/wp-content/uploads/2026/07/p12_sq-1024x1024.jpg)



![[Obayashi] Capital Policy & Shareholder Returns — ROE 10%+, DOE ~5%, ¥100bn Buyback](https://japan-equity.com/wp-content/uploads/2026/07/p27_sq-1024x1024.jpg)
![[Obayashi] Reducing Cross-Shareholdings — ¥285.2bn Sold in Five Years](https://japan-equity.com/wp-content/uploads/2026/07/p29_sq-1024x1024.jpg)
![[Obayashi] ¥750bn Investment Plan — ¥300bn to Development, ¥190bn to Tech/DX](https://japan-equity.com/wp-content/uploads/2026/07/p30_sq-1024x1024.jpg)
![[Obayashi] MTP2022 KPIs — Operating Profit ~2x Target, ROE 14.4%](https://japan-equity.com/wp-content/uploads/2026/07/p25_sq-1024x1024.jpg)
![[Obayashi] Cash Allocation — ¥420bn Investment CF Over Five Years](https://japan-equity.com/wp-content/uploads/2026/07/p26_sq-1024x1024.jpg)
![[Obayashi] Green Energy — 44 Plants, 344MW, and the Green Hydrogen Challenge](https://japan-equity.com/wp-content/uploads/2026/07/p21_sq-1024x1024.jpg)
![[Obayashi] Tackling the Labor Shortage — Robotics Construction®](https://japan-equity.com/wp-content/uploads/2026/07/p14_sq-1024x1024.jpg)
