
This article is based on publicly available IR materials and is not a recommendation to buy or sell any specific securities.
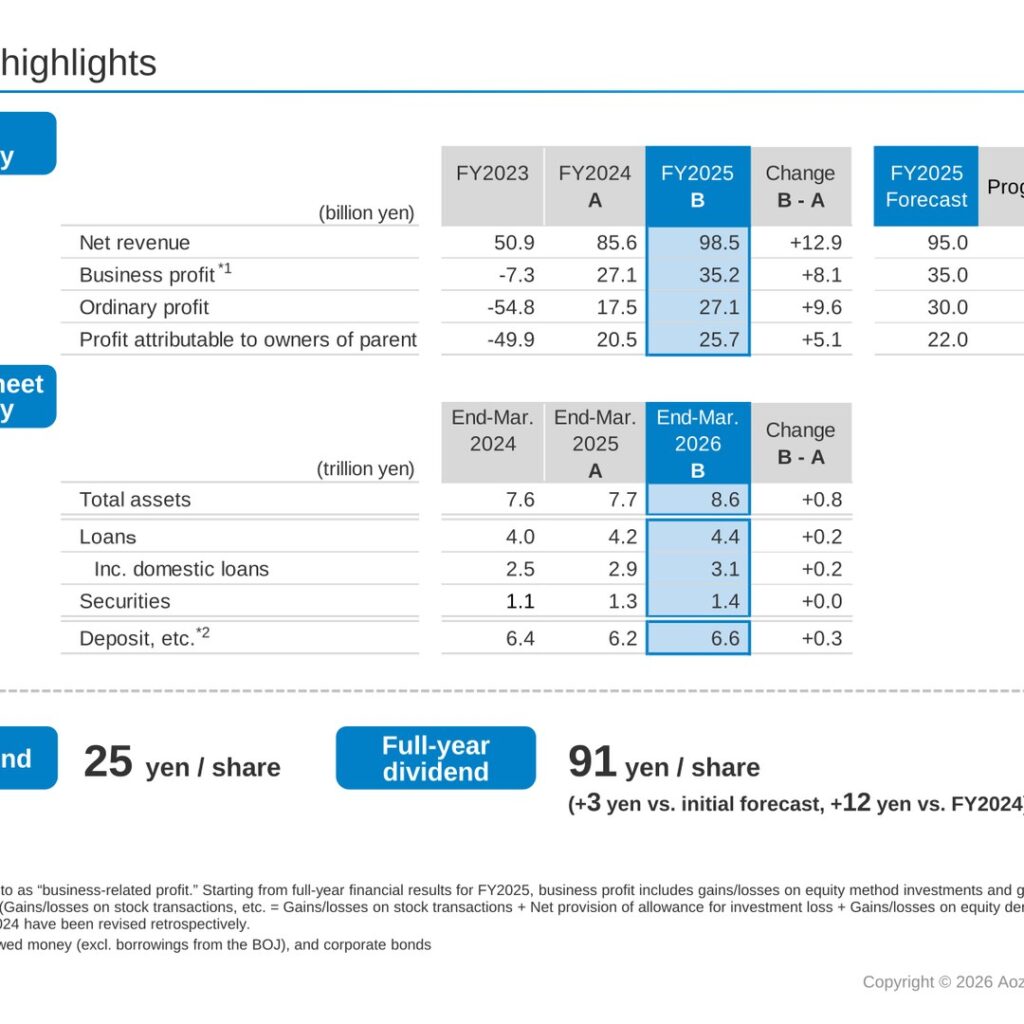
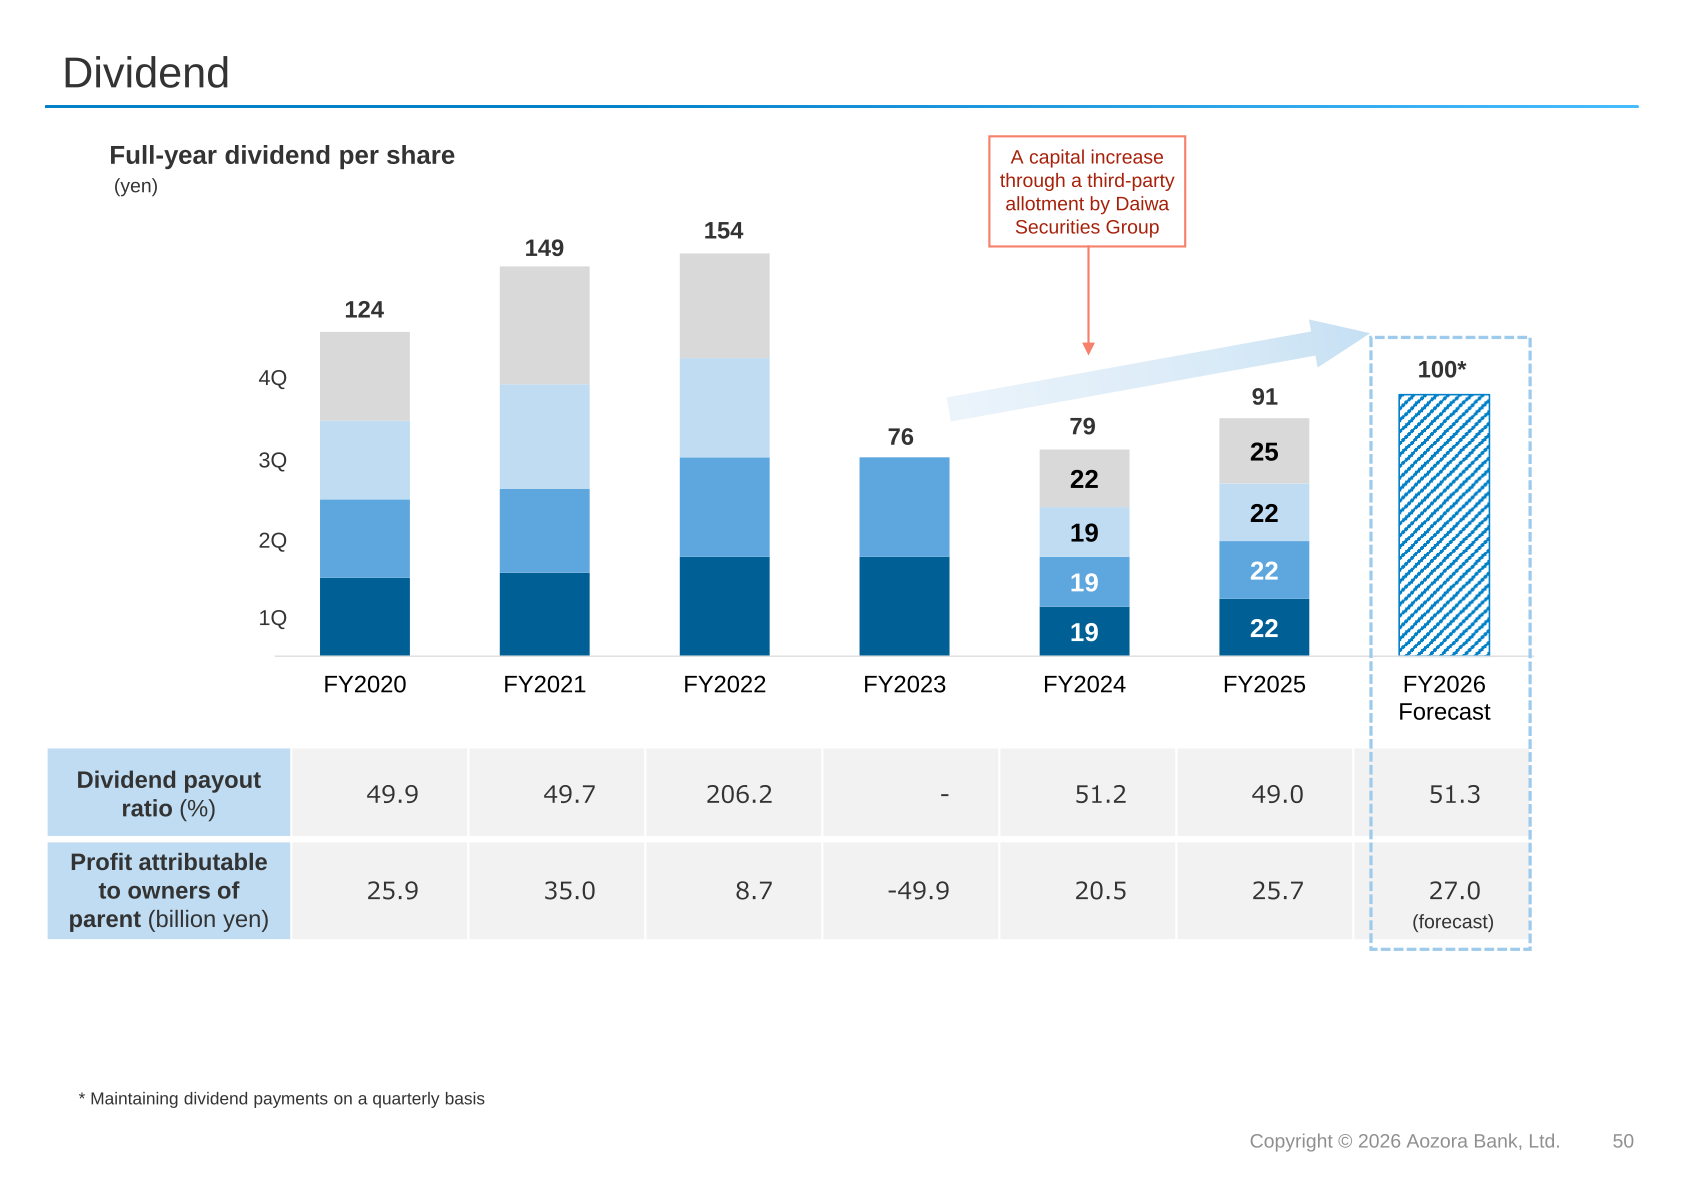
Aozora Bank posted FY2025 net revenue of 98.5 billion yen, up 12.9 billion yen year-on-year, and profit attributable to owners of parent of 25.7 billion yen, up 5.1 billion yen. The Bank describes the result as +17% vs. forecast and +25% year-on-year, with progress against the 22.0 billion yen full-year forecast at 117%. Business profit rose 8.1 billion yen to 35.2 billion yen, an increase the Bank describes as 30% compared with the previous year, and ROE improved to 5.5% from 4.9%. The full-year dividend per common share was 91 yen, 3 yen above the initial forecast and 12 yen above FY2024.
Consolidated Results (Full-Year Actual)
Net revenue exceeded the full-year forecast, driven by domestic net interest income and non-interest income, while the Bank improved the soundness of its securities portfolio. Net interest income rose 3.6 billion yen to 52.3 billion yen, with domestic net interest income up 10.3 billion yen to 35.5 billion yen and overseas net interest income down 6.6 billion yen to 16.7 billion yen. Non-interest income increased 9.3 billion yen to 46.2 billion yen, led by net fees and commissions of 31.8 billion yen (+7.1 billion yen), which included loan-related fee income of 12.5 billion yen (+3.3 billion yen) and GMO Aozora Net Bank fee income of 9.6 billion yen (+2.9 billion yen). General & administrative expenses were -66.9 billion yen, which the Bank states were managed almost in line with the 66 billion yen budget for FY2025, while credit-related expenses improved by 0.9 billion yen to -8.4 billion yen.
| Item (billion yen) | FY2024 (A) | FY2025 (B) | Change B – A | FY2025 Forecast | Progress |
|---|---|---|---|---|---|
| Net revenue | 85.6 | 98.5 | +12.9 | 95.0 | 104% |
| Net interest income | 48.7 | 52.3 | +3.6 | – | – |
| Non-interest income | 36.9 | 46.2 | +9.3 | – | – |
| General & administrative expenses | -62.8 | -66.9 | -4.0 | – | – |
| Gains/losses on equity method investments | 2.2 | 2.9 | +0.6 | – | – |
| Gains/losses on stock transactions, etc. | 2.1 | 0.6 | -1.4 | – | – |
| Business profit | 27.1 | 35.2 | +8.1 | 35.0 | 101% |
| Credit-related expenses | -9.4 | -8.4 | +0.9 | – | – |
| Ordinary profit | 17.5 | 27.1 | +9.6 | 30.0 | 91% |
| Extraordinary profit/loss | 1.8 | -0.0 | -1.8 | – | – |
| Profit before income taxes | 19.3 | 27.1 | +7.7 | – | – |
| Profit attributable to owners of parent | 20.5 | 25.7 | +5.1 | 22.0 | 117% |
| ROE | 4.9% | 5.5% | – | – | – |
Segment Results
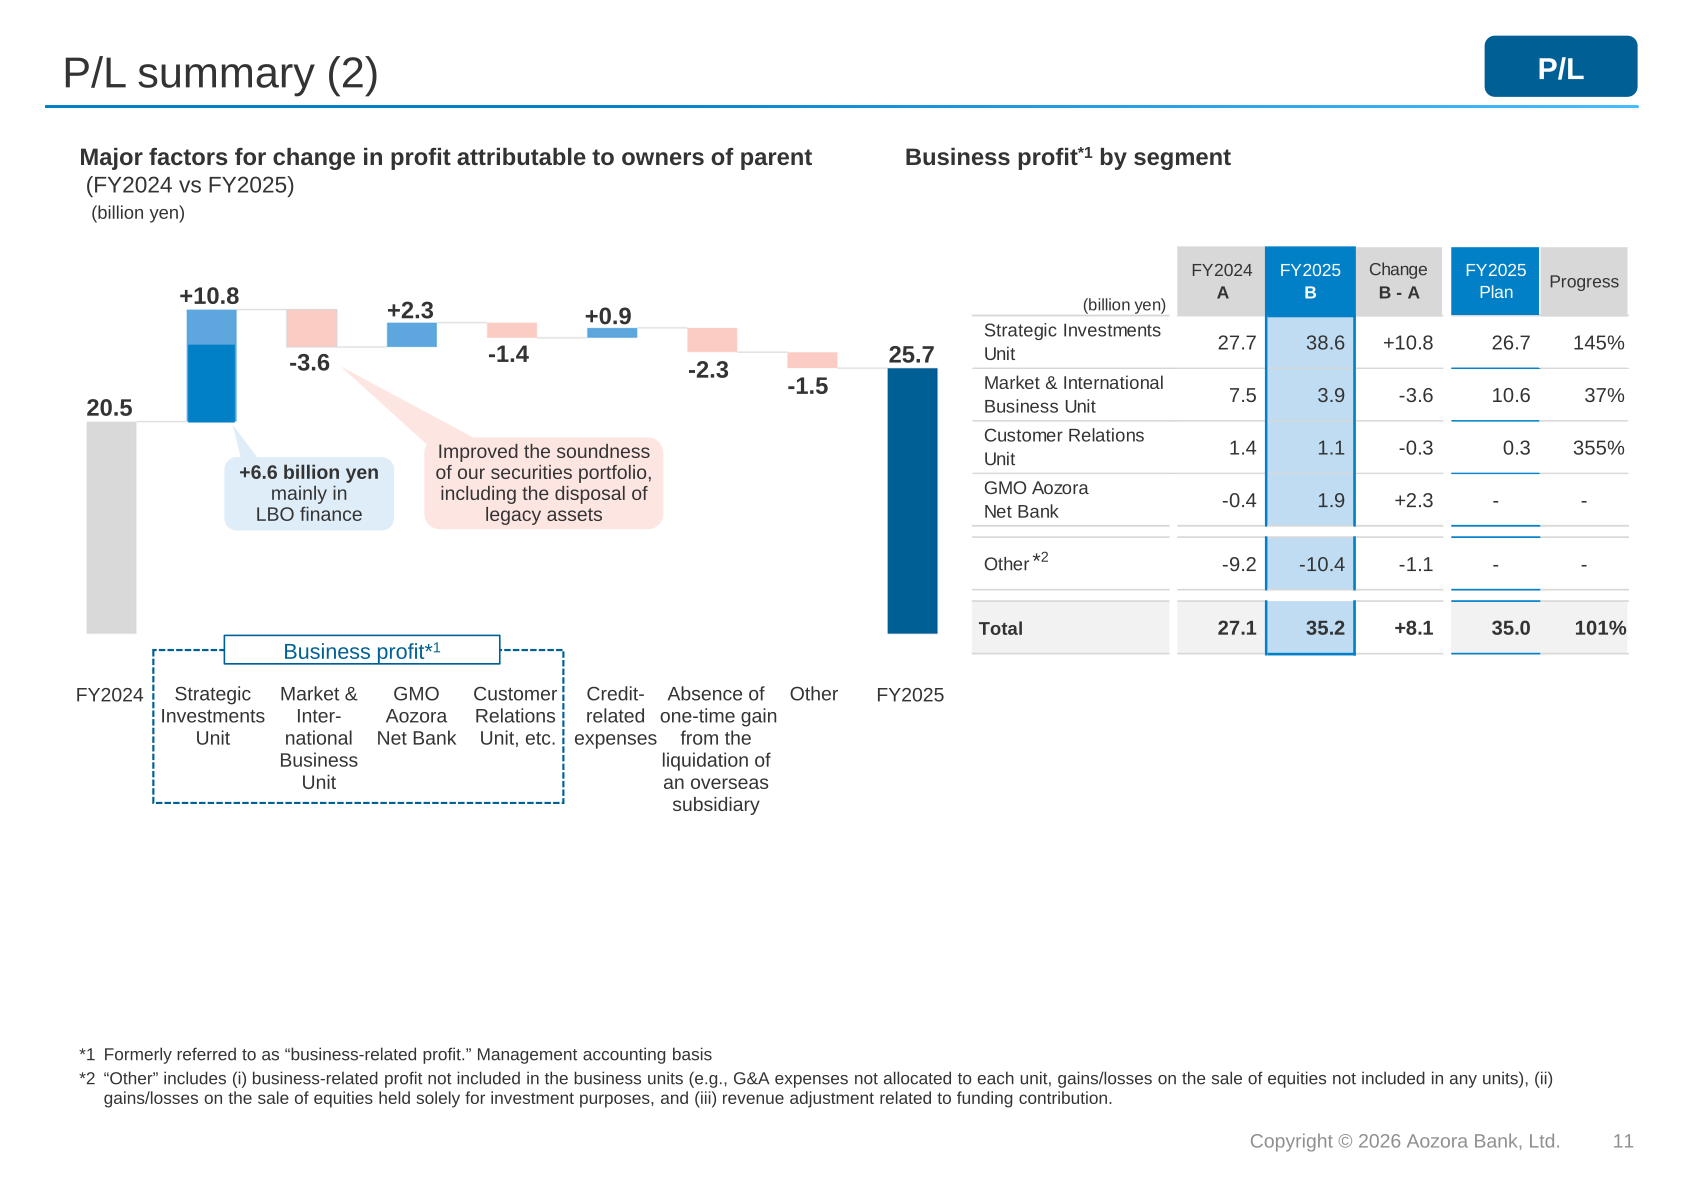
On a management accounting basis, the Strategic Investments Unit lifted business profit by 10.8 billion yen to 38.6 billion yen, 145% of its 26.7 billion yen FY2025 plan, with net revenue by business of 61.1 billion yen (+10.8 billion yen year-on-year). The Market & International Business Unit declined 3.6 billion yen to 3.9 billion yen, or 37% of plan, while the Customer Relations Unit was 1.1 billion yen. GMO Aozora Net Bank turned to a business profit of 1.9 billion yen from -0.4 billion yen, and reported net income of 1.7 billion yen with corporate accounts exceeding 240,000 and deposits exceeding 1.3 trillion yen. Partnership effects from the alliance with the Daiwa Securities Group exceeded plan at 3.5 billion yen on a business profit basis.
| Segment (billion yen) | FY2024 (A) | FY2025 (B) | Change B – A | FY2025 Plan | Progress |
|---|---|---|---|---|---|
| Strategic Investments Unit | 27.7 | 38.6 | +10.8 | 26.7 | 145% |
| Market & International Business Unit | 7.5 | 3.9 | -3.6 | 10.6 | 37% |
| Customer Relations Unit | 1.4 | 1.1 | -0.3 | 0.3 | 355% |
| GMO Aozora Net Bank | -0.4 | 1.9 | +2.3 | – | – |
| Other | -9.2 | -10.4 | -1.1 | – | – |
| Total | 27.1 | 35.2 | +8.1 | 35.0 | 101% |
Balance Sheet, Asset Quality and Capital
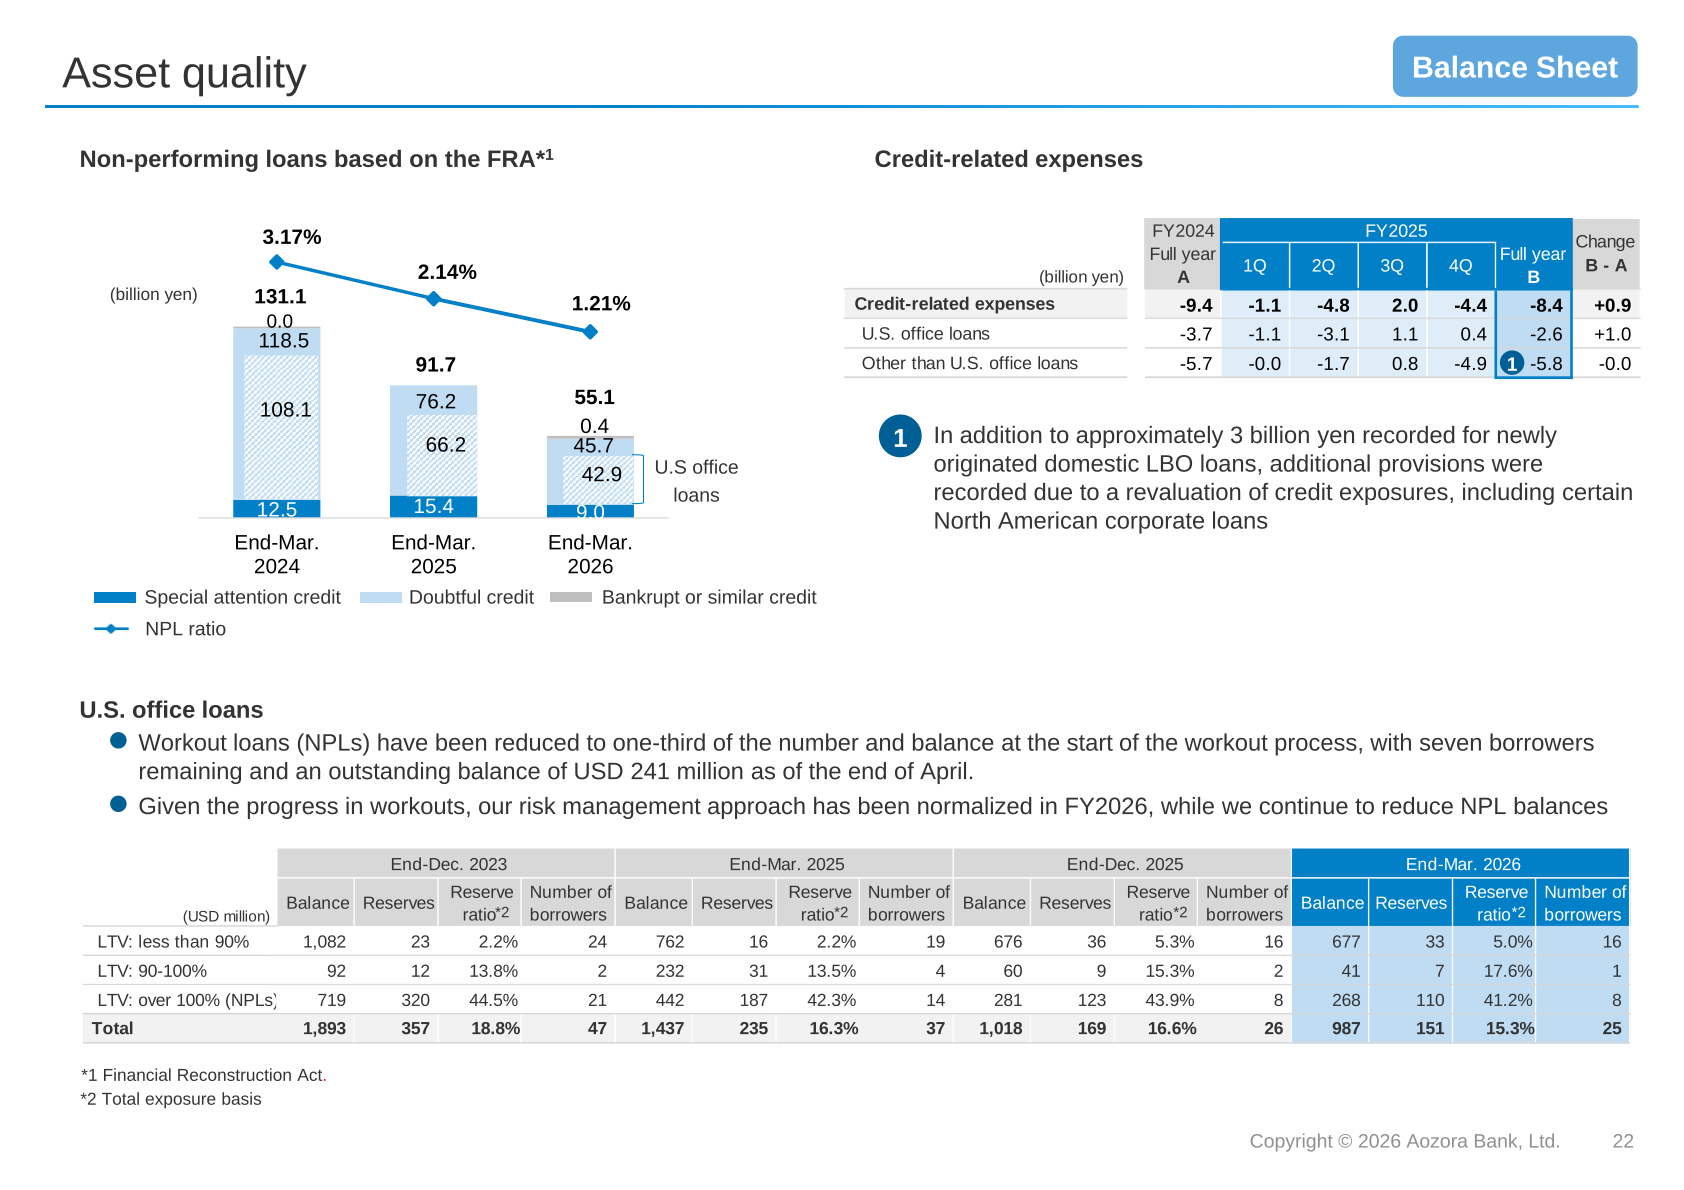
Total assets grew to 8.6 trillion yen and loans to 4.4 trillion yen, with domestic loans at 3.1 trillion yen. Domestic loan outstandings increased by 260 billion yen, or 9%, compared with March 31, 2025, while overseas loan outstandings decreased by 450 million U.S. dollars, or 5%. Non-performing loans based on the Financial Reconstruction Act fell to 55.1 billion yen and the NPL ratio to 1.21%, from 91.7 billion yen and 2.14% a year earlier. For U.S. office loans, the balance of loans with LTV over 100% (NPLs) was 268 million U.S. dollars with reserves of 110 million U.S. dollars, a reserve ratio of 41.2% and eight borrowers as of End-Mar. 2026; the Bank states that workout loans have been reduced to one-third of the number and balance at the start of the workout process, with seven borrowers remaining and an outstanding balance of USD 241 million as of the end of April, and that its risk management approach has been normalized in FY2026. The capital adequacy ratio (domestic standard, preliminary basis) was 10.87% and the CET1 ratio 9.6%, after the Bank changed its credit risk measurement approach from the Standardized Approach (SA) to the Foundational Internal Ratings-Based Approach (FIRB) effective as of March 31, 2026.
| Item | End-Mar. 2025 | End-Mar. 2026 | Change |
|---|---|---|---|
| Total assets (trillion yen) | 7.7 | 8.6 | +0.8 |
| Loans (trillion yen) | 4.2 | 4.4 | +0.2 |
| Inc. domestic loans (trillion yen) | 2.9 | 3.1 | +0.2 |
| Securities (trillion yen) | 1.3 | 1.4 | +0.0 |
| Deposit, etc. (trillion yen) | 6.2 | 6.6 | +0.3 |
| Non-performing loans based on the FRA (billion yen) | 91.7 | 55.1 | – |
| NPL ratio | 2.14% | 1.21% | – |
| Capital adequacy ratio (domestic standard) | 10.72% | 10.87% | +0.15% |
| Regulatory capital (billion yen) | 488.2 | 484.0 | -4.2 |
| Risk-weighted assets (billion yen) | 4,553.8 | 4,450.9 | -102.9 |
| CET1 ratio | 8.7% | 9.6% | – |
FY2026 Forecast
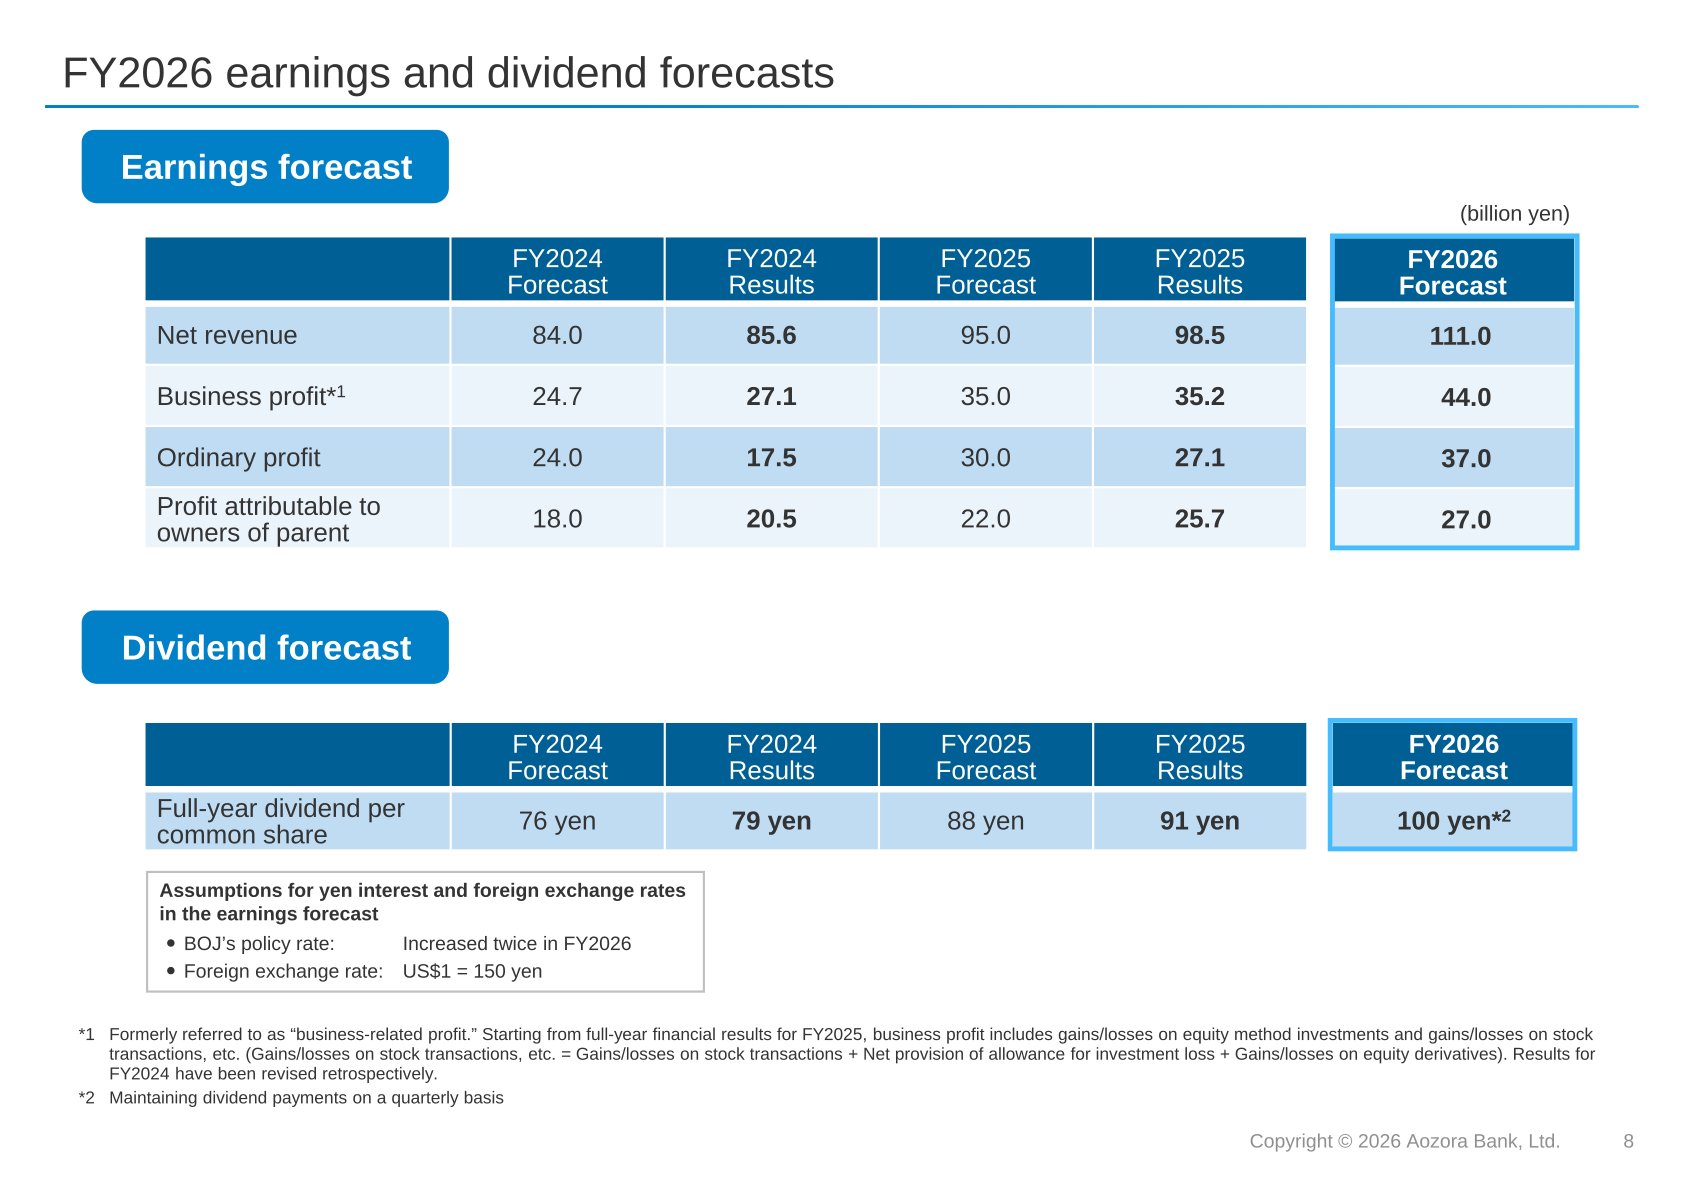
For FY2026 the Bank forecasts net revenue of 111.0 billion yen, business profit of 44.0 billion yen, ordinary profit of 37.0 billion yen and profit attributable to owners of parent of 27.0 billion yen. The earnings forecast assumes that the BOJ’s policy rate is increased twice in FY2026 and a foreign exchange rate of US$1 = 150 yen. The forecast dividend per common share is 100 yen, with dividend payments maintained on a quarterly basis.
| Item (billion yen) | FY2025 Results | FY2026 Forecast |
|---|---|---|
| Net revenue | 98.5 | 111.0 |
| Business profit | 35.2 | 44.0 |
| Ordinary profit | 27.1 | 37.0 |
| Profit attributable to owners of parent | 25.7 | 27.0 |
| Full-year dividend per common share | 91 yen | 100 yen |
Shareholder Returns
Aozora’s capital policy calls for shareholder returns through dividends based on business performance, with a target dividend payout ratio of approximately 50%. The FY2025 full-year dividend was 91 yen per share (1Q 22 yen, 2Q 22 yen, 3Q 22 yen, 4Q 25 yen) against a dividend payout ratio of 49.0%, compared with 79 yen and 51.2% in FY2024. The FY2026 forecast dividend of 100 yen is shown with a dividend payout ratio of 51.3%.
Mid-term Plan “Aozora 2027”
FY2025 was the first year of the mid-term plan “Aozora 2027,” under which the Bank aims to return to a growth trajectory for the three-year period from 2025 to 2027 through three growth drivers: growth of the Strategic Investments Business mainly in the Japan domestic market, realization of synergies through the alliance with Daiwa Securities Group, and growth of GMO Aozora Net Bank. Against FY2025 results of 25.7 billion yen profit attributable to owners of parent, ROE of 5.5%, a CET1 ratio of 9.6% and earning assets of 4.7 trillion yen, the FY2027 plan calls for 33.0 billion yen, approximately 7%, 10–11% and 5.5 trillion yen respectively, with FY2029 targets of 50.0 billion yen and ROE of 8% or higher. The impact of the alliance with Daiwa was 3.5 billion yen on a business profit basis in FY2025 against a plan of 3.3 billion yen, with 6.5 billion yen planned for FY2026 and 10.0 billion yen for FY2027. The Bank targets ROE above its cost of capital and a P/B ratio over 1x, and manages its operations with a focus on the CET1 ratio under the international standards.
This article is an analysis based on publicly available information and is not a recommendation to buy or sell any specific securities. Investment decisions are your own responsibility.
![[Obayashi] Investors’ Guide 2026 — The Complete 24-Article Breakdown](https://japan-equity.com/wp-content/uploads/2026/07/hub_cover-1024x1024.png)
![[Obayashi] IR & SR Policy — Feeding Dialogue Back into Management](https://japan-equity.com/wp-content/uploads/2026/07/p32_sq-1024x1024.jpg)
![[Obayashi] Real Estate Development — 18.7% Margin, ¥287.7bn Unrealized Gains](https://japan-equity.com/wp-content/uploads/2026/07/p20_sq-1024x1024.jpg)
![[Obayashi] Domestic Civil Engineering — Resilience Spending Supports 9.6% Margin](https://japan-equity.com/wp-content/uploads/2026/07/p11_sq-1024x1024.jpg)
![[Obayashi] Share Price & External Ratings — vs TOPIX, ESG Index Inclusion](https://japan-equity.com/wp-content/uploads/2026/07/p40_sq-1024x1024.jpg)
![[Construction] ¥75.5tn Investment, Shrinking Workforce — Big-5 Market Share](https://japan-equity.com/wp-content/uploads/2026/07/p12_sq-1024x1024.jpg)



![[Obayashi] Capital Policy & Shareholder Returns — ROE 10%+, DOE ~5%, ¥100bn Buyback](https://japan-equity.com/wp-content/uploads/2026/07/p27_sq-1024x1024.jpg)
![[Obayashi] Reducing Cross-Shareholdings — ¥285.2bn Sold in Five Years](https://japan-equity.com/wp-content/uploads/2026/07/p29_sq-1024x1024.jpg)
![[Obayashi] ¥750bn Investment Plan — ¥300bn to Development, ¥190bn to Tech/DX](https://japan-equity.com/wp-content/uploads/2026/07/p30_sq-1024x1024.jpg)
![[Obayashi] MTP2022 KPIs — Operating Profit ~2x Target, ROE 14.4%](https://japan-equity.com/wp-content/uploads/2026/07/p25_sq-1024x1024.jpg)
![[Obayashi] Cash Allocation — ¥420bn Investment CF Over Five Years](https://japan-equity.com/wp-content/uploads/2026/07/p26_sq-1024x1024.jpg)
![[Obayashi] Green Energy — 44 Plants, 344MW, and the Green Hydrogen Challenge](https://japan-equity.com/wp-content/uploads/2026/07/p21_sq-1024x1024.jpg)
![[Obayashi] Tackling the Labor Shortage — Robotics Construction®](https://japan-equity.com/wp-content/uploads/2026/07/p14_sq-1024x1024.jpg)
