
This article is based on publicly available IR materials and is not a recommendation to buy or sell any specific securities.
Note: MARUI GROUP labels the fiscal year ended March 31, 2026 as “FY2026” in its materials; this article classifies that year as FY2025 under our site-wide naming convention, and all body text, tables and segment labels below keep the company’s own year labels as presented.
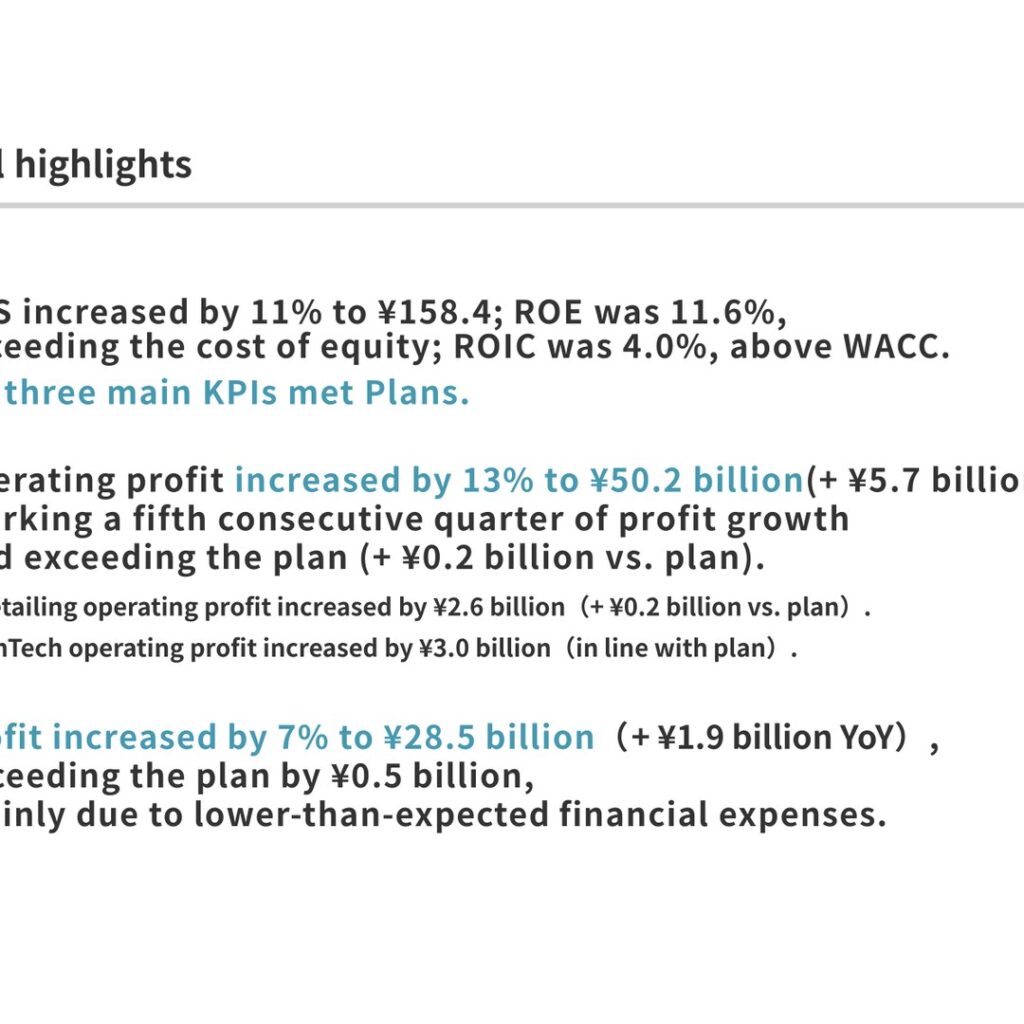
MARUI GROUP held its financial results briefing for the fiscal year ended March 31, 2026 on May 15, 2026. EPS increased by 11% to ¥158.4; ROE was 11.6%, exceeding the cost of equity; and ROIC was 4.0%, above WACC, with all three main KPIs meeting Plans. Operating profit increased by 13% to ¥50.2 billion (+¥5.7 billion YoY), marking a fifth consecutive quarter of profit growth and exceeding the plan (+¥0.2 billion vs. plan). Profit increased by 7% to ¥28.5 billion (+¥1.9 billion YoY), exceeding the plan by ¥0.5 billion, mainly due to lower-than-expected financial expenses.
Consolidated Results (Fiscal Year Ended March 31, 2026)
Total Group transactions reached a record high of ¥5.3921 trillion (YoY +¥0.4653), and operating profit rose to ¥50.2 billion (YoY +¥5.7) with profit at ¥28.5 billion (YoY +¥1.9). Of the ¥5.7 billion increase in operating profit, Retailing contributed +¥2.6 billion and FinTech +¥3.0 billion. Non-operating expenses rose by ¥3.0 billion to ¥8.6 billion, reflecting financial expenses of +¥3.1 billion (interest rate +2.8, balance +0.2). Extraordinary income of ¥9.4 billion included sale of real estate +¥1.0 billion and sale of stockholdings +¥0.2 billion, while extraordinary losses of ¥10.4 billion included a disposal loss of +¥1.2 billion.
| Item (Billion yen) | FY2025 | FY2026 | YoY change (%) | YoY difference (Billion yen) |
|---|---|---|---|---|
| Operating profit | 44.5 | 50.2 | 113 | +5.7 |
| Non-operating income | 0.9 | 1.0 | 108 | +0.1 |
| Non-operating expenses | 5.5 | 8.6 | 155 | +3.0 |
| Ordinary profit | 39.9 | 42.7 | 107 | +2.7 |
| Extraordinary income | 8.2 | 9.4 | 114 | +1.2 |
| Extraordinary losses | 8.8 | 10.4 | 119 | +1.6 |
| Profit before income taxes | 39.4 | 41.6 | 106 | +2.2 |
| Profit | 26.6 | 28.5 | 107 | +1.9 |
Segment Results
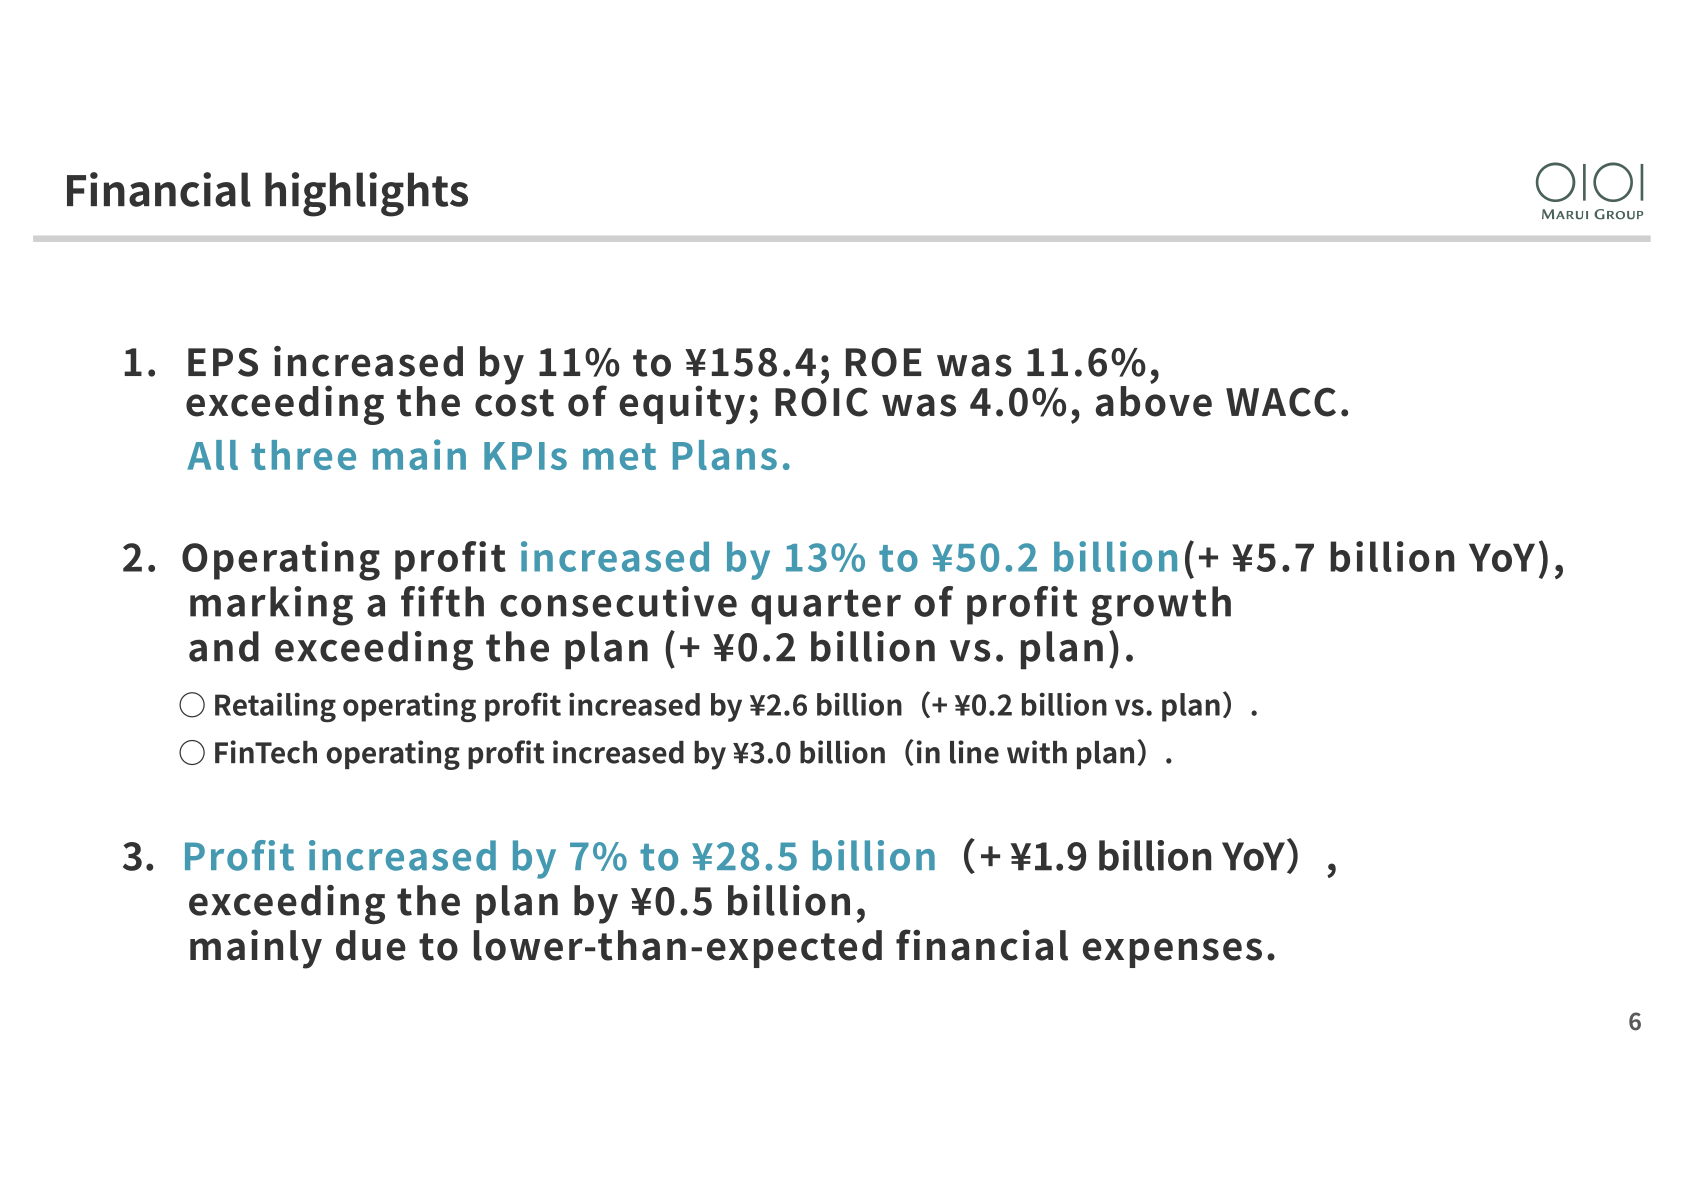
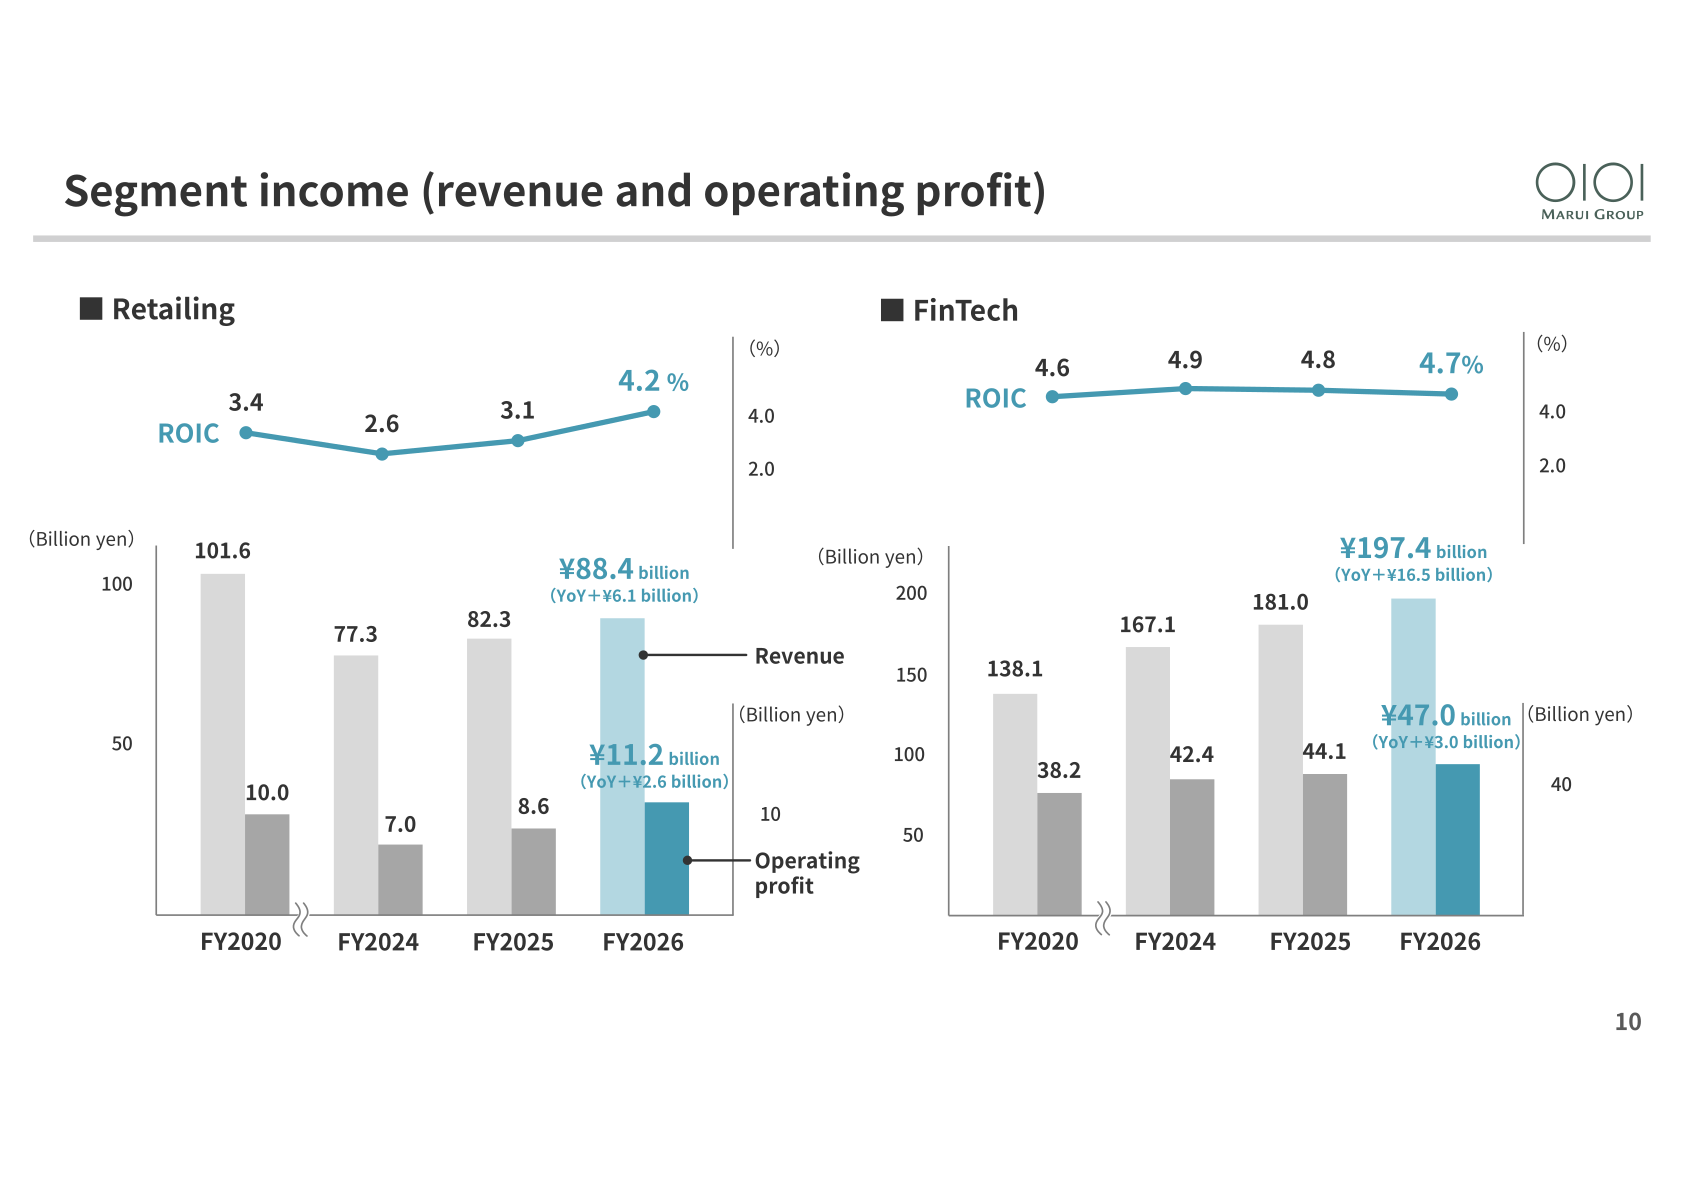
MARUI GROUP reports two business segments, Retailing and FinTech. Retailing revenue was ¥88.4 billion (YoY +¥6.1 billion) and operating profit was ¥11.2 billion (YoY +¥2.6 billion), with segment ROIC of 4.2%. FinTech revenue was ¥197.4 billion (YoY +¥16.5 billion) and operating profit was ¥47.0 billion (YoY +¥3.0 billion), with segment ROIC of 4.7%.
| Segment | Metric | FY2025 | FY2026 |
|---|---|---|---|
| Retailing | Revenue | ¥82.3 billion | ¥88.4 billion |
| Retailing | Operating profit | ¥8.6 billion | ¥11.2 billion |
| Retailing | ROIC | 3.1% | 4.2% |
| FinTech | Revenue | ¥181.0 billion | ¥197.4 billion |
| FinTech | Operating profit | ¥44.1 billion | ¥47.0 billion |
| FinTech | ROIC | 4.8% | 4.7% |
In Retailing, operating profit increased by ¥2.6 billion year on year mainly due to an increase in tenant rent and event revenue, with tenant +¥2.3 billion, event +¥0.8 billion, EC +¥0.2 billion and related business +¥0.2 billion, against expenses and others of -¥1.0 billion. Existing store transaction volume has exceeded prior-year levels for 44 consecutive months, at YoY 111%. Excluding the impact of store closures, tenant revenue increased by ¥2.3 billion, supported by an increase in fixed-term leased floor area and higher rent per tsubo: monthly rent per tsubo for fixed-term leases rose to ¥52,000 (+¥1,000) and vacant space declined to 4,700 tsubo (-1,800 tsubo). As of March 2026, non-retail tenant space has expanded to 70% (YoY +5%).
In FinTech, despite special factors including receivables securitization and interest repayments, profit increased by ¥3.0 billion, driven by growth in installment and revolving credit fee income. Credit card transaction volume for the fourth quarter totaled ¥1,262.8 billion (YoY +110%), and the second-half Merchant Discount Rate rose to 1.22%, supported by revisions to foreign currency transaction fee rates. Installment and revolving credit transaction volume reached ¥473.2 billion (YoY 110%), and installment and revolving credit fee income increased by ¥9.4 billion to ¥69.0 billion. New memberships reached a record high of 870,000 (YoY +40 thousand), and total cardholders reached a record high of 8.30 million, with EPOS cards that support “Suki” at 1.38 million and the share of EPOS cards that support “Suki” and platinum/gold cards expanding to 64% (+4%). Interest repayment amounts continue to decline but have remained slightly above prior forecasts, and an additional ¥1.5 billion provision was recorded.
Balance Sheet and Capital Allocation
Total assets increased by ¥87.9 billion compared to the end of the previous fiscal year to ¥1.1413 trillion, mainly due to an increase in operating receivables and other factors. Operating receivables were ¥713.7 billion (+¥83.9 billion), or ¥1,079.7 billion (+¥73.4 billion) including securitized receivables. Interest-bearing debt was ¥716.3 billion (+¥79.8 billion), shareholders’ equity was ¥244.2 billion (-¥2.0 billion) and the equity-to-asset ratio was 21.4% (-2.0%). Investment securities were ¥39.2 billion (-¥7.3 billion). Against core operating cash flow of ¥45.1 billion and loans payable of ¥2.0 billion, the Group allocated ¥18.0 billion to growth investments and ¥29.1 billion to shareholder returns; human capital investment totaled ¥9.7 billion, representing 27% of personnel costs.
Full-Year Forecast for the Fiscal Year Ending March 31, 2027
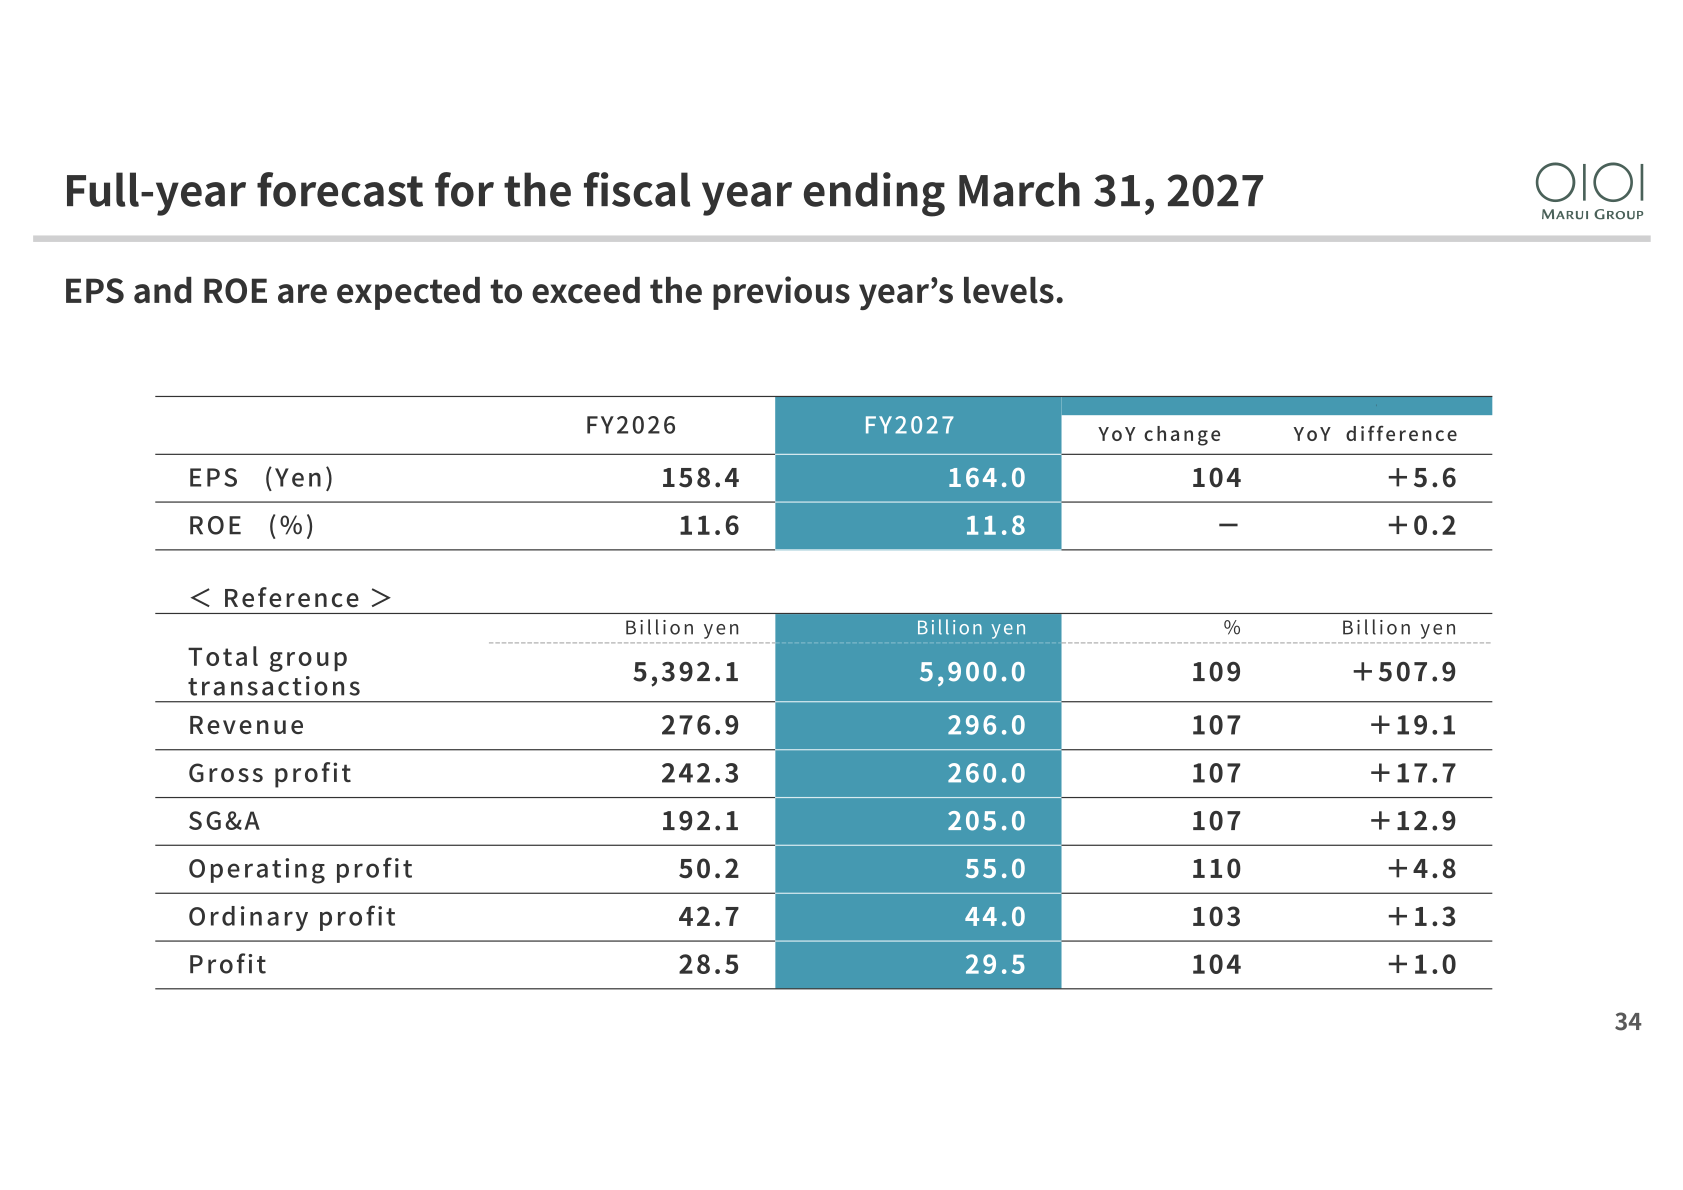
EPS and ROE are expected to exceed the previous year’s levels, with EPS forecast at ¥164.0 (+¥5.6) and ROE at 11.8% (+0.2). Operating profit is forecast to increase by 10% to ¥55.0 billion, while ordinary profit for the fiscal year ending March 31, 2027 is expected to increase by 3% to ¥44.0 billion, reflecting Retailing +¥0.3 billion, FinTech +¥4.0 billion, Eliminations/Corporate +¥0.5 billion and non-operating income/expenses of -¥3.4 billion.
| Item | FY2026 | FY2027 | YoY change (%) | YoY difference |
|---|---|---|---|---|
| EPS (Yen) | 158.4 | 164.0 | 104 | +5.6 |
| ROE (%) | 11.6 | 11.8 | - | +0.2 |
| Total group transactions (Billion yen) | 5,392.1 | 5,900.0 | 109 | +507.9 |
| Revenue (Billion yen) | 276.9 | 296.0 | 107 | +19.1 |
| Gross profit (Billion yen) | 242.3 | 260.0 | 107 | +17.7 |
| SG&A (Billion yen) | 192.1 | 205.0 | 107 | +12.9 |
| Operating profit (Billion yen) | 50.2 | 55.0 | 110 | +4.8 |
| Ordinary profit (Billion yen) | 42.7 | 44.0 | 103 | +1.3 |
| Profit (Billion yen) | 28.5 | 29.5 | 104 | +1.0 |
By segment, Retailing profit is expected to increase by 3% to ¥11.5 billion, while FinTech profit is expected to grow by 8% to ¥51.0 billion. In Retailing, although special factors are expected to negatively impact profit, higher tenant and event-related revenue is expected to drive a ¥0.3 billion increase. In FinTech, operating profit is projected to reach ¥51.0 billion, up ¥4.0 billion year on year, with income of +¥19.6 billion against expenses of -¥16.1 billion.
| Segment (Billion yen) | FY2026 | FY2027 | YoY change (%) | YoY difference |
|---|---|---|---|---|
| Retailing | 11.2 | 11.5 | 103 | +0.3 |
| FinTech | 47.0 | 51.0 | 108 | +4.0 |
| Eliminations/Corporate | -8.0 | -7.5 | - | +0.5 |
| Consolidated Operating Profit | 50.2 | 55.0 | 110 | +4.8 |
Shareholder Returns
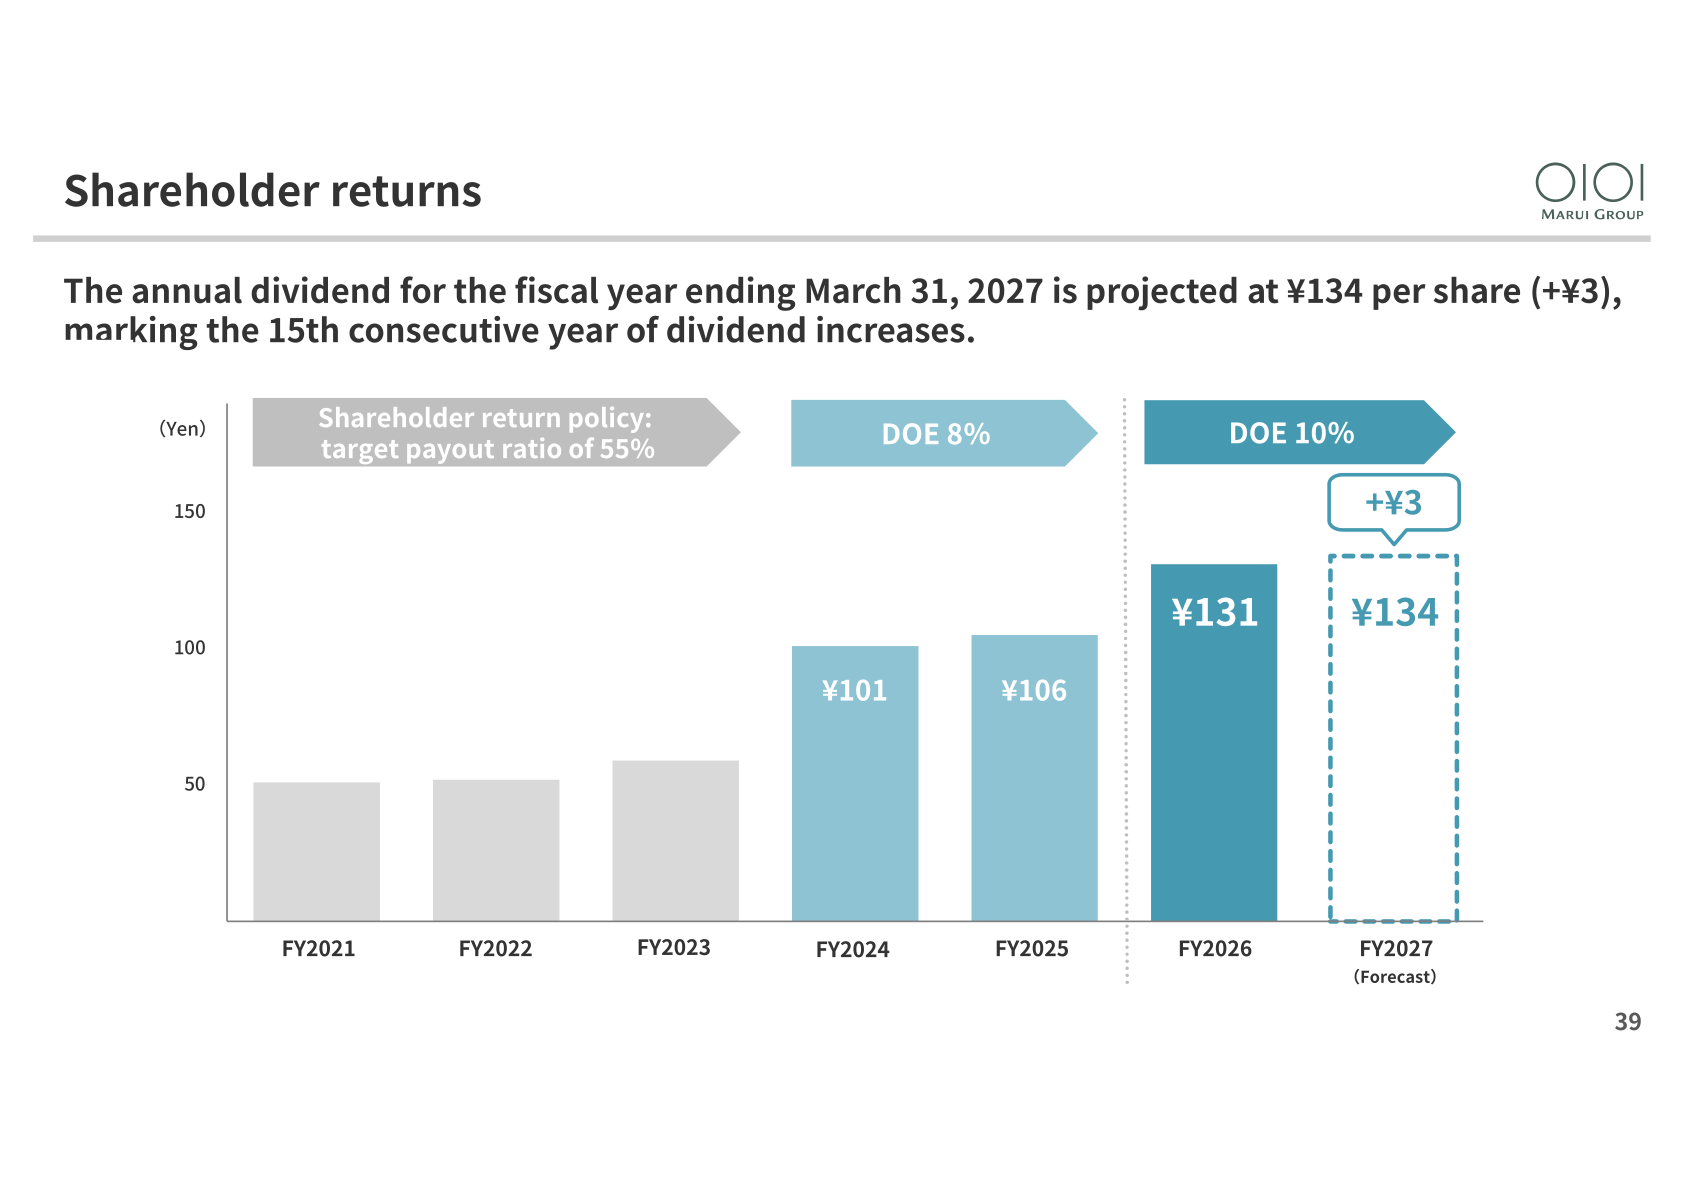
The annual dividend for the fiscal year ending March 31, 2027 is projected at ¥134 per share (+¥3), marking the 15th consecutive year of dividend increases, against ¥131 for the fiscal year ended March 31, 2026. The shareholder return policy shown in the materials moves from a target payout ratio of 55% through DOE 8% to DOE 10%. In the fiscal year ended March 31, 2026, shareholder returns of ¥29.1 billion comprised dividends of ¥21.4 billion and share buybacks of ¥7.7 billion.
Future Direction and Medium-Term KPIs
President and Representative Director Hiroshi Aoi presented the future direction of the business that supports “Suki,” with a Vision for 2031 of a “Suki” Economy and a strategy centered on the business that supports “Suki” across Retailing, FinTech and Co-Creative investment. KPIs toward the fiscal year ending March 2031 are for the percentage of those with primary card status to rise from 23% in FY2026 to 35% in FY2031, and for total group transactions to grow from ¥5 trillion in FY2026 to ¥10 trillion in FY2031. On ESG, progress toward 100% renewable energy remains on track at a 97% renewable energy ratio, and a higher share of self-generated power across 36 locations has mitigated the impact of rising electricity prices.
This article is an analysis based on publicly available information and is not a recommendation to buy or sell any specific securities. Investment decisions are your own responsibility.
![[Obayashi] Investors’ Guide 2026 — The Complete 24-Article Breakdown](https://japan-equity.com/wp-content/uploads/2026/07/hub_cover-1024x1024.png)
![[Obayashi] IR & SR Policy — Feeding Dialogue Back into Management](https://japan-equity.com/wp-content/uploads/2026/07/p32_sq-1024x1024.jpg)
![[Obayashi] Real Estate Development — 18.7% Margin, ¥287.7bn Unrealized Gains](https://japan-equity.com/wp-content/uploads/2026/07/p20_sq-1024x1024.jpg)
![[Obayashi] Domestic Civil Engineering — Resilience Spending Supports 9.6% Margin](https://japan-equity.com/wp-content/uploads/2026/07/p11_sq-1024x1024.jpg)
![[Obayashi] Share Price & External Ratings — vs TOPIX, ESG Index Inclusion](https://japan-equity.com/wp-content/uploads/2026/07/p40_sq-1024x1024.jpg)
![[Construction] ¥75.5tn Investment, Shrinking Workforce — Big-5 Market Share](https://japan-equity.com/wp-content/uploads/2026/07/p12_sq-1024x1024.jpg)



![[Obayashi] Capital Policy & Shareholder Returns — ROE 10%+, DOE ~5%, ¥100bn Buyback](https://japan-equity.com/wp-content/uploads/2026/07/p27_sq-1024x1024.jpg)
![[Obayashi] Reducing Cross-Shareholdings — ¥285.2bn Sold in Five Years](https://japan-equity.com/wp-content/uploads/2026/07/p29_sq-1024x1024.jpg)
![[Obayashi] ¥750bn Investment Plan — ¥300bn to Development, ¥190bn to Tech/DX](https://japan-equity.com/wp-content/uploads/2026/07/p30_sq-1024x1024.jpg)
![[Obayashi] MTP2022 KPIs — Operating Profit ~2x Target, ROE 14.4%](https://japan-equity.com/wp-content/uploads/2026/07/p25_sq-1024x1024.jpg)
![[Obayashi] Cash Allocation — ¥420bn Investment CF Over Five Years](https://japan-equity.com/wp-content/uploads/2026/07/p26_sq-1024x1024.jpg)
![[Obayashi] Green Energy — 44 Plants, 344MW, and the Green Hydrogen Challenge](https://japan-equity.com/wp-content/uploads/2026/07/p21_sq-1024x1024.jpg)
![[Obayashi] Tackling the Labor Shortage — Robotics Construction®](https://japan-equity.com/wp-content/uploads/2026/07/p14_sq-1024x1024.jpg)
