
This article is based on publicly available IR materials and is not a recommendation to buy or sell any specific securities.
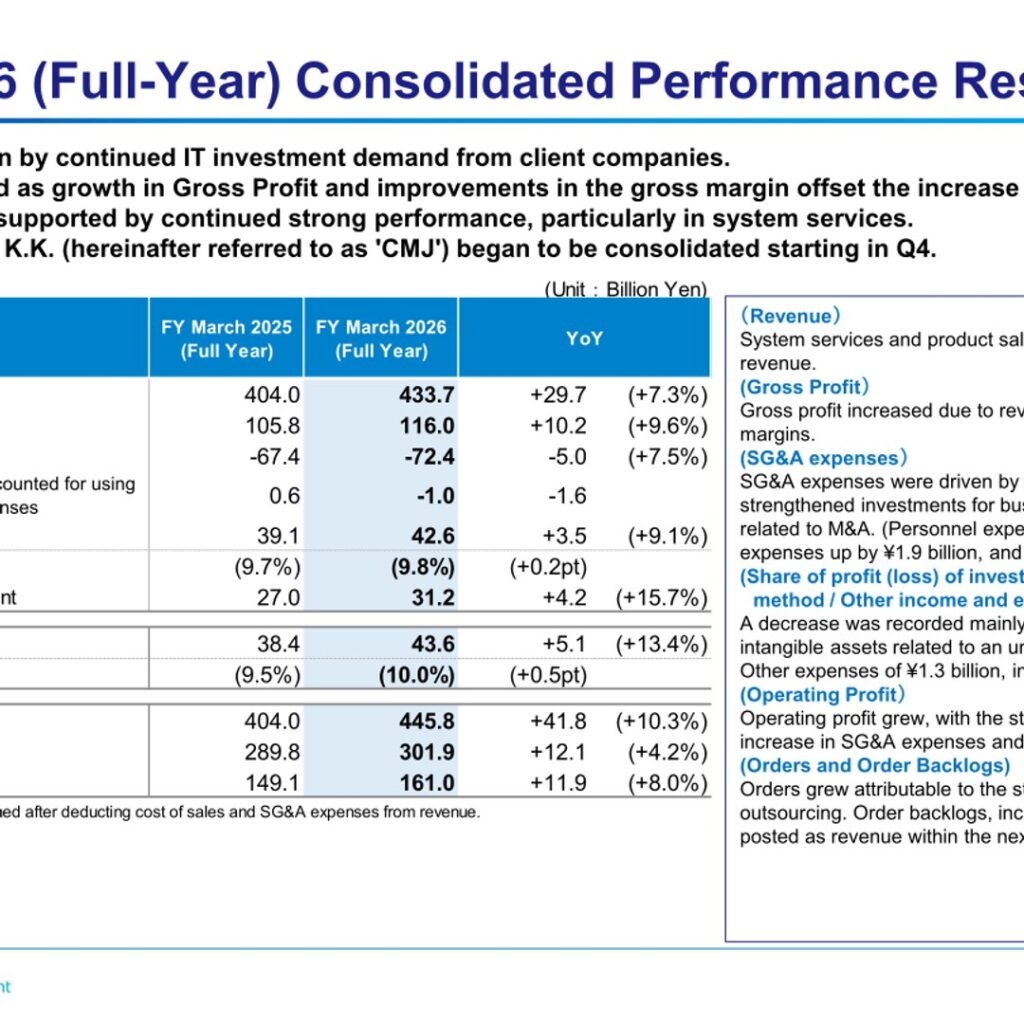
Note: BIPROGY labels this fiscal year “FY March 2026” (the year ended March 31, 2026); on this site it is classified as FY2025, and the labels used in the text and tables below follow the company’s materials. BIPROGY Inc. reported revenue of ¥433.7 billion for the fiscal year ended March 2026, up ¥29.7 billion (+7.3%) year on year, and operating profit of ¥42.6 billion, up ¥3.5 billion (+9.1%). Profit attributable to owners of parent rose ¥4.2 billion (+15.7%) to ¥31.2 billion. Orders increased ¥41.8 billion (+10.3%) to ¥445.8 billion, and Catalina Marketing Japan K.K. (CMJ) began to be consolidated starting in Q4.
Consolidated Results (Full-Year Actual)
The company states that revenue increased, driven by continued IT investment demand from client companies, with system services and product sales taking the lead. Gross profit increased due to revenue growth and improved profit margins. SG&A expenses were driven by an increase in personnel expenses, strengthened investments for business expansion, and expenses related to M&A (personnel expenses up by ¥2.7 billion, general expenses up by ¥1.9 billion, and R&D expenses up by ¥0.7 billion). Share of profit (loss) of investments accounted for using equity method / other income and expenses decreased mainly by posting an impairment loss on intangible assets related to an unprofitable project, recorded as other expenses of ¥1.3 billion in Q3. Operating profit grew, with the strong gross profit absorbing the increase in SG&A expenses and other expenses.
| Item (Unit: Billion Yen) | FY March 2025 (Full Year) | FY March 2026 (Full Year) | YoY |
|---|---|---|---|
| Revenue | 404.0 | 433.7 | +29.7 (+7.3%) |
| Gross profit | 105.8 | 116.0 | +10.2 (+9.6%) |
| SG&A expenses | -67.4 | -72.4 | -5.0 (+7.5%) |
| Share of profit (loss) of investments accounted for using equity method / Other income and expenses | 0.6 | -1.0 | -1.6 |
| Operating profit | 39.1 | 42.6 | +3.5 (+9.1%) |
| (Operating margin) | (9.7%) | (9.8%) | (+0.2pt) |
| Profit attributable to owners of parent | 27.0 | 31.2 | +4.2 (+15.7%) |
| Adjusted operating profit* | 38.4 | 43.6 | +5.1 (+13.4%) |
| (Adjusted operating margin) | (9.5%) | (10.0%) | (+0.5pt) |
| Orders | 404.0 | 445.8 | +41.8 (+10.3%) |
| Order backlogs | 289.8 | 301.9 | +12.1 (+4.2%) |
| (Order backlogs in the next FY) | 149.1 | 161.0 | +11.9 (+8.0%) |
*Adjusted operating profit is the result obtained after deducting cost of sales and SG&A expenses from revenue.
Segment Results
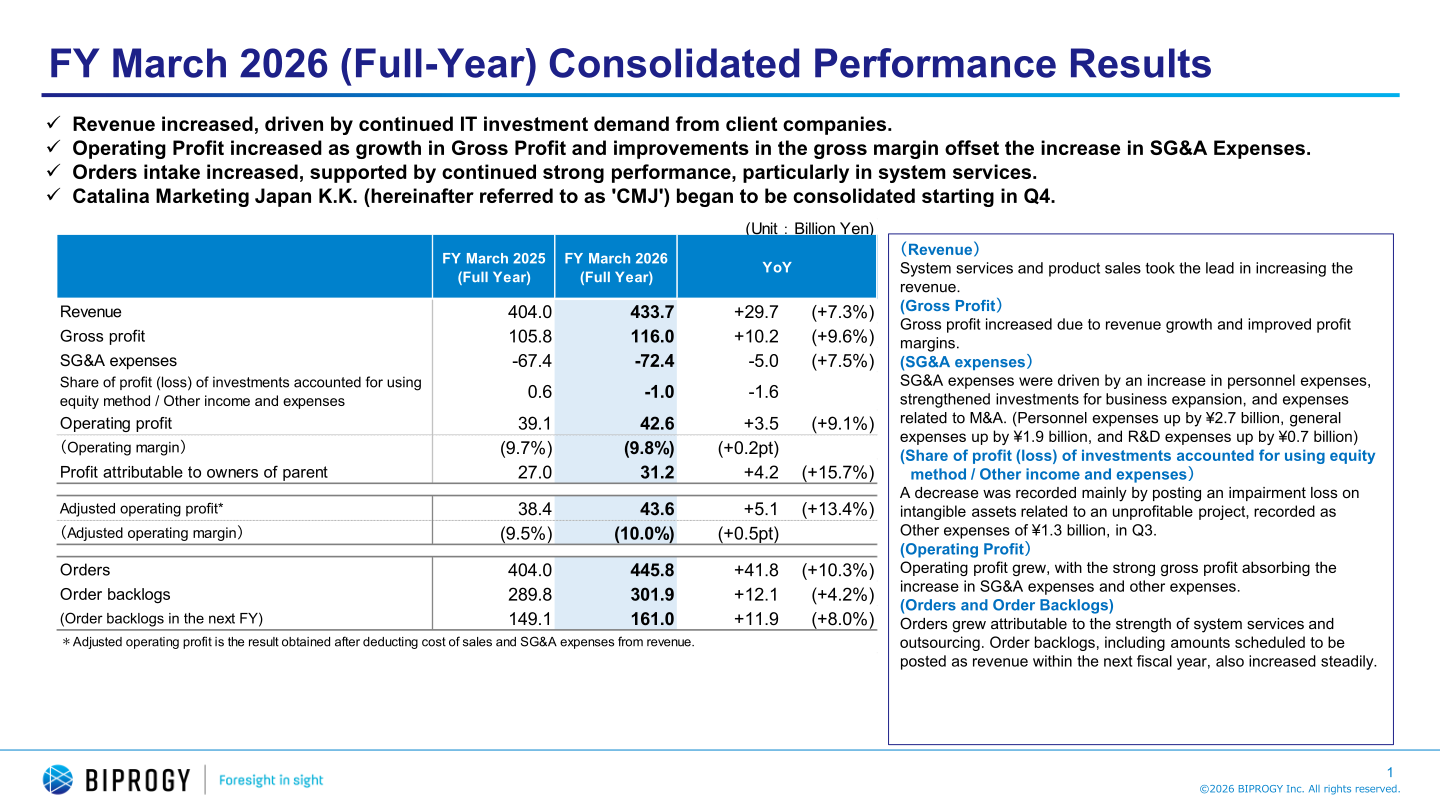
By segment, the company attributes system services growth to projects for financial institutions, retailers, and electric power companies. Support services revenue was driven up in accordance with an increase in product sales, while gross profit decreased partly due to a decline in rebates. Outsourcing revenue and profit increased due to an increase in the number of financial institutions using “BankVision”, the posting of initial fees associated with new adoptions in Q2, as well as the consolidation of CMJ in Q4. Software revenue increased on large-scale projects for the service industry and the manufacturing industry, but profit declined due to a rebound from high-margin projects recorded in Q4 of the previous fiscal year. Hardware growth in revenue and gross profit resulted from the recording of projects for manufacturers as well as large-scale projects for research institutions and government agencies.
| Segment (Unit: Billion Yen) | Revenue FY March 2025 | Gross Profit FY March 2025 (Gross Margin) | Revenue FY March 2026 | Gross Profit FY March 2026 (Gross Margin) | Revenue YoY | Gross Profit YoY |
|---|---|---|---|---|---|---|
| System services | 130.4 | 44.7 (34.3%) | 140.8 | 51.1 (36.3%) | +10.4 (+8.0%) | +6.4 (+14.3%) |
| Support services | 58.4 | 19.4 (33.3%) | 59.9 | 19.0 (31.6%) | +1.6 (+2.7%) | -0.5 (-2.3%) |
| Outsourcing | 90.6 | 18.2 (20.1%) | 97.2 | 21.4 (22.0%) | +6.7 (+7.4%) | +3.1 (+17.1%) |
| Other services | 12.1 | 2.9 (23.9%) | 12.9 | 3.4 (26.2%) | +0.8 (+6.5%) | +0.5 (+16.8%) |
| Software | 45.1 | 9.2 (20.3%) | 47.4 | 7.5 (15.9%) | +2.4 (+5.2%) | -1.6 (-17.7%) |
| Hardware | 67.4 | 11.4 (16.9%) | 75.3 | 13.6 (18.1%) | +7.9 (+11.7%) | +2.3 (+19.9%) |
| Total | 404.0 | 105.8 (26.2%) | 433.7 | 116.0 (26.7%) | +29.7 (+7.3%) | +10.2 (+9.6%) |
Orders by segment also increased, with total orders of ¥445.8 billion, up ¥41.8 billion (+10.3%). Orders and order backlogs in system services were driven by continued modernization demand such as the recording of large projects for financial institutions and retailers, while outsourcing orders increased mainly due to system renewal projects for financial institutions, new adoptions of “BankVision” in Q2, and the consolidation of CMJ.
| Segment — Orders (Unit: Billion Yen) | FY March 2025 (Full Year) | FY March 2026 (Full Year) | YoY |
|---|---|---|---|
| System services | 131.6 | 145.1 | +13.5 (+10.3%) |
| Support services | 65.8 | 66.2 | +0.4 (+0.6%) |
| Outsourcing | 81.4 | 102.0 | +20.6 (+25.3%) |
| Other services | 12.1 | 13.1 | +0.9 (+7.6%) |
| Software | 43.3 | 47.0 | +3.7 (+8.5%) |
| Hardware | 69.8 | 72.4 | +2.6 (+3.7%) |
| Total | 404.0 | 445.8 | +41.8 (+10.3%) |
Focus Areas (Core and Growth Businesses)
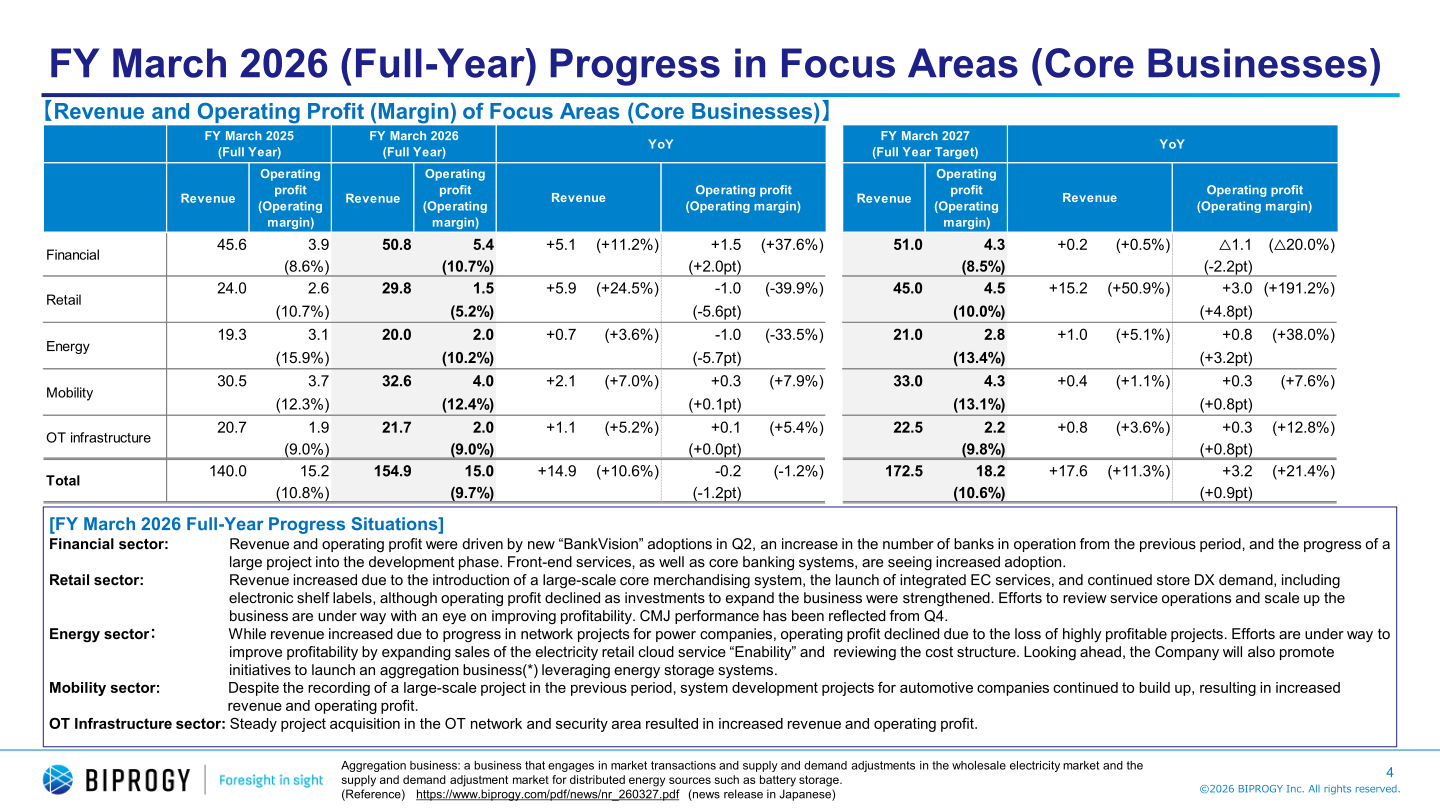
Revenue from the five focus areas designated as core businesses totaled ¥154.9 billion, up ¥14.9 billion (+10.6%), while operating profit was ¥15.0 billion, down ¥0.2 billion (-1.2%). The company states that the financial sector was driven by new “BankVision” adoptions in Q2, an increase in the number of banks in operation from the previous period, and the progress of a large project into the development phase. Retail revenue increased on the introduction of a large-scale core merchandising system, the launch of integrated EC services, and continued store DX demand, although operating profit declined as investments to expand the business were strengthened, with CMJ performance reflected from Q4. In energy, revenue increased due to progress in network projects for power companies while operating profit declined due to the loss of highly profitable projects.
| Focus Area (Unit: Billion Yen) | Revenue FY March 2025 | Operating profit FY March 2025 (Operating margin) | Revenue FY March 2026 | Operating profit FY March 2026 (Operating margin) | Revenue FY March 2027 (Full Year Target) | Operating profit FY March 2027 (Operating margin) |
|---|---|---|---|---|---|---|
| Financial | 45.6 | 3.9 (8.6%) | 50.8 | 5.4 (10.7%) | 51.0 | 4.3 (8.5%) |
| Retail | 24.0 | 2.6 (10.7%) | 29.8 | 1.5 (5.2%) | 45.0 | 4.5 (10.0%) |
| Energy | 19.3 | 3.1 (15.9%) | 20.0 | 2.0 (10.2%) | 21.0 | 2.8 (13.4%) |
| Mobility | 30.5 | 3.7 (12.3%) | 32.6 | 4.0 (12.4%) | 33.0 | 4.3 (13.1%) |
| OT infrastructure | 20.7 | 1.9 (9.0%) | 21.7 | 2.0 (9.0%) | 22.5 | 2.2 (9.8%) |
| Total | 140.0 | 15.2 (10.8%) | 154.9 | 15.0 (9.7%) | 172.5 | 18.2 (10.6%) |
Revenue from the growth businesses totaled ¥14.4 billion, up ¥1.4 billion (+10.5%): market development ¥5.2 billion (+13.0%), business development ¥4.1 billion (-3.2%), and global initiatives ¥5.1 billion (+21.5%). The full-year target for FY March 2027 is ¥35.0 billion in total, comprising ¥10.0 billion for market development, ¥10.0 billion for business development, and ¥15.0 billion for global initiatives.
FY March 2027 Forecast
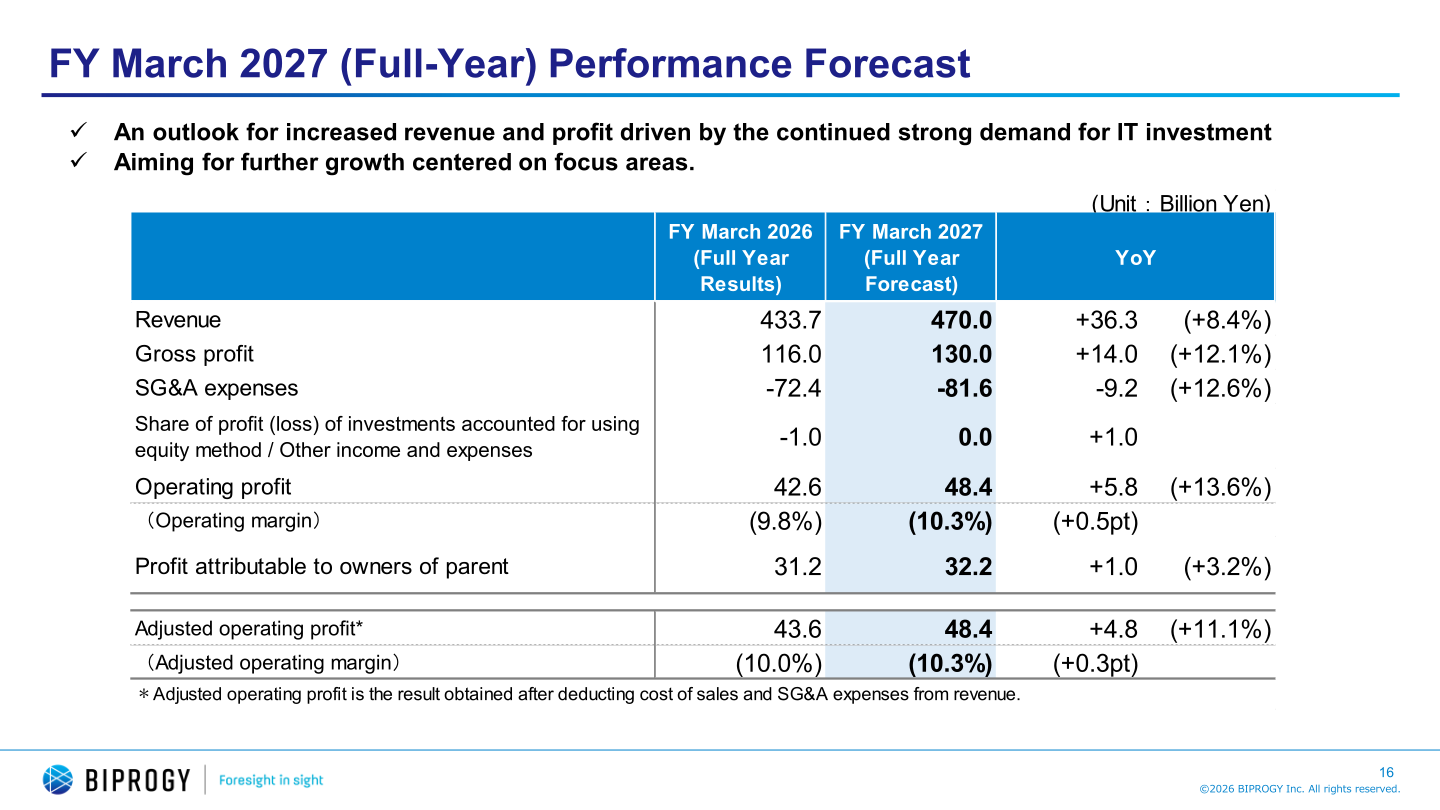
The company forecasts increased revenue and profit driven by the continued strong demand for IT investment, aiming for further growth centered on focus areas. Revenue of ¥470.0 billion exceeds the ¥440.0 billion revenue target described in the Management Policies (2024-2026); the adjusted operating margin forecast of 10.3% compares with the policy target of 11.0%, with the same adjusted operating profit amount of ¥48.4 billion. ROE is targeted at 17.0% or more.
| Item (Unit: Billion Yen) | FY March 2026 (Full Year Results) | FY March 2027 (Full Year Forecast) | YoY |
|---|---|---|---|
| Revenue | 433.7 | 470.0 | +36.3 (+8.4%) |
| Gross profit | 116.0 | 130.0 | +14.0 (+12.1%) |
| SG&A expenses | -72.4 | -81.6 | -9.2 (+12.6%) |
| Share of profit (loss) of investments accounted for using equity method / Other income and expenses | -1.0 | 0.0 | +1.0 |
| Operating profit | 42.6 | 48.4 | +5.8 (+13.6%) |
| (Operating margin) | (9.8%) | (10.3%) | (+0.5pt) |
| Profit attributable to owners of parent | 31.2 | 32.2 | +1.0 (+3.2%) |
| Adjusted operating profit* | 43.6 | 48.4 | +4.8 (+11.1%) |
| (Adjusted operating margin) | (10.0%) | (10.3%) | (+0.3pt) |
Shareholder Returns
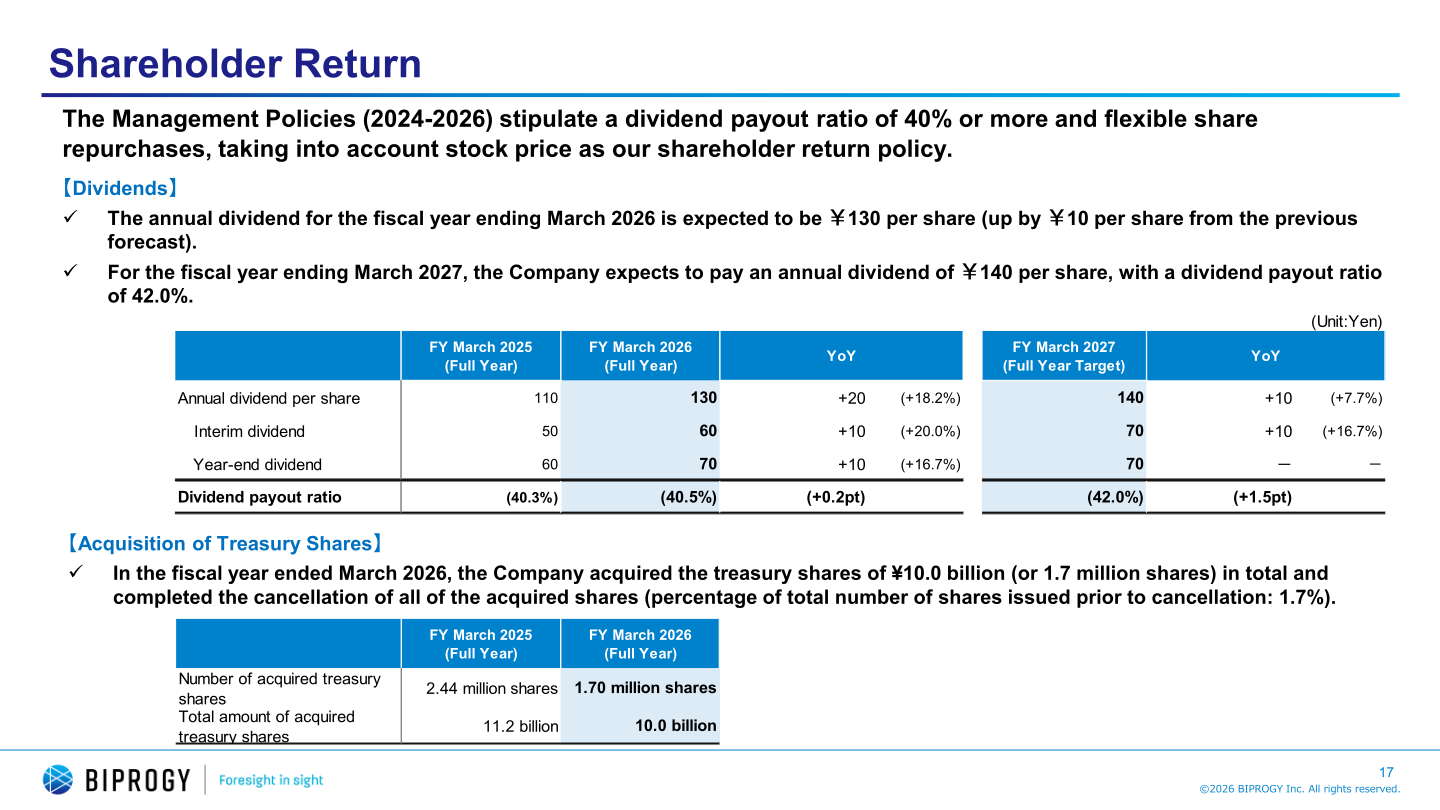
The Management Policies (2024-2026) stipulate a dividend payout ratio of 40% or more and flexible share repurchases, taking into account stock price, as the shareholder return policy. The annual dividend for the fiscal year ending March 2026 is expected to be ¥130 per share, up by ¥10 per share from the previous forecast. For the fiscal year ending March 2027, the company expects to pay an annual dividend of ¥140 per share, with a dividend payout ratio of 42.0%. In the fiscal year ended March 2026, the company acquired treasury shares of ¥10.0 billion (or 1.70 million shares) in total and completed the cancellation of all of the acquired shares (percentage of total number of shares issued prior to cancellation: 1.7%).
| Item (Unit: Yen) | FY March 2025 (Full Year) | FY March 2026 (Full Year) | FY March 2027 (Full Year Target) |
|---|---|---|---|
| Annual dividend per share | 110 | 130 | 140 |
| Interim dividend | 50 | 60 | 70 |
| Year-end dividend | 60 | 70 | 70 |
| Dividend payout ratio | (40.3%) | (40.5%) | (42.0%) |
Financial Position and Cash Flows
Total assets stood at ¥380.7 billion at the end of March 2026, up ¥49.8 billion, with an increase in goodwill among the factors cited. Total liabilities were ¥199.6 billion, up ¥40.0 billion, and total equity was ¥181.1 billion, up ¥9.8 billion. The ratio of owners’ equity to gross assets stood at 47.0 percent, down 4.1 points from the end of the previous consolidated fiscal year. Net cash provided by operating activities was ¥57.6 billion (up ¥12.6 billion), while net cash used in investing activities was ¥74.0 billion, reflecting expenditures for the acquisition of property, plant and equipment and intangible assets, and for the acquisition of subsidiaries. Free cash flows were -¥16.4 billion, compared with ¥36.0 billion in the previous fiscal year.
Management Policies and Topics
The company presents its view that the evolution of AI technology drives structural changes in business models while creating new growth opportunities that enhance the value of solutions and services delivered to society and customers. Centered on the “AI CoE” formed in fiscal year 2026, initiatives for business, development, and operational transformation are integrated across the Group. Targets for 2030 are set in three areas: expanding new businesses generating revenue of ¥100 billion or more in addition to existing businesses through the expansion of AI solutions and services; doubling development productivity through development process transformation; and improving operational efficiency by 30% through the enhancement and advanced efficiency of business processes.
This article is an analysis based on publicly available information and is not a recommendation to buy or sell any specific securities. Investment decisions are your own responsibility.
![[Obayashi] Investors’ Guide 2026 — The Complete 24-Article Breakdown](https://japan-equity.com/wp-content/uploads/2026/07/hub_cover-1024x1024.png)
![[Obayashi] IR & SR Policy — Feeding Dialogue Back into Management](https://japan-equity.com/wp-content/uploads/2026/07/p32_sq-1024x1024.jpg)
![[Obayashi] Real Estate Development — 18.7% Margin, ¥287.7bn Unrealized Gains](https://japan-equity.com/wp-content/uploads/2026/07/p20_sq-1024x1024.jpg)
![[Obayashi] Domestic Civil Engineering — Resilience Spending Supports 9.6% Margin](https://japan-equity.com/wp-content/uploads/2026/07/p11_sq-1024x1024.jpg)
![[Obayashi] Share Price & External Ratings — vs TOPIX, ESG Index Inclusion](https://japan-equity.com/wp-content/uploads/2026/07/p40_sq-1024x1024.jpg)
![[Construction] ¥75.5tn Investment, Shrinking Workforce — Big-5 Market Share](https://japan-equity.com/wp-content/uploads/2026/07/p12_sq-1024x1024.jpg)



![[Obayashi] Capital Policy & Shareholder Returns — ROE 10%+, DOE ~5%, ¥100bn Buyback](https://japan-equity.com/wp-content/uploads/2026/07/p27_sq-1024x1024.jpg)
![[Obayashi] Reducing Cross-Shareholdings — ¥285.2bn Sold in Five Years](https://japan-equity.com/wp-content/uploads/2026/07/p29_sq-1024x1024.jpg)
![[Obayashi] ¥750bn Investment Plan — ¥300bn to Development, ¥190bn to Tech/DX](https://japan-equity.com/wp-content/uploads/2026/07/p30_sq-1024x1024.jpg)
![[Obayashi] MTP2022 KPIs — Operating Profit ~2x Target, ROE 14.4%](https://japan-equity.com/wp-content/uploads/2026/07/p25_sq-1024x1024.jpg)
![[Obayashi] Cash Allocation — ¥420bn Investment CF Over Five Years](https://japan-equity.com/wp-content/uploads/2026/07/p26_sq-1024x1024.jpg)
![[Obayashi] Green Energy — 44 Plants, 344MW, and the Green Hydrogen Challenge](https://japan-equity.com/wp-content/uploads/2026/07/p21_sq-1024x1024.jpg)
![[Obayashi] Tackling the Labor Shortage — Robotics Construction®](https://japan-equity.com/wp-content/uploads/2026/07/p14_sq-1024x1024.jpg)
