
This article is based on publicly available IR materials and is not a recommendation to buy or sell any specific securities.
NAGASE & CO., LTD. posted record-high net sales and profits at all levels in fiscal 2025 (April 1, 2025 to March 31, 2026). Net sales came to 9,727 (100 millions of yen), 103% of the previous year, while operating profit rose to 447 (114%) and profit attributable to owners of the parent reached 331 (130%). Fourth-quarter performance exceeded expectations, due in part to pull-forward demand driven by conditions in the Middle East, and profitability improved through ROIC management, improving the gross profit margin by 1.0 percentage point to 19.3%. The Company also announced its new Medium-Term Management Plan “Walk the Talk 2028” together with these results.
Consolidated Results (Full-Year Actual)
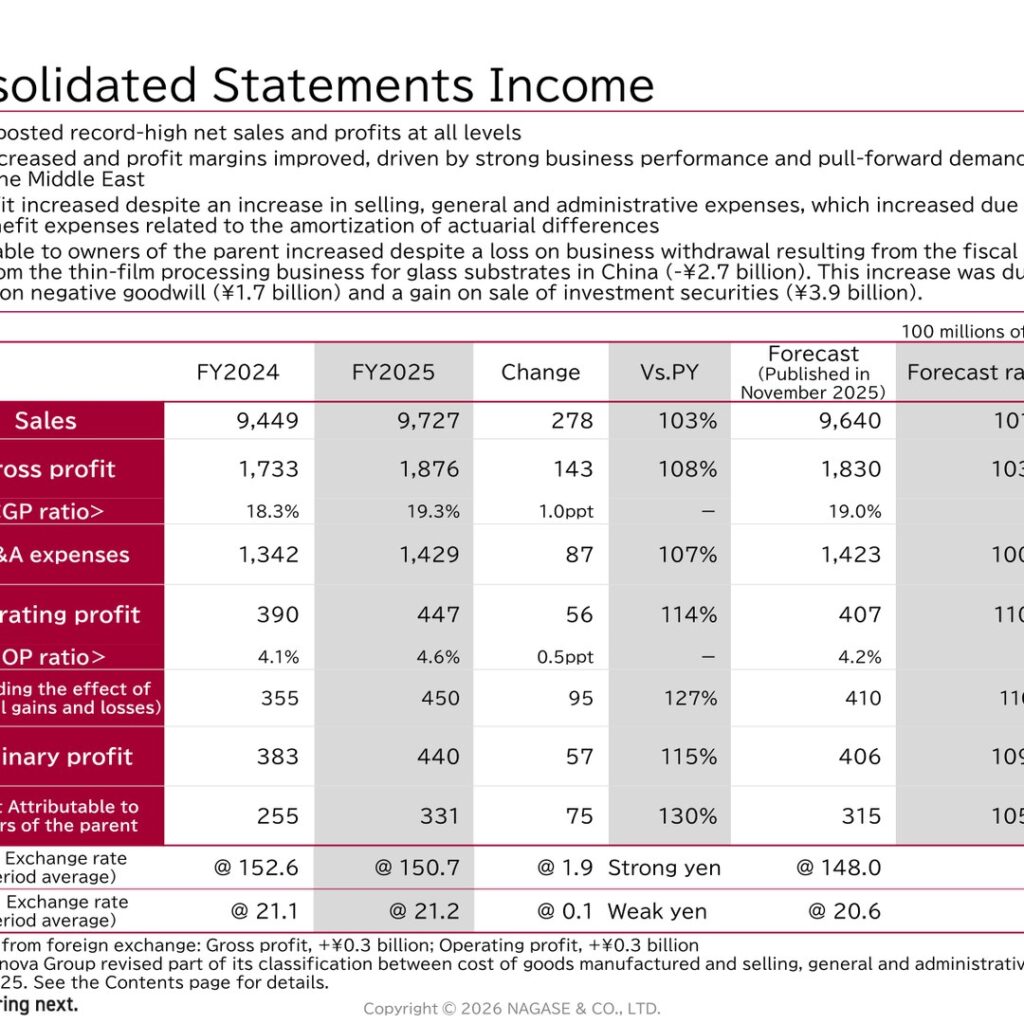
Gross profit increased and profit margins improved, driven by strong business performance and pull-forward demand stemming from conditions in the Middle East. Operating profit increased despite an increase in selling, general and administrative expenses, which increased due to higher retirement benefit expenses related to the amortization of actuarial differences. Profit attributable to owners of the parent increased despite a loss on business withdrawal resulting from the fiscal 2020 decision to withdraw from the thin-film processing business for glass substrates in China (-¥2.7 billion); this increase was due in part to posting a gain on negative goodwill (¥1.7 billion) and a gain on sale of investment securities (¥3.9 billion). Results exceeded the forecast published in November 2025 at every level. The impact from foreign exchange was +¥0.3 billion on gross profit and +¥0.3 billion on operating profit.
| Item (100 millions of yen) | FY2024 | FY2025 | Change | Vs. PY | Forecast (Published in November 2025) | Forecast ratio |
|---|---|---|---|---|---|---|
| Sales | 9,449 | 9,727 | 278 | 103% | 9,640 | 101% |
| Gross profit | 1,733 | 1,876 | 143 | 108% | 1,830 | 103% |
| <GP ratio> | 18.3% | 19.3% | 1.0ppt | ― | 19.0% | ― |
| SG&A expenses | 1,342 | 1,429 | 87 | 107% | 1,423 | 100% |
| Operating profit | 390 | 447 | 56 | 114% | 407 | 110% |
| <OP ratio> | 4.1% | 4.6% | 0.5ppt | ― | 4.2% | ― |
| Operating profit (excluding the effect of actuarial gains and losses) | 355 | 450 | 95 | 127% | 410 | 110% |
| Ordinary profit | 383 | 440 | 57 | 115% | 406 | 109% |
| Profit attributable to owners of the parent | 255 | 331 | 75 | 130% | 315 | 105% |
| US$ exchange rate (period average) | @ 152.6 | @ 150.7 | @ 1.9 Strong yen | ― | @ 148.0 | ― |
| RMB exchange rate (period average) | @ 21.1 | @ 21.2 | @ 0.1 Weak yen | ― | @ 20.6 | ― |
By region, domestic gross profit rose to 875 from 831 (100 millions of yen) and overseas gross profit rose to 1,001 from 901, taking the overseas gross profit ratio to 53.4% from 52.0%. On the balance sheet, total assets stood at 8,715 as of March 2026 versus 8,081 a year earlier, interest-bearing debt was 1,910 versus 1,753, the shareholders’ equity ratio was 48.8% (down 0.6ppt) and the net D/E ratio was 0.34. Operating cash flow was 478, investing cash flow was (465) reflecting the acquisition of the Nagase Circrea Group and Nagase Diagnostics, financing cash flow was (253), and free cash flow was 12.
Segment Results
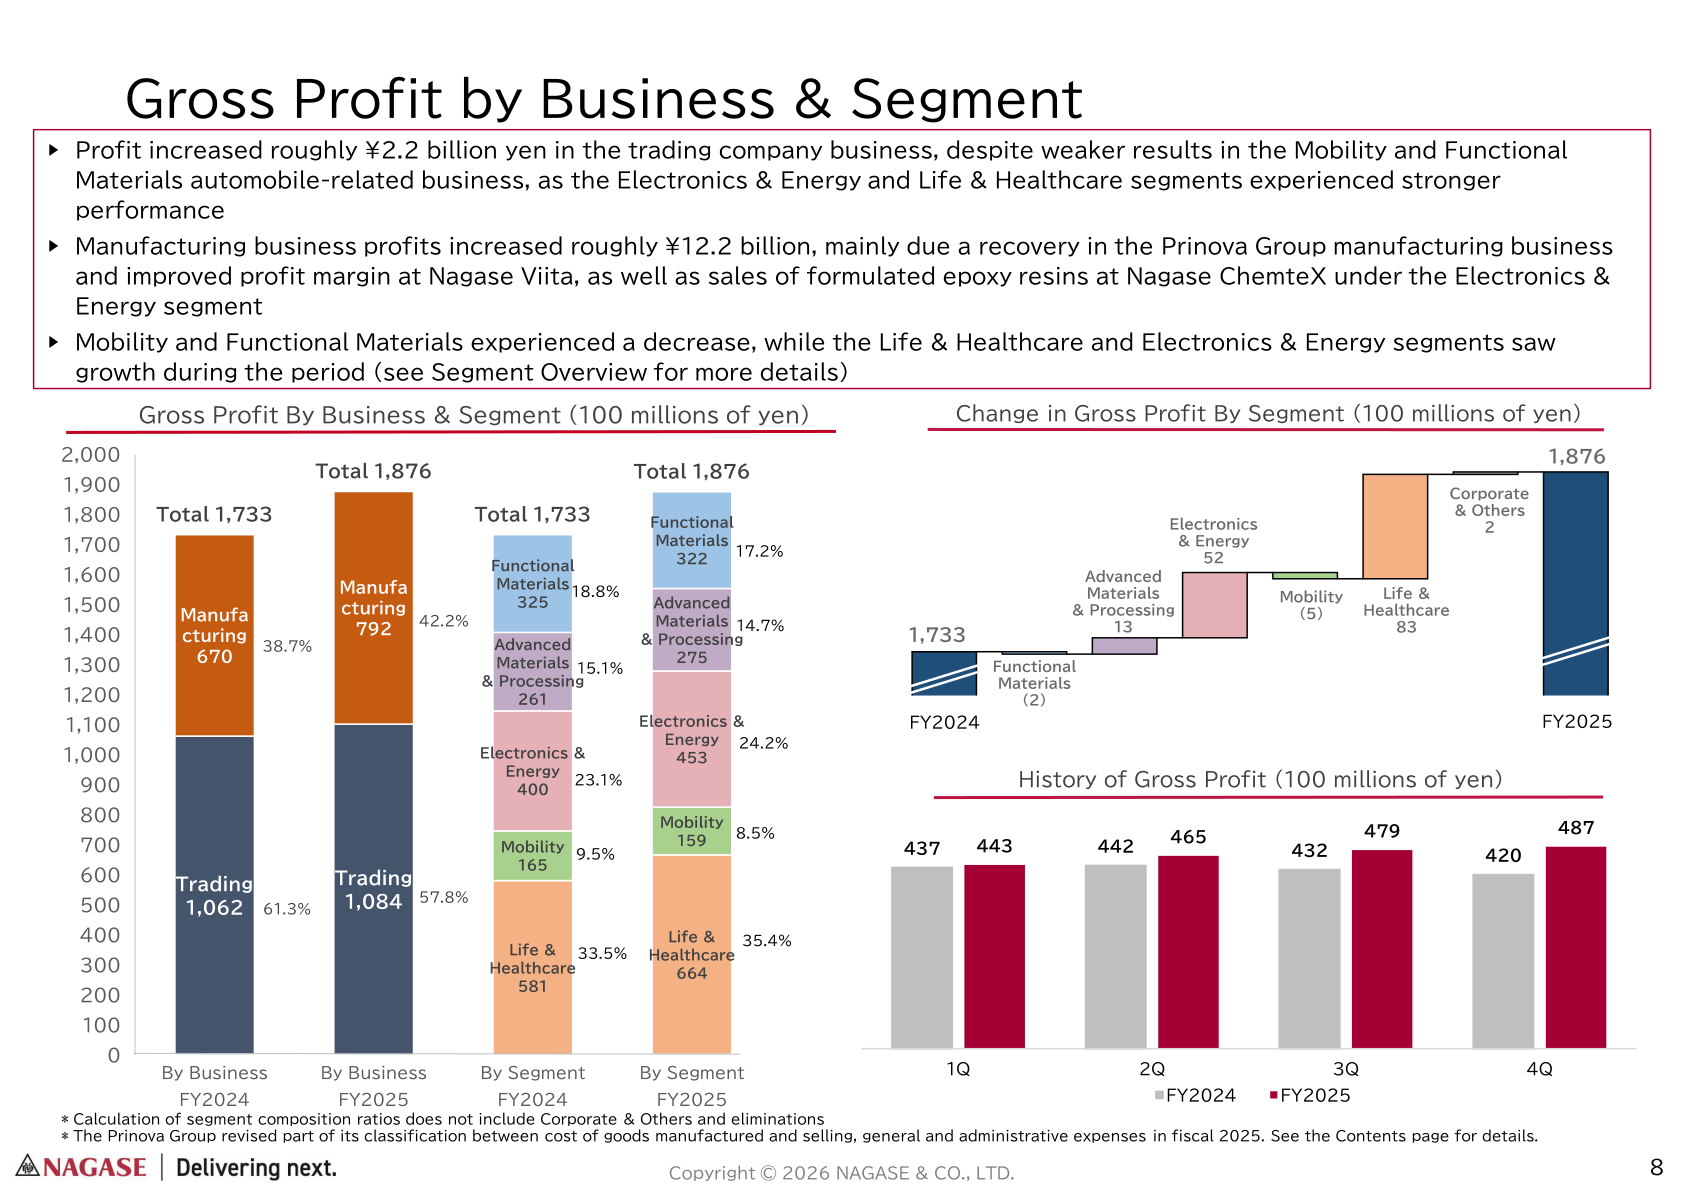
Gross profit in the trading company business increased roughly ¥2.2 billion, while the manufacturing business increased roughly ¥12.2 billion, mainly due to a recovery in the Prinova Group manufacturing business and an improved profit margin at Nagase Viita, as well as sales of formulated epoxy resins at Nagase ChemteX. By segment, Life & Healthcare and Electronics & Energy saw growth, while Mobility and Functional Materials experienced a decrease. Among the major manufacturing subsidiaries, Nagase ChemteX recorded sales of 270 and operating profit of 29, Nagase Viita recorded sales of 346 and operating profit of 57, and the Prinova Group recorded sales of 2,142 and operating profit of 69 against 25 in the previous fiscal year.
| Segment (100 millions of yen) | Sales FY2025 | Sales FY2024 | Gross profit FY2025 | Gross profit FY2024 | Operating profit FY2025 | Operating profit FY2024 |
|---|---|---|---|---|---|---|
| Functional Materials | 1,536 | 1,537 | 322 | 325 | 93 | 92 |
| Advanced Materials & Processing | 2,066 | 2,106 | 275 | 261 | 76 | 66 |
| Electronics & Energy | 1,728 | 1,613 | 453 | 400 | 148 | 123 |
| Mobility | 1,302 | 1,320 | 159 | 165 | 37 | 42 |
| Life & Healthcare | 3,092 | 2,870 | 664 | 581 | 98 | 34 |
FY2026 Forecast
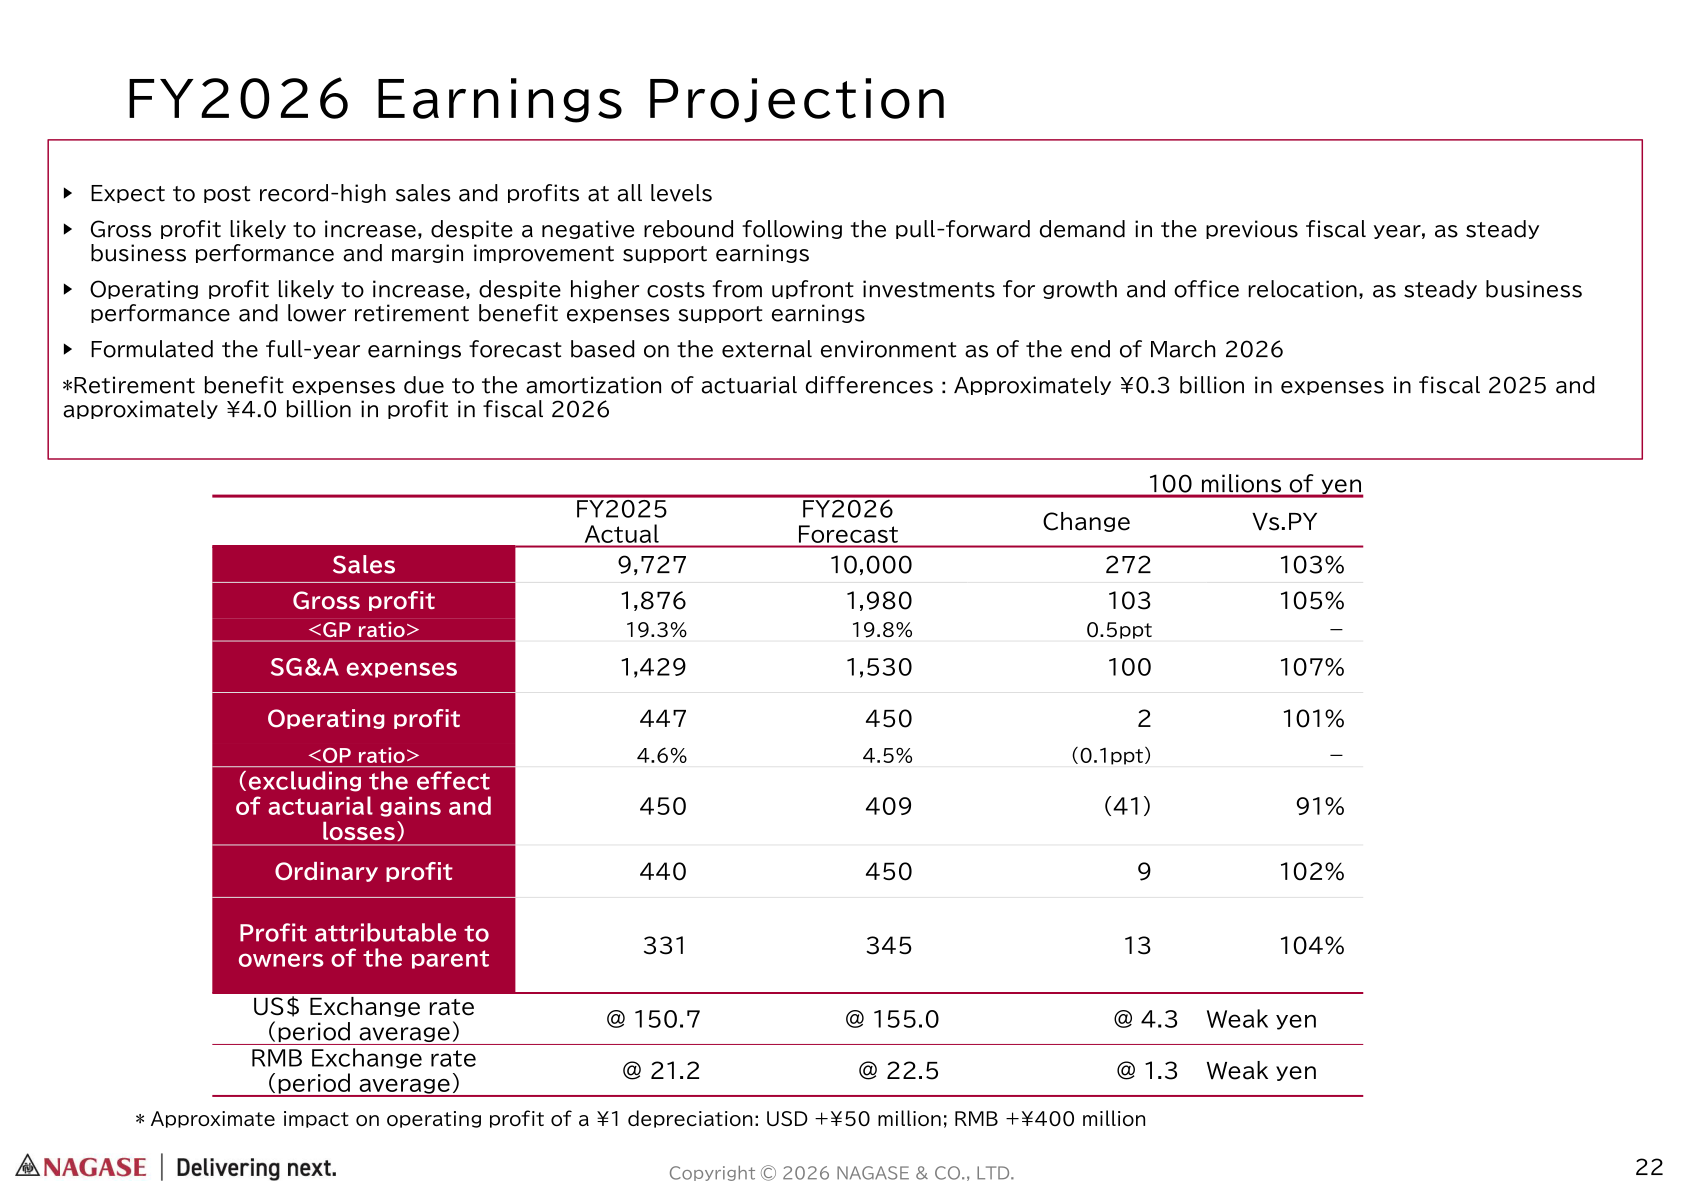
For fiscal 2026 the Company expects to post record-high sales and profits at all levels. Gross profit is likely to increase, despite a negative rebound following the pull-forward demand in the previous fiscal year, as steady business performance and margin improvement support earnings. Operating profit is likely to increase, despite higher costs from upfront investments for growth and office relocation, as steady business performance and lower retirement benefit expenses support earnings. The full-year earnings forecast was formulated based on the external environment as of the end of March 2026. Retirement benefit expenses due to the amortization of actuarial differences are approximately ¥0.3 billion in expenses in fiscal 2025 and approximately ¥4.0 billion in profit in fiscal 2026.
| Item (100 millions of yen) | FY2025 Actual | FY2026 Forecast | Change | Vs. PY |
|---|---|---|---|---|
| Sales | 9,727 | 10,000 | 272 | 103% |
| Gross profit | 1,876 | 1,980 | 103 | 105% |
| <GP ratio> | 19.3% | 19.8% | 0.5ppt | ― |
| SG&A expenses | 1,429 | 1,530 | 100 | 107% |
| Operating profit | 447 | 450 | 2 | 101% |
| <OP ratio> | 4.6% | 4.5% | (0.1ppt) | ― |
| Operating profit (excluding the effect of actuarial gains and losses) | 450 | 409 | (41) | 91% |
| Ordinary profit | 440 | 450 | 9 | 102% |
| Profit attributable to owners of the parent | 331 | 345 | 13 | 104% |
| US$ exchange rate (period average) | @ 150.7 | @ 155.0 | @ 4.3 Weak yen | ― |
| RMB exchange rate (period average) | @ 21.2 | @ 22.5 | @ 1.3 Weak yen | ― |
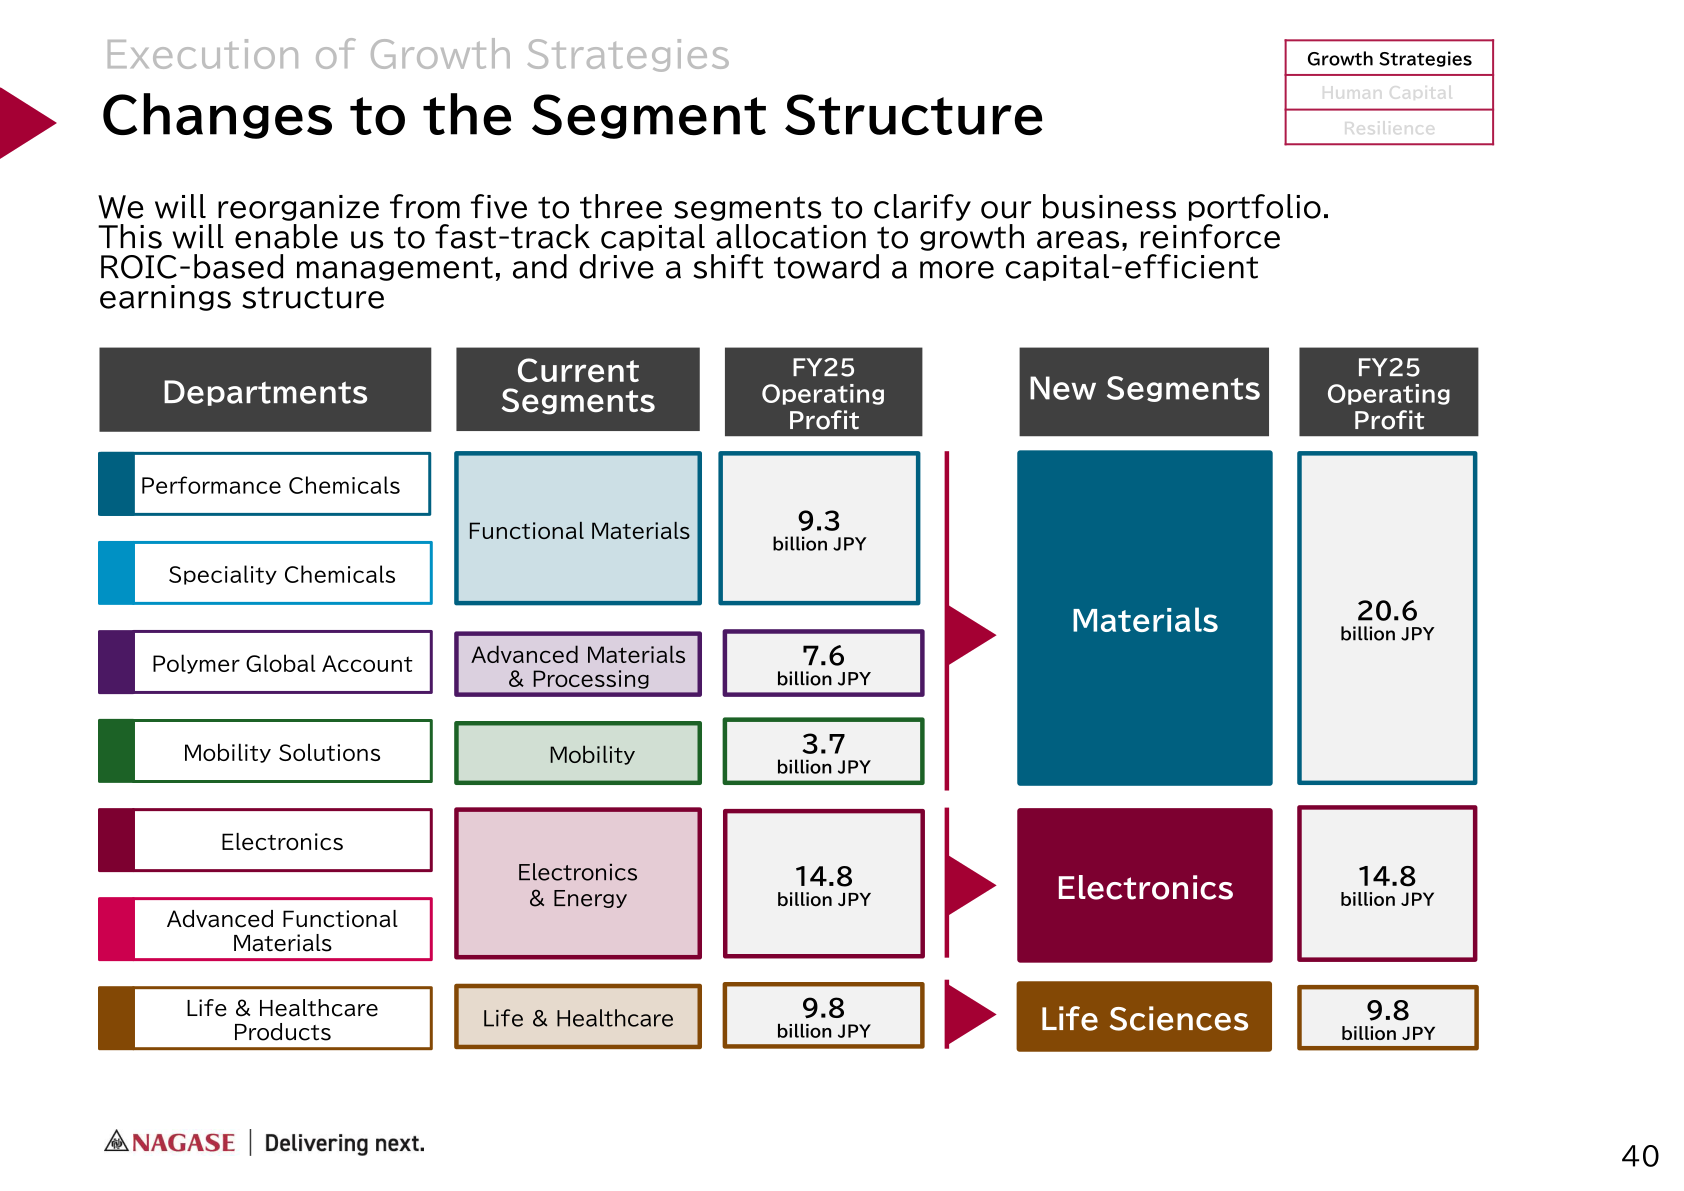
From fiscal 2026 the Company will reorganize from five segments to three ― Materials, Electronics and Life Sciences ― to clarify its business portfolio and accelerate decision-making. The projection below is presented on the new segment basis. The allocation method for shared corporate expenses was revised in fiscal 2026 to improve segment performance management; fiscal 2025 results reflect the new method but remain preliminary and subject to change. Operating profit is likely to decline across all segments due to higher upfront investments in growth and costs associated with the office relocation, while gross profit is expected to increase across all segments.
| New segment (100 millions of yen) | Metric | FY2025 Actual | FY2026 Forecast | Change | Vs. PY |
|---|---|---|---|---|---|
| Materials | Sales | 4,905 | 4,955 | 49 | 101% |
| Materials | Gross profit | 757 | 776 | 18 | 102% |
| Materials | Operating profit | 214 | 196 | (18) | 91% |
| Electronics | Sales | 1,728 | 1,750 | 21 | 101% |
| Electronics | Gross profit | 453 | 479 | 25 | 106% |
| Electronics | Operating profit | 153 | 144 | (9) | 94% |
| Life Science | Sales | 3,092 | 3,294 | 202 | 107% |
| Life Science | Gross profit | 664 | 724 | 60 | 109% |
| Life Science | Operating profit | 86 | 72 | (14) | 84% |
| Corporate & Others | Operating profit | (7) | 38 | 45 | ― |
| Total | Sales | 9,727 | 10,000 | 272 | 103% |
| Total | Gross profit | 1,876 | 1,980 | 103 | 105% |
| Total | Operating profit | 447 | 450 | 2 | 101% |
Shareholder Returns
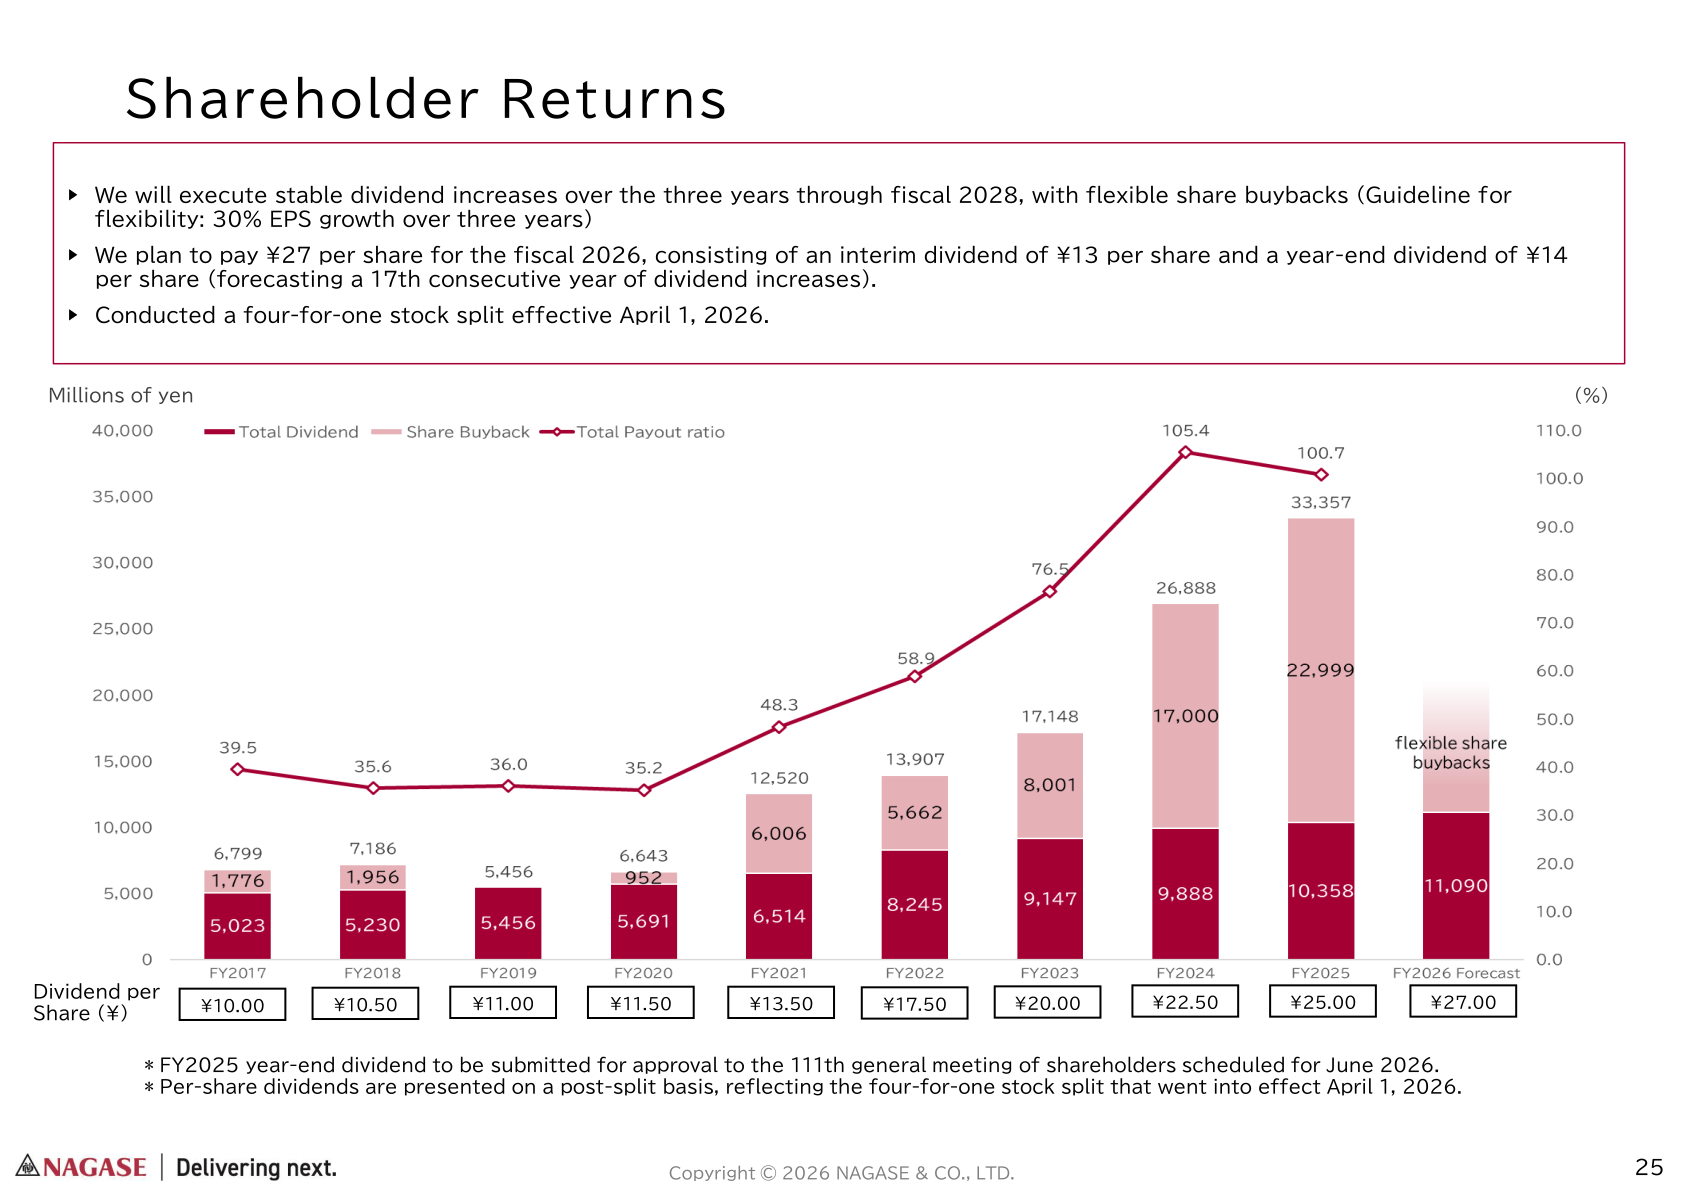
The Company will execute stable dividend increases over the three years through fiscal 2028, with flexible share buybacks (guideline for flexibility: 30% EPS growth over three years). It plans to pay ¥27 per share for fiscal 2026, consisting of an interim dividend of ¥13 per share and a year-end dividend of ¥14 per share, forecasting a 17th consecutive year of dividend increases. The dividend per share for fiscal 2025 was ¥25.00. A four-for-one stock split was conducted effective April 1, 2026, and per-share dividends are presented on a post-split basis. The fiscal 2025 year-end dividend is to be submitted for approval to the 111th general meeting of shareholders scheduled for June 2026. In fiscal 2025, share buybacks amounted to 230 and dividends paid to 101 (100 millions of yen).
Medium-Term Management Plan “Walk the Talk 2028”
Under the previous plan ACE 2.0, NAGASE achieved both of its KGIs ― a sustainable operating profit of JPY 35 billion and an ROE of 8.0% or higher ― finishing fiscal 2025 with operating profit of ¥44.7 billion and ROE of 8.0%. The new plan “Walk the Talk 2028” is positioned as “Building the Foundation for Exponential Growth,” with the aim of achieving a market capitalization of JPY 1 trillion at the earliest opportunity, and the planning period was revised from the previous five years to two consecutive three-year cycles. Company-wide KGIs are operating profit of JPY 50.0 billion or more and ROE of 9.0% or more, alongside a non-financial target of a 32.7% reduction ratio in Scope 1 and 2 emissions compared to fiscal 2021. Fiscal 2028 segment targets are operating profit of JPY 22.0 billion and EBITDA of JPY 23.5 billion for Materials, operating profit of JPY 17.0 billion and EBITDA of JPY 21.6 billion for Electronics, and operating profit of JPY 11.0 billion and EBITDA of JPY 20.0 billion for Life Sciences. The three core policies are execution of growth strategies, development of human capital, and building resilience.
This article is an analysis based on publicly available information and is not a recommendation to buy or sell any specific securities. Investment decisions are your own responsibility.
![[Obayashi] Investors’ Guide 2026 — The Complete 24-Article Breakdown](https://japan-equity.com/wp-content/uploads/2026/07/hub_cover-1024x1024.png)
![[Obayashi] IR & SR Policy — Feeding Dialogue Back into Management](https://japan-equity.com/wp-content/uploads/2026/07/p32_sq-1024x1024.jpg)
![[Obayashi] Real Estate Development — 18.7% Margin, ¥287.7bn Unrealized Gains](https://japan-equity.com/wp-content/uploads/2026/07/p20_sq-1024x1024.jpg)
![[Obayashi] Domestic Civil Engineering — Resilience Spending Supports 9.6% Margin](https://japan-equity.com/wp-content/uploads/2026/07/p11_sq-1024x1024.jpg)
![[Obayashi] Share Price & External Ratings — vs TOPIX, ESG Index Inclusion](https://japan-equity.com/wp-content/uploads/2026/07/p40_sq-1024x1024.jpg)
![[Construction] ¥75.5tn Investment, Shrinking Workforce — Big-5 Market Share](https://japan-equity.com/wp-content/uploads/2026/07/p12_sq-1024x1024.jpg)



![[Obayashi] Capital Policy & Shareholder Returns — ROE 10%+, DOE ~5%, ¥100bn Buyback](https://japan-equity.com/wp-content/uploads/2026/07/p27_sq-1024x1024.jpg)
![[Obayashi] Reducing Cross-Shareholdings — ¥285.2bn Sold in Five Years](https://japan-equity.com/wp-content/uploads/2026/07/p29_sq-1024x1024.jpg)
![[Obayashi] ¥750bn Investment Plan — ¥300bn to Development, ¥190bn to Tech/DX](https://japan-equity.com/wp-content/uploads/2026/07/p30_sq-1024x1024.jpg)
![[Obayashi] MTP2022 KPIs — Operating Profit ~2x Target, ROE 14.4%](https://japan-equity.com/wp-content/uploads/2026/07/p25_sq-1024x1024.jpg)
![[Obayashi] Cash Allocation — ¥420bn Investment CF Over Five Years](https://japan-equity.com/wp-content/uploads/2026/07/p26_sq-1024x1024.jpg)
![[Obayashi] Green Energy — 44 Plants, 344MW, and the Green Hydrogen Challenge](https://japan-equity.com/wp-content/uploads/2026/07/p21_sq-1024x1024.jpg)
![[Obayashi] Tackling the Labor Shortage — Robotics Construction®](https://japan-equity.com/wp-content/uploads/2026/07/p14_sq-1024x1024.jpg)
