
This article is based on publicly available IR materials and is not a recommendation to buy or sell any specific securities.
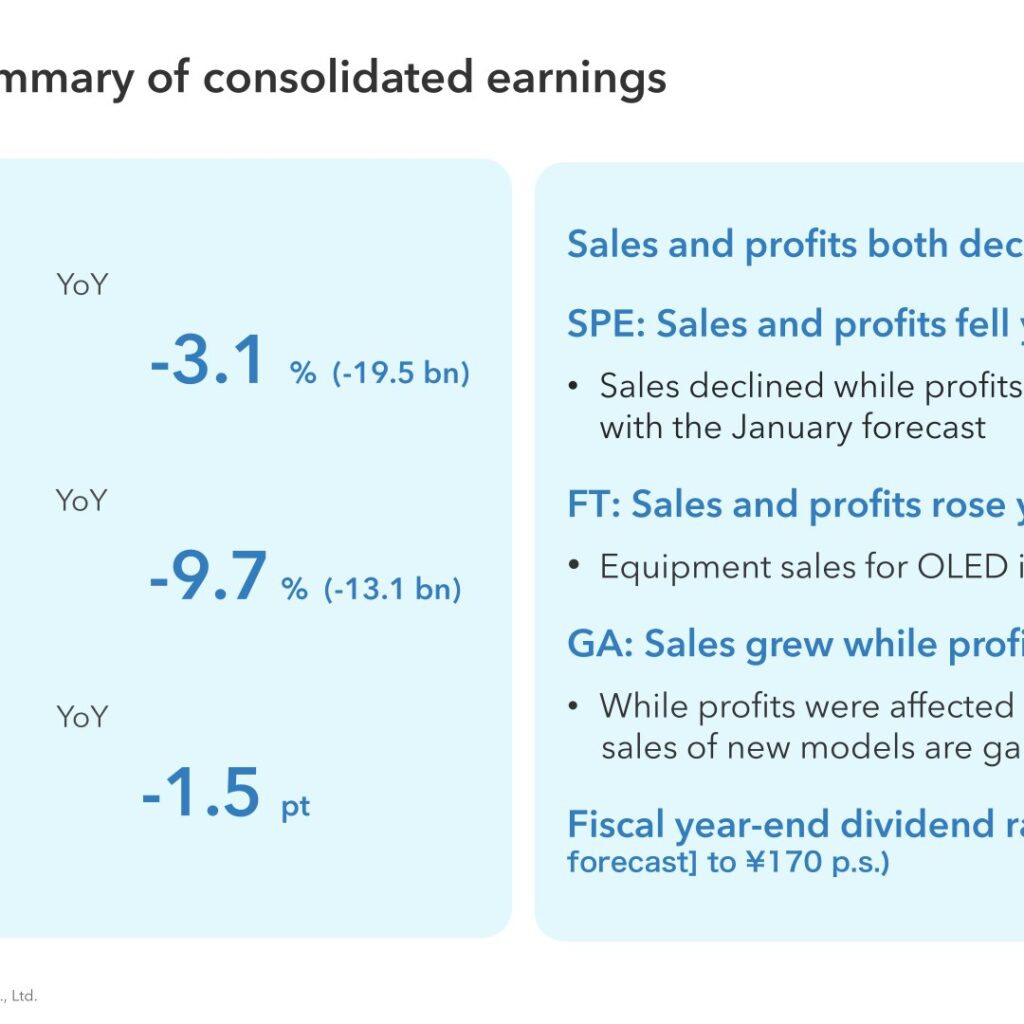
Note: SCREEN Holdings labels the fiscal year ended March 31, 2026 as “FY2026/03”; on this site the most recent completed fiscal year is classified as FY2025, and the labels used in the body text, tables and segment data below follow the company’s own materials. For FY2026/03 SCREEN Holdings reported net sales of ¥605.7 billion, down 3.1% year on year, and operating income of ¥122.5 billion, down 9.7%, with sales and profits both decreasing. Semiconductor Production Equipment (SPE) saw both sales and profits fall, Finetech Solutions (FT) grew both sales and profits on higher OLED-related equipment sales, and Graphic Arts (GA) grew sales while profits declined. The company raised its year-end dividend from the ¥157 per share indicated in the January forecast to ¥170 per share.
Consolidated Results (Full-Year Actual)
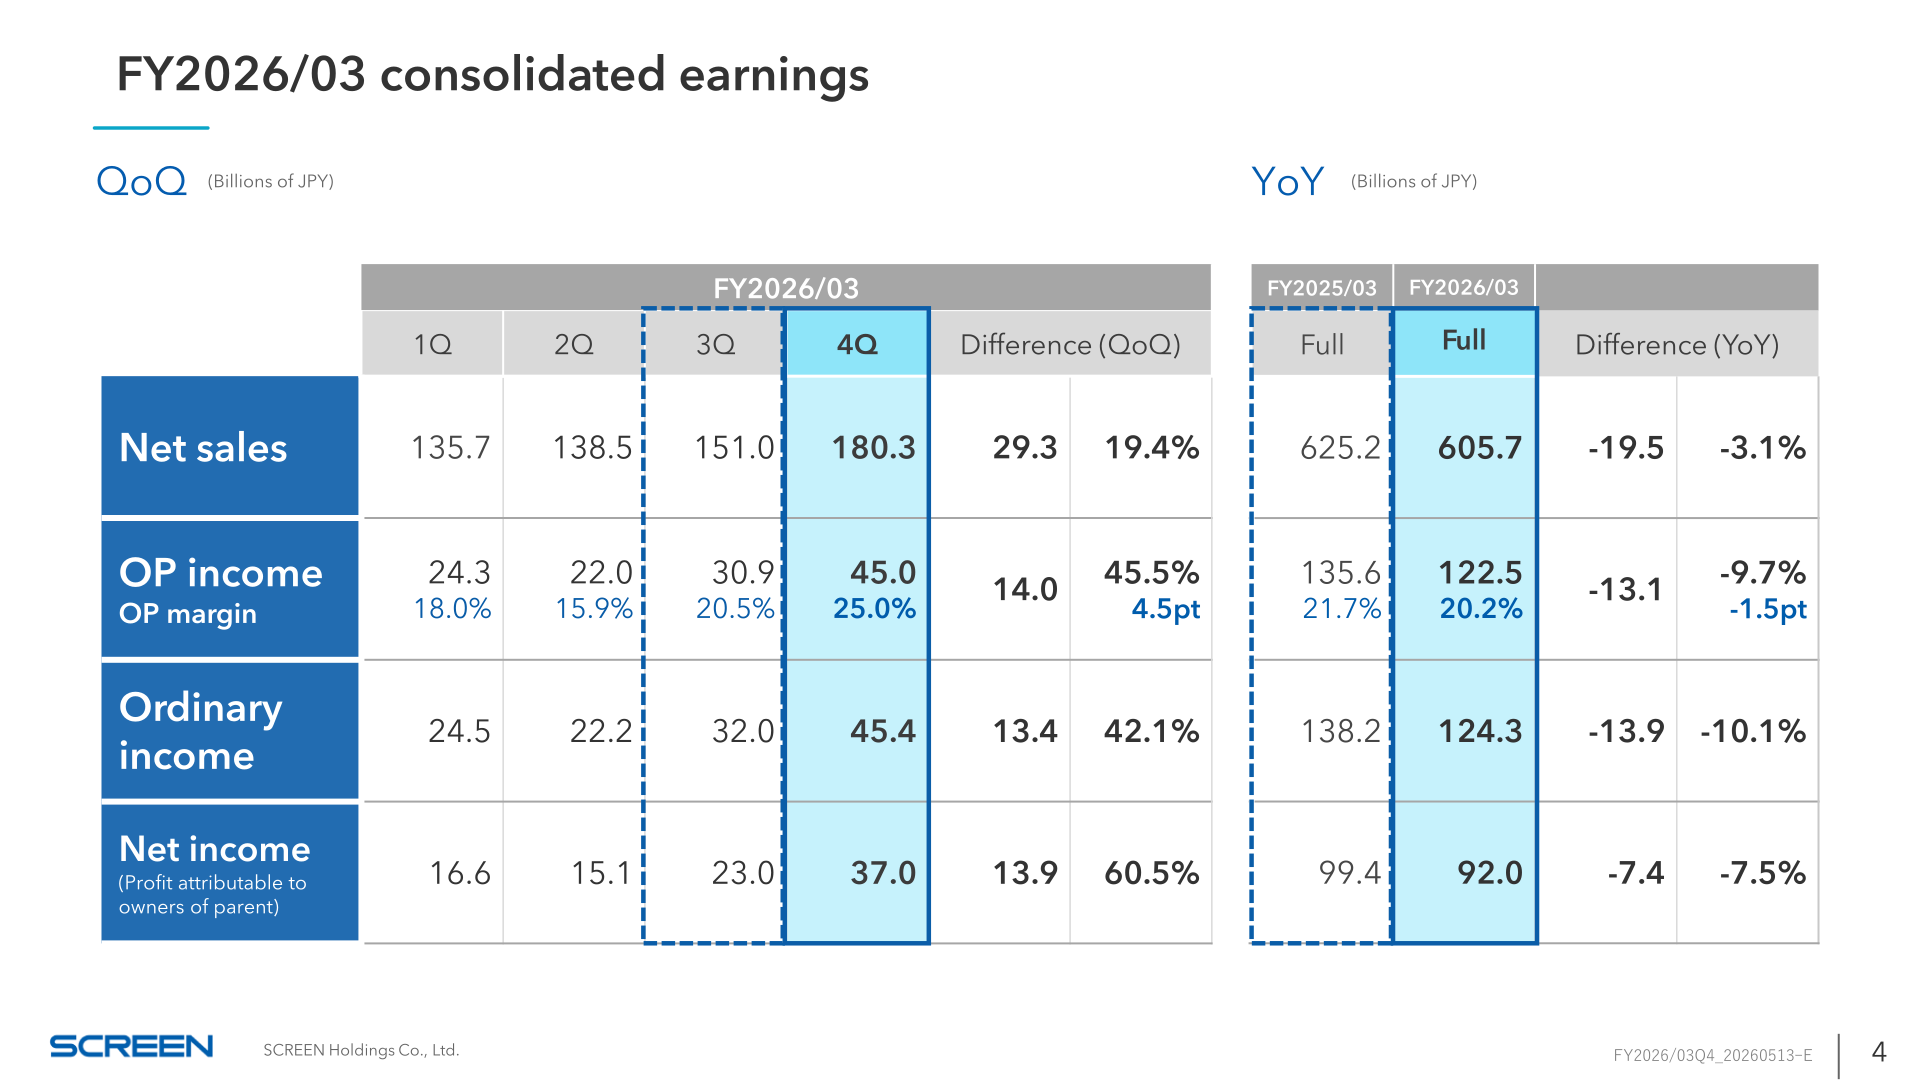
Net sales for FY2026/03 came to ¥605.7 billion, a decrease of ¥19.5 billion or 3.1% year on year, while operating income fell ¥13.1 billion or 9.7% to ¥122.5 billion and the operating margin declined 1.5 points to 20.2%. Ordinary income was ¥124.3 billion, down ¥13.9 billion or 10.1%, and net income (profit attributable to owners of parent) was ¥92.0 billion, down ¥7.4 billion or 7.5%. Quarterly momentum improved through the year: fourth-quarter net sales of ¥180.3 billion were up ¥29.3 billion or 19.4% quarter on quarter, with operating income of ¥45.0 billion, up ¥14.0 billion or 45.5%, and an operating margin of 25.0%.
| Item (Billions of JPY) | FY2025/03 Full | FY2026/03 Full | Difference (YoY) |
|---|---|---|---|
| Net sales | 625.2 | 605.7 | -19.5 / -3.1% |
| OP income | 135.6 | 122.5 | -13.1 / -9.7% |
| OP margin | 21.7% | 20.2% | -1.5pt |
| Ordinary income | 138.2 | 124.3 | -13.9 / -10.1% |
| Net income (Profit attributable to owners of parent) | 99.4 | 92.0 | -7.4 / -7.5% |
The company’s bridge of operating income from FY2025/03 to FY2026/03 attributes -12.4 billion yen to sales and capacity utilization, which declined mainly due to SPE; +11.5 billion yen to profitability, which improved mainly due to SPE and FT; -13.4 billion yen to fixed costs, which increased on growth investment mainly attributable to SPE, including R&D expenses, personnel expenses and depreciation and amortization; and +1.2 billion yen to exchange rates, which mainly impacted SPE and GA.
Segment Results
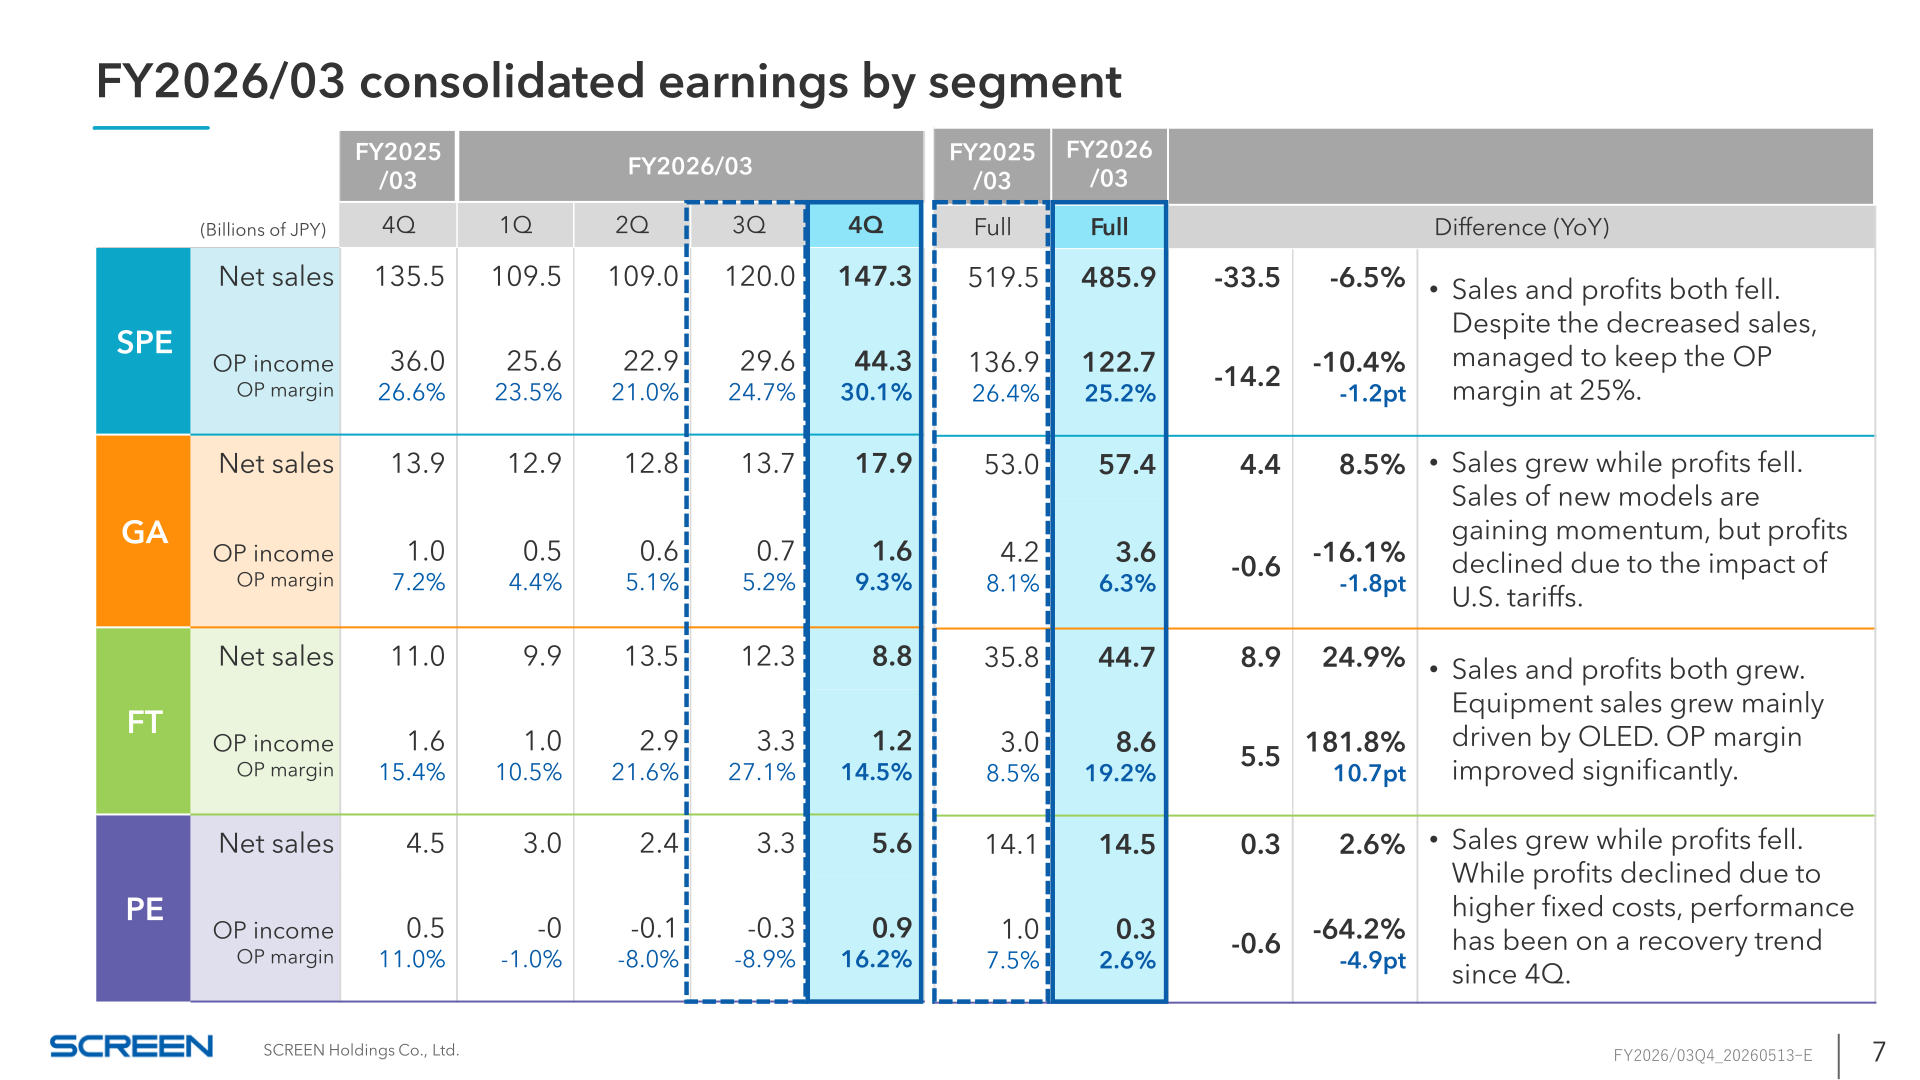
SPE net sales fell ¥33.5 billion or 6.5% to ¥485.9 billion and segment operating income fell ¥14.2 billion or 10.4% to ¥122.7 billion; the company notes that despite the decreased sales it managed to keep the operating margin at 25%. GA sales grew ¥4.4 billion or 8.5% to ¥57.4 billion while operating income fell ¥0.6 billion or 16.1% to ¥3.6 billion, as sales of new models gained momentum but profits declined due to the impact of U.S. tariffs. FT posted growth in both sales and profits, with sales up ¥8.9 billion or 24.9% to ¥44.7 billion and operating income up ¥5.5 billion or 181.8% to ¥8.6 billion, driven mainly by OLED equipment sales and a significantly improved operating margin of 19.2%. PE sales rose ¥0.3 billion or 2.6% to ¥14.5 billion while operating income fell ¥0.6 billion or 64.2% to ¥0.3 billion on higher fixed costs, with performance described as on a recovery trend since the fourth quarter.
| Segment (Billions of JPY) | Metric | FY2025/03 Full | FY2026/03 Full | Difference (YoY) |
|---|---|---|---|---|
| SPE | Net sales | 519.5 | 485.9 | -33.5 / -6.5% |
| SPE | OP income (margin) | 136.9 (26.4%) | 122.7 (25.2%) | -14.2 / -10.4% (-1.2pt) |
| GA | Net sales | 53.0 | 57.4 | 4.4 / 8.5% |
| GA | OP income (margin) | 4.2 (8.1%) | 3.6 (6.3%) | -0.6 / -16.1% (-1.8pt) |
| FT | Net sales | 35.8 | 44.7 | 8.9 / 24.9% |
| FT | OP income (margin) | 3.0 (8.5%) | 8.6 (19.2%) | 5.5 / 181.8% (10.7pt) |
| PE | Net sales | 14.1 | 14.5 | 0.3 / 2.6% |
| PE | OP income (margin) | 1.0 (7.5%) | 0.3 (2.6%) | -0.6 / -64.2% (-4.9pt) |
Within SPE, the company states that for the full year sales to DRAM increased on a year-on-year basis and that post-sales remained stable, with post-sales revenue of ¥99.7 billion in FY2026/03 against ¥85.9 billion in FY2025/03. By destination, SPE full-year sales to Taiwan increased significantly year on year, while in the fourth quarter sales to China rose both quarter on quarter and year on year.
Financial Position and Cash Flows
Net assets reached ¥486.6 billion and the equity ratio stood at 67.4%, with total assets of ¥722.4 billion at the end of FY2026/03 against ¥671.2 billion a year earlier. Full-year operating cash flow was ¥92.7 billion versus ¥71.2 billion in the prior year, described by the company as remaining solid in the fourth quarter, driven by profit accumulation and control of working capital. Investing cash flow was -¥29.7 billion, financing cash flow -¥40.1 billion, and free cash flow ¥62.9 billion. R&D expenses rose to ¥37.7 billion from ¥31.7 billion, capital expenditures were ¥27.7 billion versus ¥29.7 billion, and depreciation and amortization was ¥14.5 billion versus ¥12.8 billion; both R&D expenses and capital expenditures landed within the expected range.
FY2026 Forecast
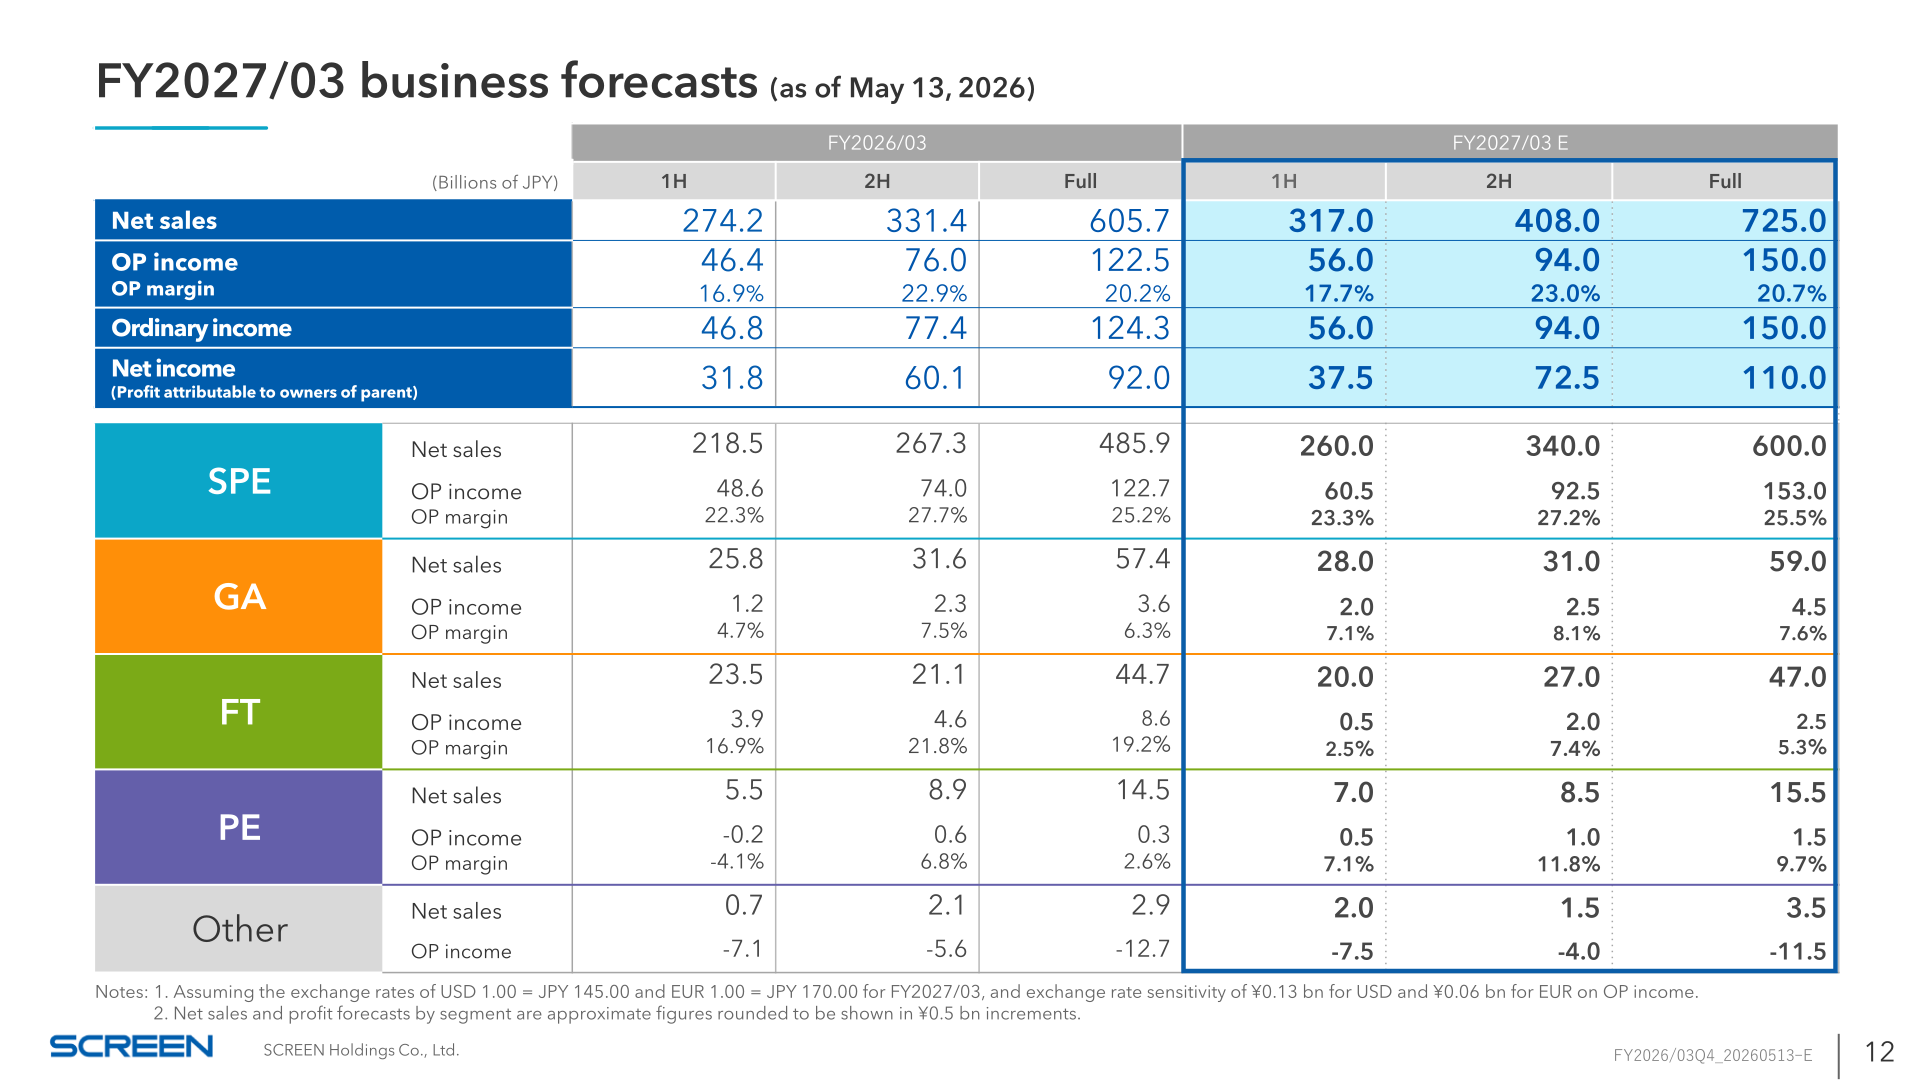
For FY2027/03 (the fiscal year ending March 31, 2027), announced as of May 13, 2026, SCREEN Holdings forecasts net sales of ¥725.0 billion, operating income of ¥150.0 billion for an operating margin of 20.7%, ordinary income of ¥150.0 billion and net income of ¥110.0 billion. The forecast assumes exchange rates of USD 1.00 = JPY 145.00 and EUR 1.00 = JPY 170.00, against FY2026/03 actual rates of USD 1.00 = JPY 151.53 and EUR 1.00 = JPY 175.15. The operating income bridge to the forecast shows +71.5 billion yen from sales and capacity utilization, expected to be driven by SPE; -8.5 billion yen from profitability, mainly impacted by SPE; -32.0 billion yen from fixed costs, with an increase expected due to growth investment mainly in SPE; and -3.5 billion yen from exchange rates.
| Item (Billions of JPY) | FY2026/03 Full (Actual) | FY2027/03 Full (E) |
|---|---|---|
| Net sales | 605.7 | 725.0 |
| OP income (margin) | 122.5 (20.2%) | 150.0 (20.7%) |
| Ordinary income | 124.3 | 150.0 |
| Net income (Profit attributable to owners of parent) | 92.0 | 110.0 |
| SPE net sales / OP income (margin) | 485.9 / 122.7 (25.2%) | 600.0 / 153.0 (25.5%) |
| GA net sales / OP income (margin) | 57.4 / 3.6 (6.3%) | 59.0 / 4.5 (7.6%) |
| FT net sales / OP income (margin) | 44.7 / 8.6 (19.2%) | 47.0 / 2.5 (5.3%) |
| PE net sales / OP income (margin) | 14.5 / 0.3 (2.6%) | 15.5 / 1.5 (9.7%) |
| Other net sales / OP income | 2.9 / -12.7 | 3.5 / -11.5 |
Segment sales and profit forecasts are stated by the company as approximate figures rounded to be shown in ¥0.5 bn increments. For the outlook, the company says all segments are expected to achieve steady growth and that, for the first phase of portfolio transformation, the Advanced Packaging business was consolidated into FT. In SPE, it aims to enter a further growth phase and outperform WFE market growth by steadily capturing robust WFE investment, particularly for AI. On the market, the company expects WFE for CY2025 to land at $117B and CY2026 to grow approximately 15–20% to around $134–140B, with geopolitical impacts to be closely monitored. R&D expenses, capital expenditures and depreciation/amortization are all planned at record-high levels for FY2027/03, at ¥43.0 billion, ¥43.0 billion and ¥18.0 billion respectively, given the growth investment phase of the current medium-term management plan.
Shareholder Returns
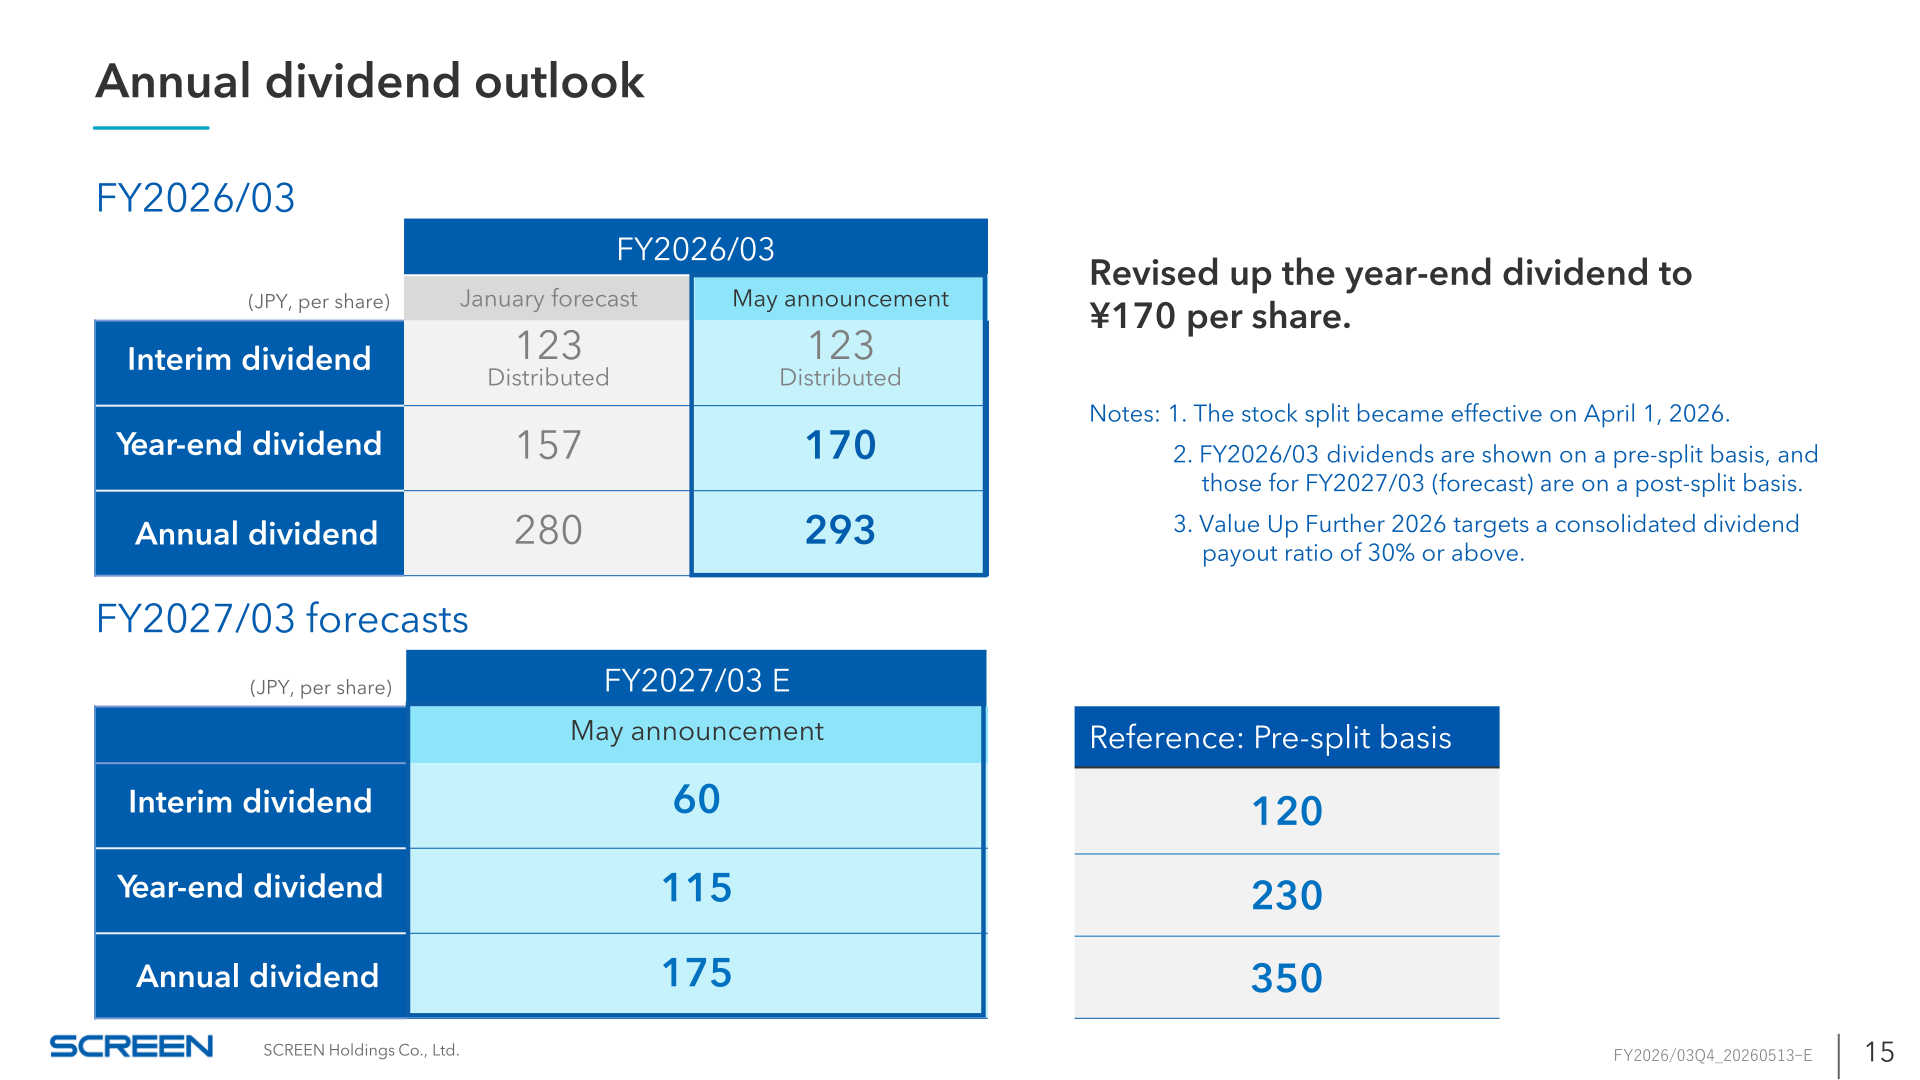
For FY2026/03 SCREEN Holdings revised up the year-end dividend to ¥170 per share from the ¥157 per share indicated in the January forecast, bringing the annual dividend to ¥293 per share after the ¥123 interim dividend already distributed. For FY2027/03 the company forecasts an interim dividend of ¥60, a year-end dividend of ¥115 and an annual dividend of ¥175 per share. A stock split became effective on April 1, 2026; FY2026/03 dividends are shown on a pre-split basis and FY2027/03 forecast dividends on a post-split basis, with the FY2027/03 forecast equivalent to ¥120 interim, ¥230 year-end and ¥350 annual on a pre-split basis. The medium-term plan “Value Up Further 2026” targets a consolidated dividend payout ratio of 30% or above.
| Dividend (JPY, per share) | FY2026/03 January forecast | FY2026/03 May announcement | FY2027/03 E |
|---|---|---|---|
| Interim dividend | 123 (Distributed) | 123 (Distributed) | 60 |
| Year-end dividend | 157 | 170 | 115 |
| Annual dividend | 280 | 293 | 175 |
Medium-Term Plan: Value Up Further 2026
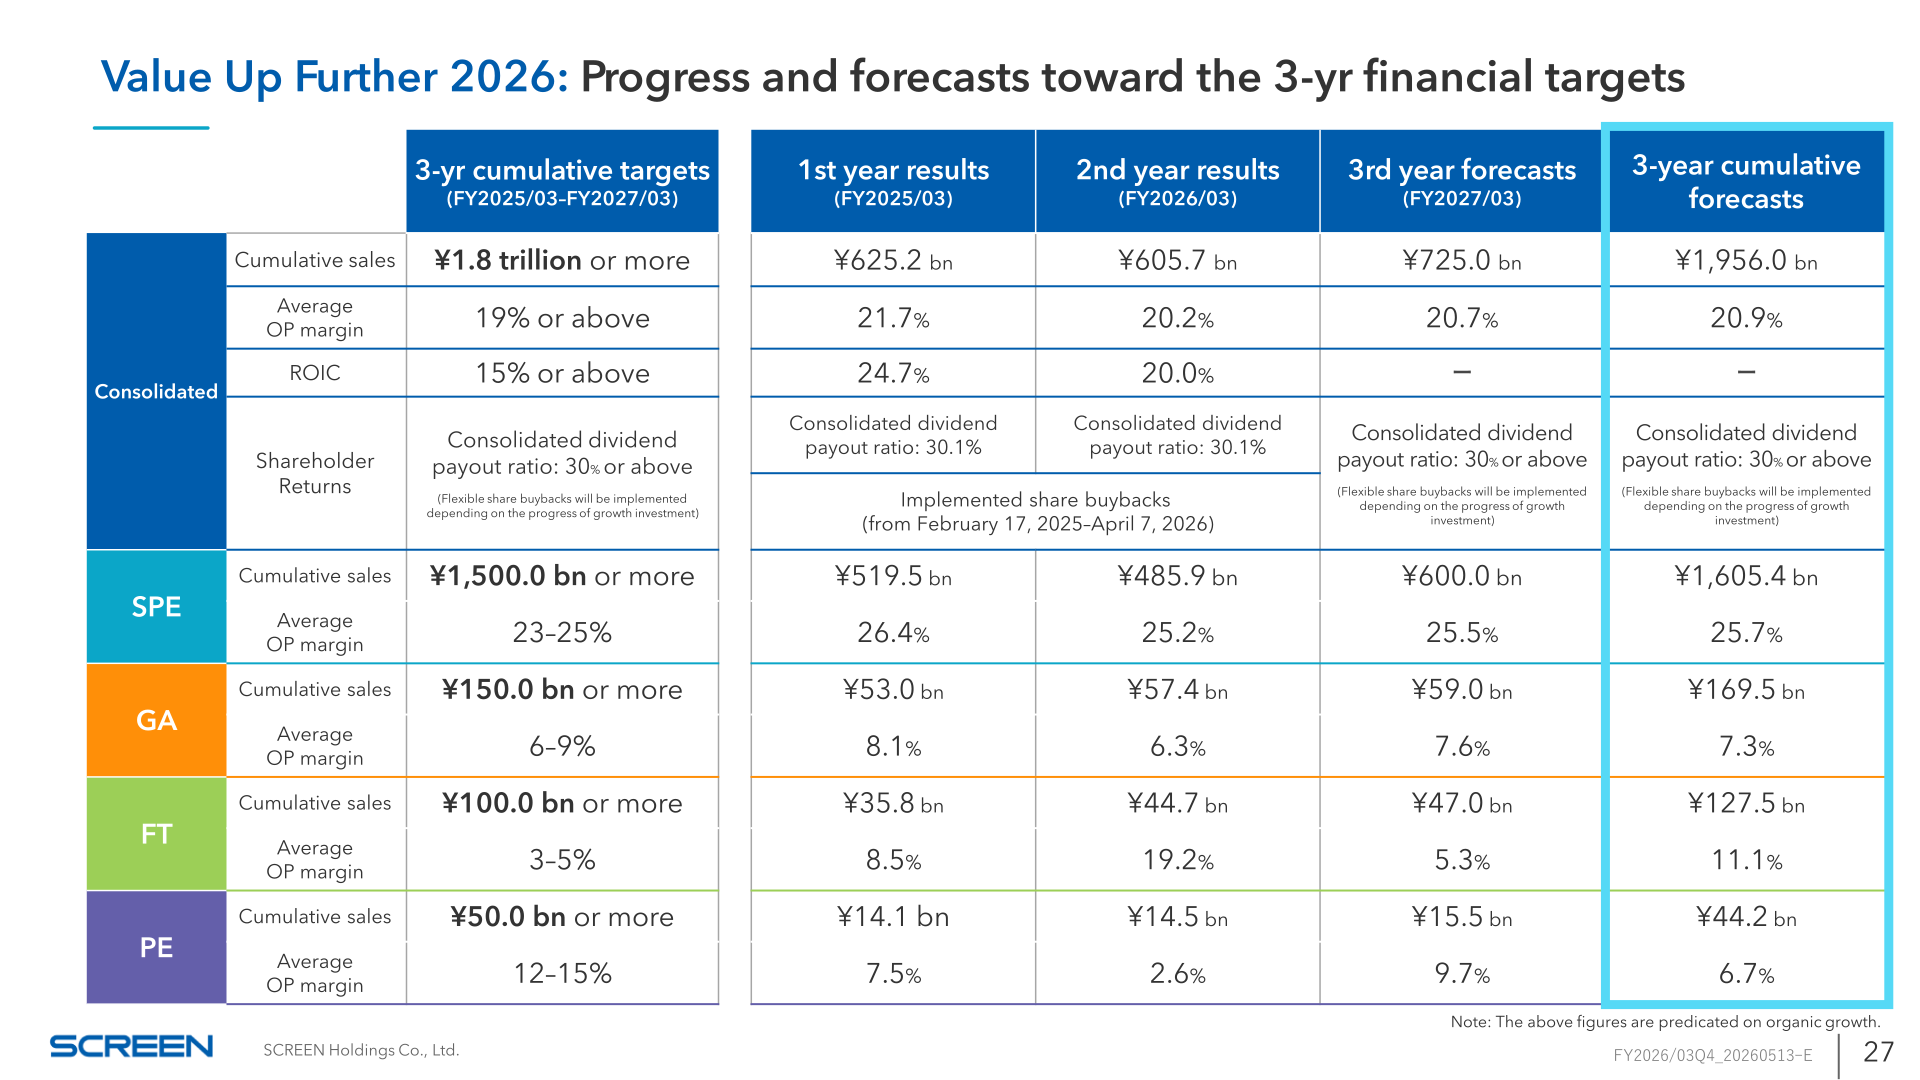
Against the three-year cumulative targets for FY2025/03–FY2027/03 of consolidated cumulative sales of ¥1.8 trillion or more and an average operating margin of 19% or above, the company’s three-year cumulative forecast is ¥1,956.0 bn of sales and a 20.9% average operating margin. ROIC, targeted at 15% or above, was 24.7% in the first year and 20.0% in the second year. By segment, SPE cumulative sales are forecast at ¥1,605.4 bn against a target of ¥1,500.0 bn or more, with an average operating margin of 25.7% versus a 23–25% target; GA at ¥169.5 bn against ¥150.0 bn or more with a 7.3% margin versus 6–9%; FT at ¥127.5 bn against ¥100.0 bn or more with an 11.1% margin versus 3–5%; and PE at ¥44.2 bn against ¥50.0 bn or more with a 6.7% margin versus 12–15%. On shareholder returns, the consolidated dividend payout ratio was 30.1% in both the first and second years, and share buybacks were implemented from February 17, 2025 to April 7, 2026. The three-year cash allocation plan of ¥360.0 billion is estimated to total ¥112.4 bn for R&D, ¥100.4 bn for CAPEX, ¥80.0 bn for strategic investment and ¥89.7 bn for dividends.
Topics
The company held an opening ceremony on April 15, 2026 (local time) for SCREEN Advanced Technology Center of America, LLC (ATCA), a new R&D hub in Albany, New York, located within the Albany NanoTech Complex operated by NY Creates, where it aims to strengthen competitiveness and improve profitability across fields including cleaning and etching, thermal processing and advanced packaging. Other recent news includes the acquisition of shares in LQUOM, Inc., a quantum communication systems startup from Yokohama National University (announced March 13, 2026); a Special Award at the 2025 IP & Intangible Assets Governance Awards (announced March 18, 2026); the 72nd Okochi Memorial Production Prize (announced March 26, 2026); selection as a Health & Productivity Stock for the third time and certification as a Health & Productivity Management Organization for the fourth consecutive year by METI (announced March 10, 2026); and the launch of the SpairD series of PCB repair systems by SCREEN PE (announced March 6, 2026). In the Semiconductor Solution Business for CY2025, the materials cite global share No. 1 positions for batch-type cleaning equipment, single wafer cleaning equipment and spin scrubbers, based on Gartner research.
This article is an analysis based on publicly available information and is not a recommendation to buy or sell any specific securities. Investment decisions are your own responsibility.
![[Obayashi] Investors’ Guide 2026 — The Complete 24-Article Breakdown](https://japan-equity.com/wp-content/uploads/2026/07/hub_cover-1024x1024.png)
![[Obayashi] IR & SR Policy — Feeding Dialogue Back into Management](https://japan-equity.com/wp-content/uploads/2026/07/p32_sq-1024x1024.jpg)
![[Obayashi] Domestic Civil Engineering — Resilience Spending Supports 9.6% Margin](https://japan-equity.com/wp-content/uploads/2026/07/p11_sq-1024x1024.jpg)
![[Obayashi] Overseas Construction — Orders Reach ¥1.2tn](https://japan-equity.com/wp-content/uploads/2026/07/p15_sq-1024x1024.jpg)
![[Obayashi] Share Price & External Ratings — vs TOPIX, ESG Index Inclusion](https://japan-equity.com/wp-content/uploads/2026/07/p40_sq-1024x1024.jpg)
![[Construction] ¥75.5tn Investment, Shrinking Workforce — Big-5 Market Share](https://japan-equity.com/wp-content/uploads/2026/07/p12_sq-1024x1024.jpg)



![[Obayashi] Capital Policy & Shareholder Returns — ROE 10%+, DOE ~5%, ¥100bn Buyback](https://japan-equity.com/wp-content/uploads/2026/07/p27_sq-1024x1024.jpg)
![[Obayashi] Reducing Cross-Shareholdings — ¥285.2bn Sold in Five Years](https://japan-equity.com/wp-content/uploads/2026/07/p29_sq-1024x1024.jpg)
![[Obayashi] ¥750bn Investment Plan — ¥300bn to Development, ¥190bn to Tech/DX](https://japan-equity.com/wp-content/uploads/2026/07/p30_sq-1024x1024.jpg)
![[Obayashi] MTP2022 KPIs — Operating Profit ~2x Target, ROE 14.4%](https://japan-equity.com/wp-content/uploads/2026/07/p25_sq-1024x1024.jpg)
![[Obayashi] Cash Allocation — ¥420bn Investment CF Over Five Years](https://japan-equity.com/wp-content/uploads/2026/07/p26_sq-1024x1024.jpg)
![[Obayashi] Green Energy — 44 Plants, 344MW, and the Green Hydrogen Challenge](https://japan-equity.com/wp-content/uploads/2026/07/p21_sq-1024x1024.jpg)
![[Obayashi] Tackling the Labor Shortage — Robotics Construction®](https://japan-equity.com/wp-content/uploads/2026/07/p14_sq-1024x1024.jpg)
