
This article is based on publicly available IR materials and is not a recommendation to buy or sell any specific securities.
Shimadzu Corporation reported net sales of ¥560.7B for FY2025, up ¥21.7B or 4% year on year, which the company describes as a record high for the sixth consecutive year. Operating income rose ¥2.0B or 3% to ¥73.7B, while ordinary income increased 15% to ¥82.8B and profit attributable to owners of parent 13% to ¥60.5B; the company states that operating income, ordinary income and profit attributable to owners of parent all returned to record highs for the first time in two years. The overseas sales ratio continued to rise, reaching 56.7%. For FY2026 the company aims for record-high sales and operating income of ¥575.0B (+3%) and ¥76.0B (+3%), and plans a 13th consecutive annual dividend increase to ¥70 per share.
Note on fiscal-year labels: in this presentation Shimadzu defines “FY2025” as the fiscal year ended March 31, 2026 (FYE3/2026), and “FY2026” as the following fiscal year. This article follows the labels used in the materials.
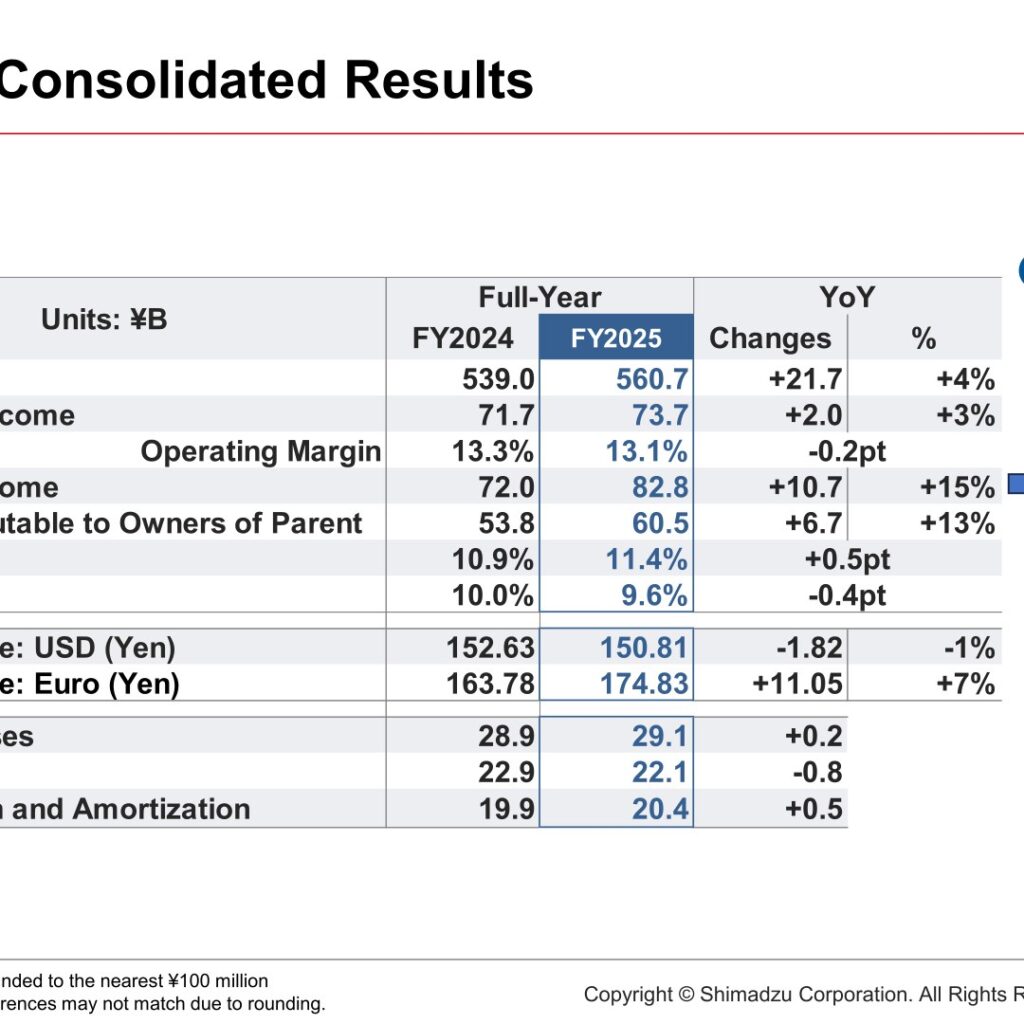
Consolidated Results (Full-Year Actual)
Net sales were ¥560.7B against ¥539.0B in FY2024, while operating income was ¥73.7B against ¥71.7B, taking the operating margin to 13.1% from 13.3%, a decline of 0.2pt. Ordinary income rose ¥10.7B to ¥82.8B, helped by an FX gain/loss of +¥9.2B, and profit attributable to owners of parent rose ¥6.7B to ¥60.5B. ROE improved to 11.4% from 10.9% (+0.5pt) while ROIC fell to 9.6% from 10.0% (-0.4pt). Average exchange rates were ¥150.81 to the US dollar (-1.82, -1%) and ¥174.83 to the euro (+11.05, +7%); the company states the FX impact on sales was +¥0.2B and on operating income -¥0.2B. Figures on this slide are rounded to the nearest ¥100 million, so totals and differences may not match.
| Item (Units: ¥B) | FY2025 | FY2024 | Change | % |
|---|---|---|---|---|
| Net Sales | 560.7 | 539.0 | +21.7 | +4% |
| Operating Income | 73.7 | 71.7 | +2.0 | +3% |
| Operating Margin | 13.1% | 13.3% | -0.2pt | — |
| Ordinary Income | 82.8 | 72.0 | +10.7 | +15% |
| Profit Attributable to Owners of Parent | 60.5 | 53.8 | +6.7 | +13% |
| ROE | 11.4% | 10.9% | +0.5pt | — |
| ROIC | 9.6% | 10.0% | -0.4pt | — |
| R&D Expenses | 29.1 | 28.9 | +0.2 | — |
| CAPEX | 22.1 | 22.9 | -0.8 | — |
| Depreciation and Amortization | 20.4 | 19.9 | +0.5 | — |
| Average Rate: USD (Yen) | 150.81 | 152.63 | -1.82 | -1% |
| Average Rate: Euro (Yen) | 174.83 | 163.78 | +11.05 | +7% |
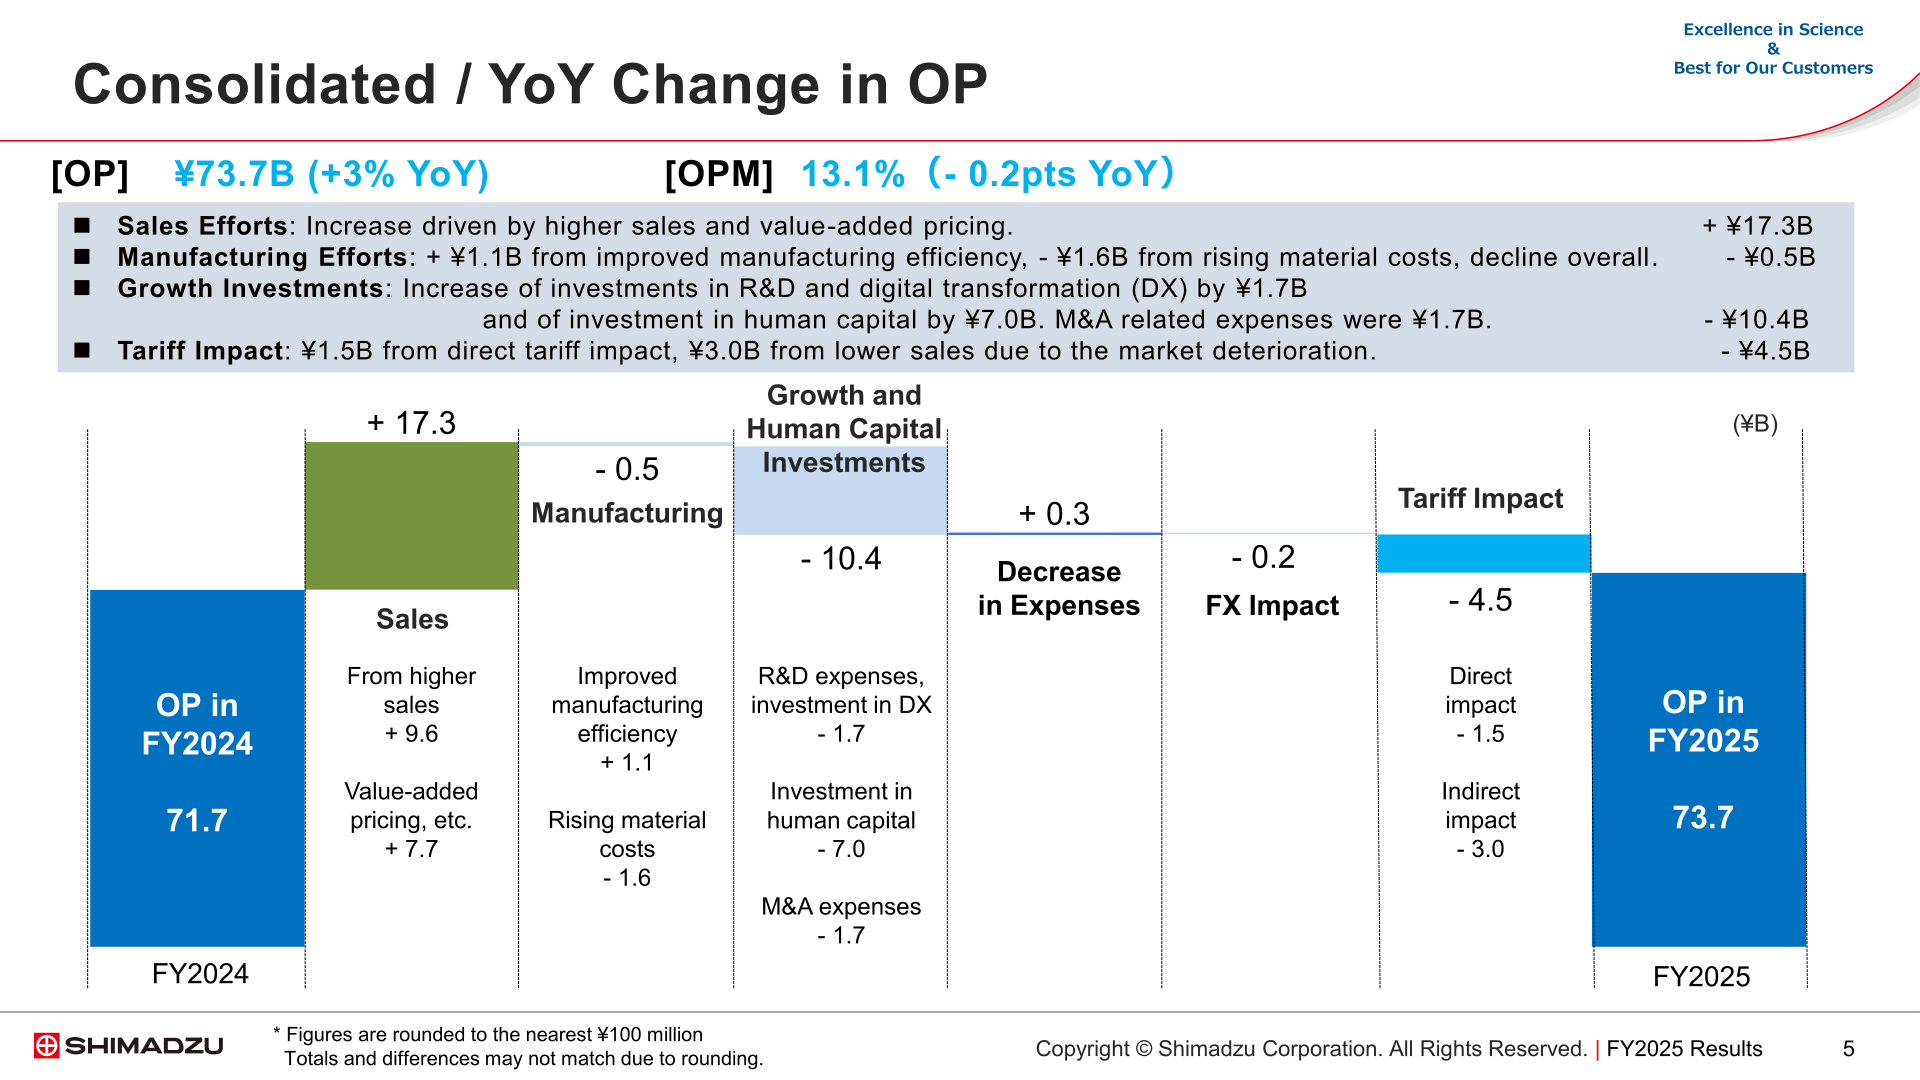
The company’s year-on-year operating income bridge from ¥71.7B to ¥73.7B shows sales efforts adding ¥17.3B (of which +¥9.6B from higher sales and +¥7.7B from value-added pricing, etc.), manufacturing efforts subtracting ¥0.5B (+¥1.1B from improved manufacturing efficiency against -¥1.6B from rising material costs), growth and human capital investments subtracting ¥10.4B (R&D expenses and investment in digital transformation -¥1.7B, investment in human capital -¥7.0B, M&A-related expenses -¥1.7B), a decrease in expenses of +¥0.3B, an FX impact of -¥0.2B, and a tariff impact of -¥4.5B made up of ¥1.5B of direct tariff impact and ¥3.0B from lower sales due to market deterioration.
Sales by Region
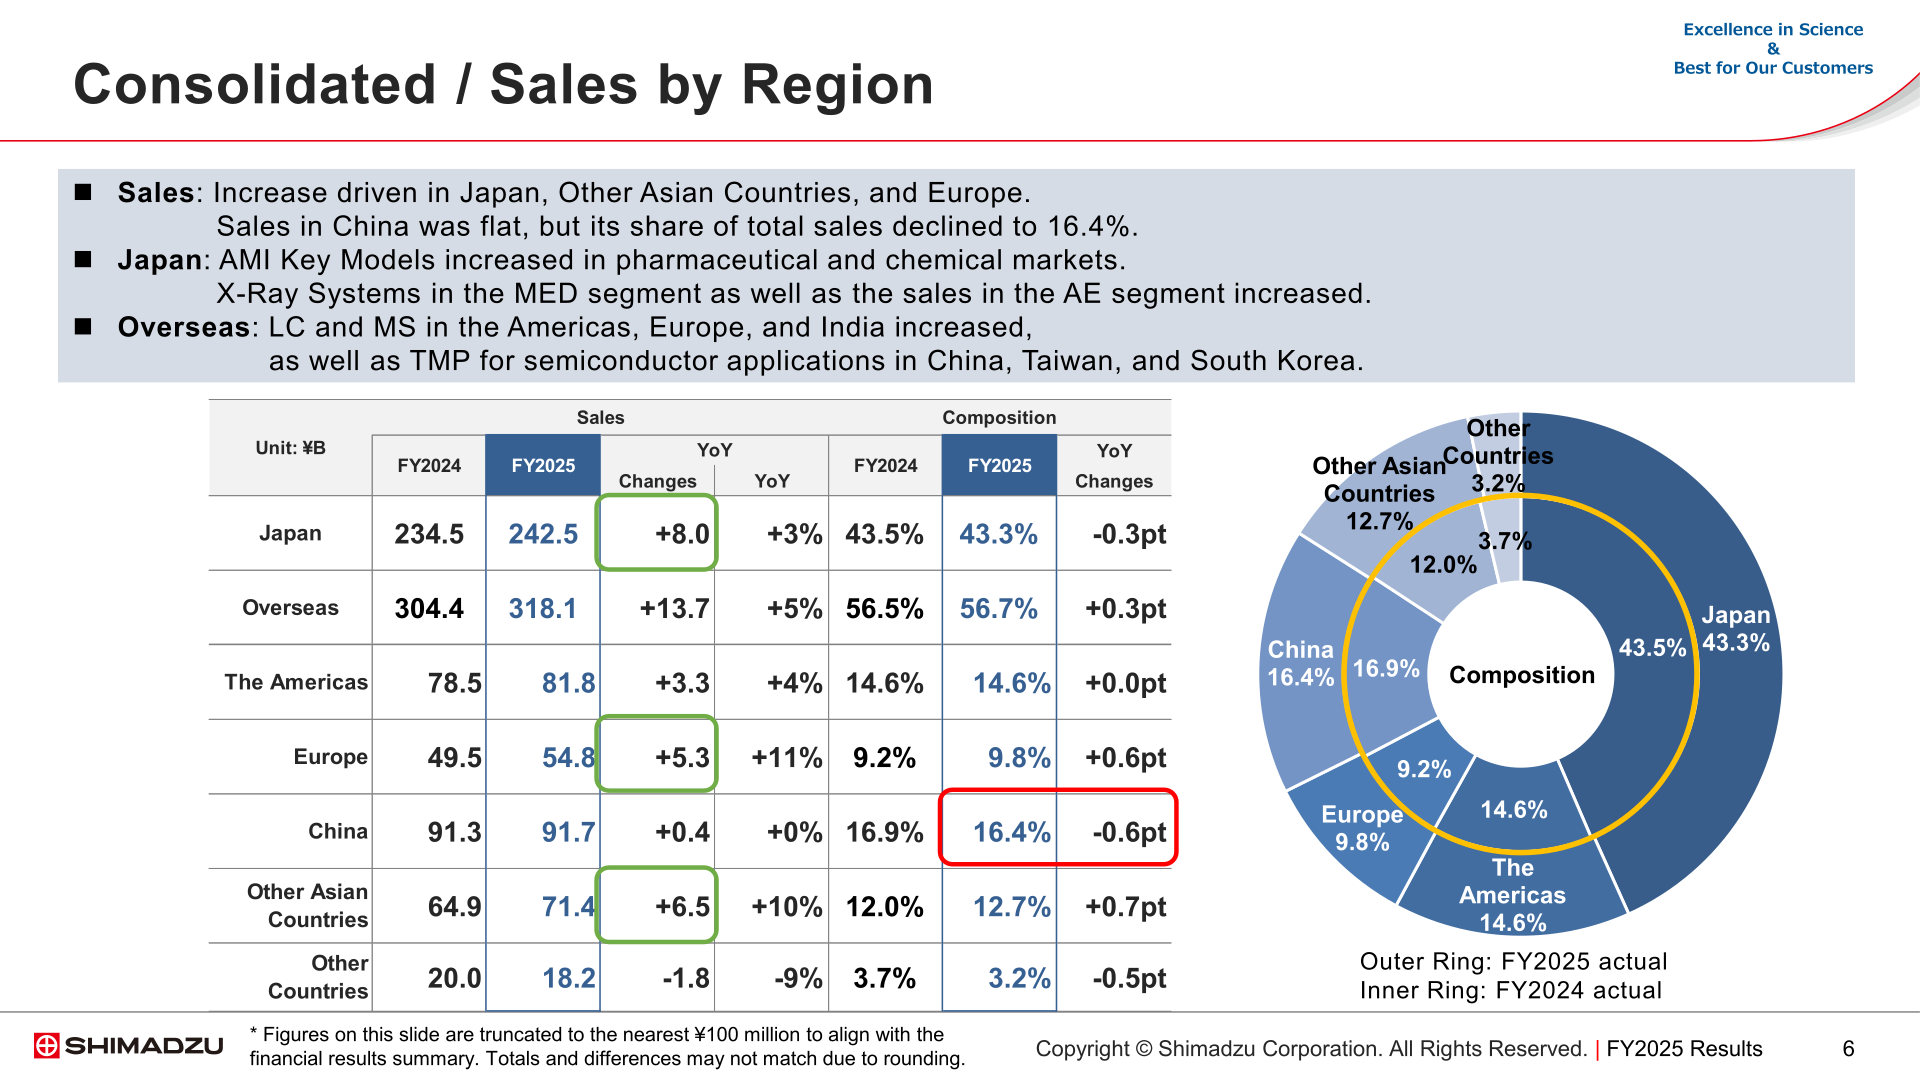
Sales increased in Japan, Other Asian Countries and Europe. Sales in China were flat, but China’s share of total sales declined to 16.4%. In Japan, AMI Key Models increased in the pharmaceutical and chemical markets, and X-Ray Systems in the MED segment as well as sales in the AE segment increased. Overseas, LC and MS grew in the Americas, Europe and India, as did TMP for semiconductor applications in China, Taiwan and South Korea. Figures on this slide are truncated to the nearest ¥100 million to align with the financial results summary.
| Region (Unit: ¥B) | FY2025 | FY2024 | Change | % | FY2025 Composition | FY2024 Composition |
|---|---|---|---|---|---|---|
| Japan | 242.5 | 234.5 | +8.0 | +3% | 43.3% | 43.5% |
| Overseas | 318.1 | 304.4 | +13.7 | +5% | 56.7% | 56.5% |
| The Americas | 81.8 | 78.5 | +3.3 | +4% | 14.6% | 14.6% |
| Europe | 54.8 | 49.5 | +5.3 | +11% | 9.8% | 9.2% |
| China | 91.7 | 91.3 | +0.4 | +0% | 16.4% | 16.9% |
| Other Asian Countries | 71.4 | 64.9 | +6.5 | +10% | 12.7% | 12.0% |
| Other Countries | 18.2 | 20.0 | -1.8 | -9% | 3.2% | 3.7% |
Segment Results
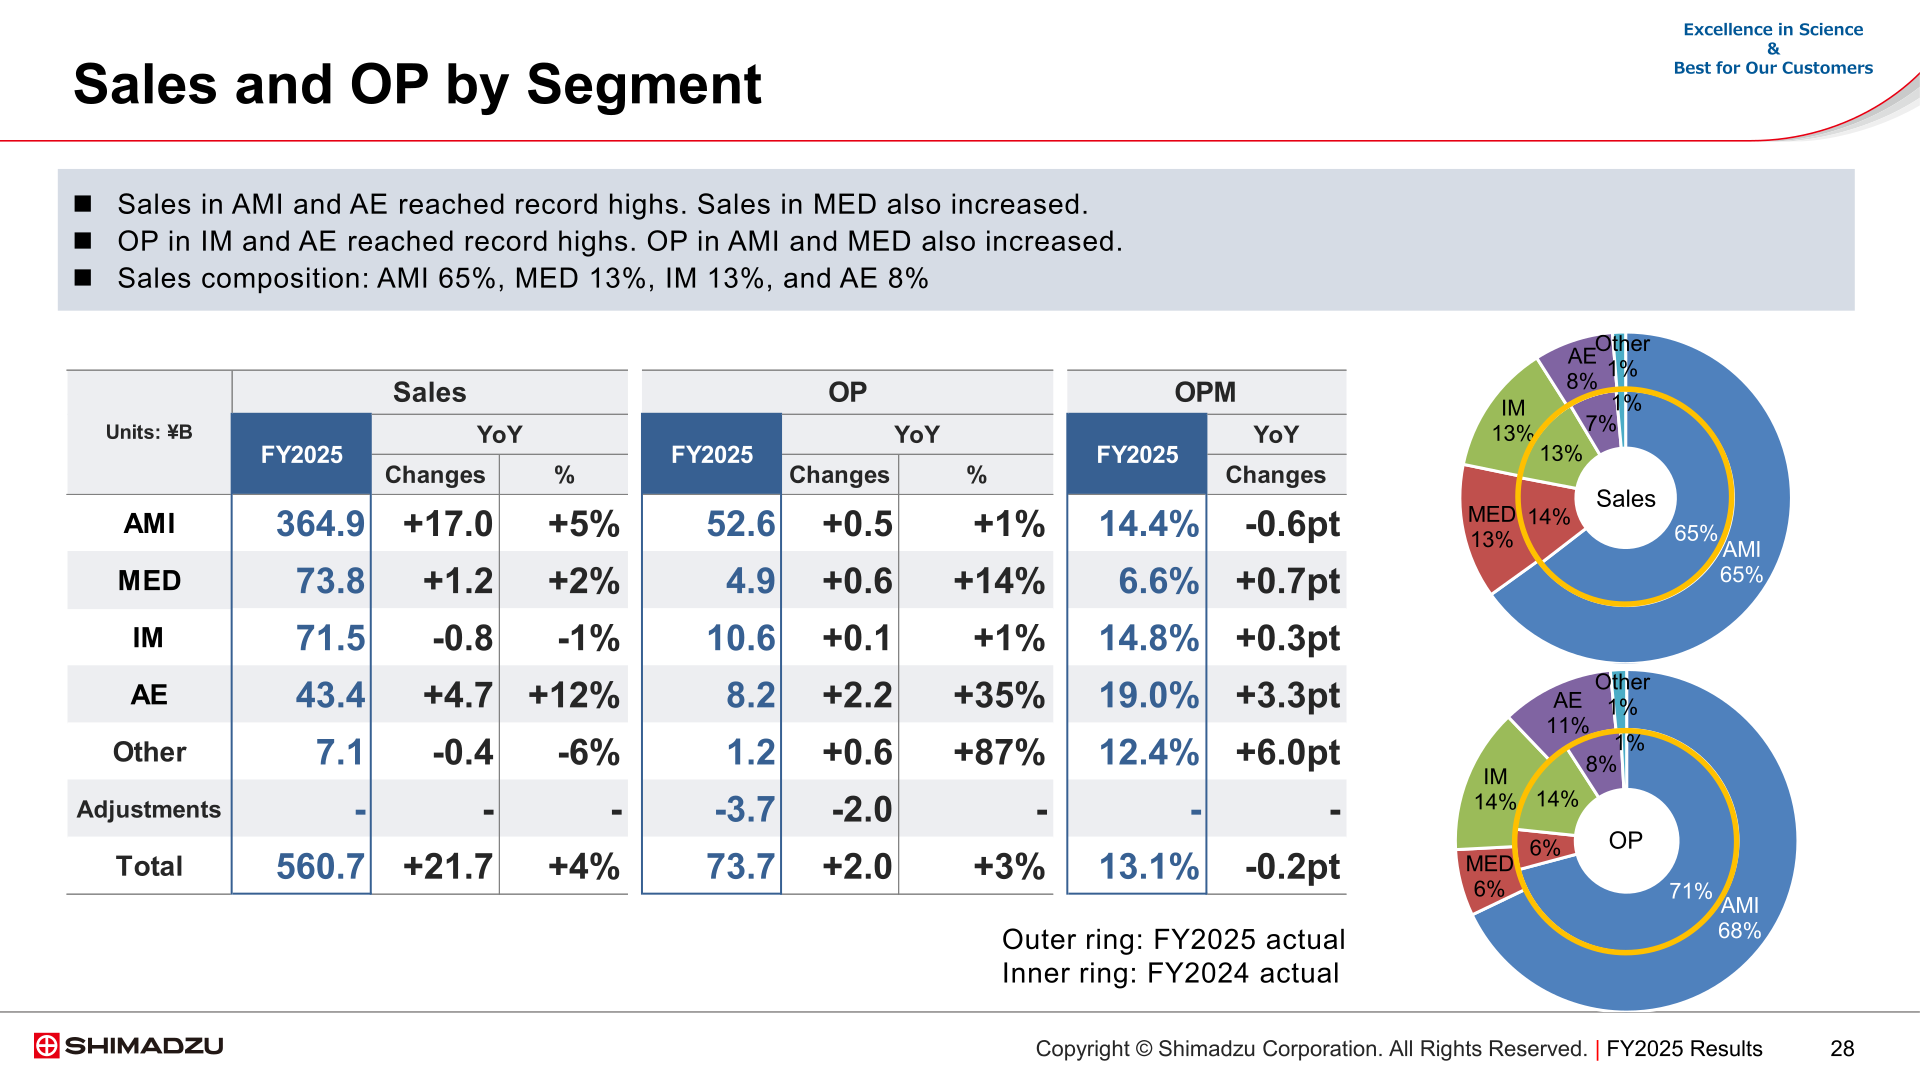
Sales in AMI (Analytical & Measuring Instruments) and AE (Aircraft Equipment) reached record highs and sales in MED (Medical Systems) also increased, while operating income in IM (Industrial Machinery) and AE reached record highs and operating income in AMI and MED also increased. The sales composition was AMI 65%, MED 13%, IM 13% and AE 8%.
| Segment (Units: ¥B) | Sales FY2025 | Sales YoY | Sales % | OP FY2025 | OP YoY | OP % | OPM FY2025 | OPM YoY |
|---|---|---|---|---|---|---|---|---|
| AMI | 364.9 | +17.0 | +5% | 52.6 | +0.5 | +1% | 14.4% | -0.6pt |
| MED | 73.8 | +1.2 | +2% | 4.9 | +0.6 | +14% | 6.6% | +0.7pt |
| IM | 71.5 | -0.8 | -1% | 10.6 | +0.1 | +1% | 14.8% | +0.3pt |
| AE | 43.4 | +4.7 | +12% | 8.2 | +2.2 | +35% | 19.0% | +3.3pt |
| Other | 7.1 | -0.4 | -6% | 1.2 | +0.6 | +87% | 12.4% | +6.0pt |
| Adjustments | – | – | – | -3.7 | -2.0 | – | – | – |
| Total | 560.7 | +21.7 | +4% | 73.7 | +2.0 | +3% | 13.1% | -0.2pt |
In AMI, sales rose from ¥347.9B to ¥364.9B and operating income from ¥52.1B to ¥52.6B, with the operating margin at 14.4% against 15.0%. Key Models (LC, MS and GC) sales were ¥203.0B against ¥190.5B in FY2024, with the company citing year-on-year growth of 7% helped by new products, while Other Models were ¥161.9B against ¥157.4B. Recurring sales were ¥142.5B, up 7% year on year, for a recurring sales ratio of 39% (+1pt). By region within AMI, Japan was ¥138.0B (+¥7.0B, +5%) and overseas ¥226.9B (+¥10.0B, +5%), comprising North America ¥42.3B (+8%), Europe ¥45.8B (+12%), China ¥67.3B (-1%), Other Asian Countries excluding India ¥30.9B (+8%) and India ¥20.9B (+8%); the AMI overseas sales ratio was 62%, flat year on year.
In MED, sales rose from ¥72.6B to ¥73.8B and operating income from ¥4.3B to ¥4.9B, lifting the operating margin to 6.6% from 5.9%. X-Ray Systems sales were ¥56.3B against ¥53.3B and Other Models ¥17.5B against ¥19.3B, and recurring sales were ¥27.9B, up 3% year on year, for a ratio of 38% (+1pt). In IM, sales fell from ¥72.3B to ¥71.5B while operating income rose from ¥10.5B to ¥10.6B and the operating margin to 14.8% from 14.5%; TMP sales were ¥37.8B, hydraulic equipment ¥15.7B and Others ¥18.0B, and TMP recurring sales were ¥9.2B for a TMP recurring sales ratio of 24% (+4pts). In AE, sales rose from ¥38.7B to ¥43.4B and operating income from ¥6.1B to ¥8.2B, taking the operating margin to 19.0% from 15.7%; Defense sales were ¥34.7B and Commercial Aircraft sales ¥8.7B, and the company states sales hit a record high for the second consecutive fiscal year and operating income for the third consecutive fiscal year.
FY2026 Forecast
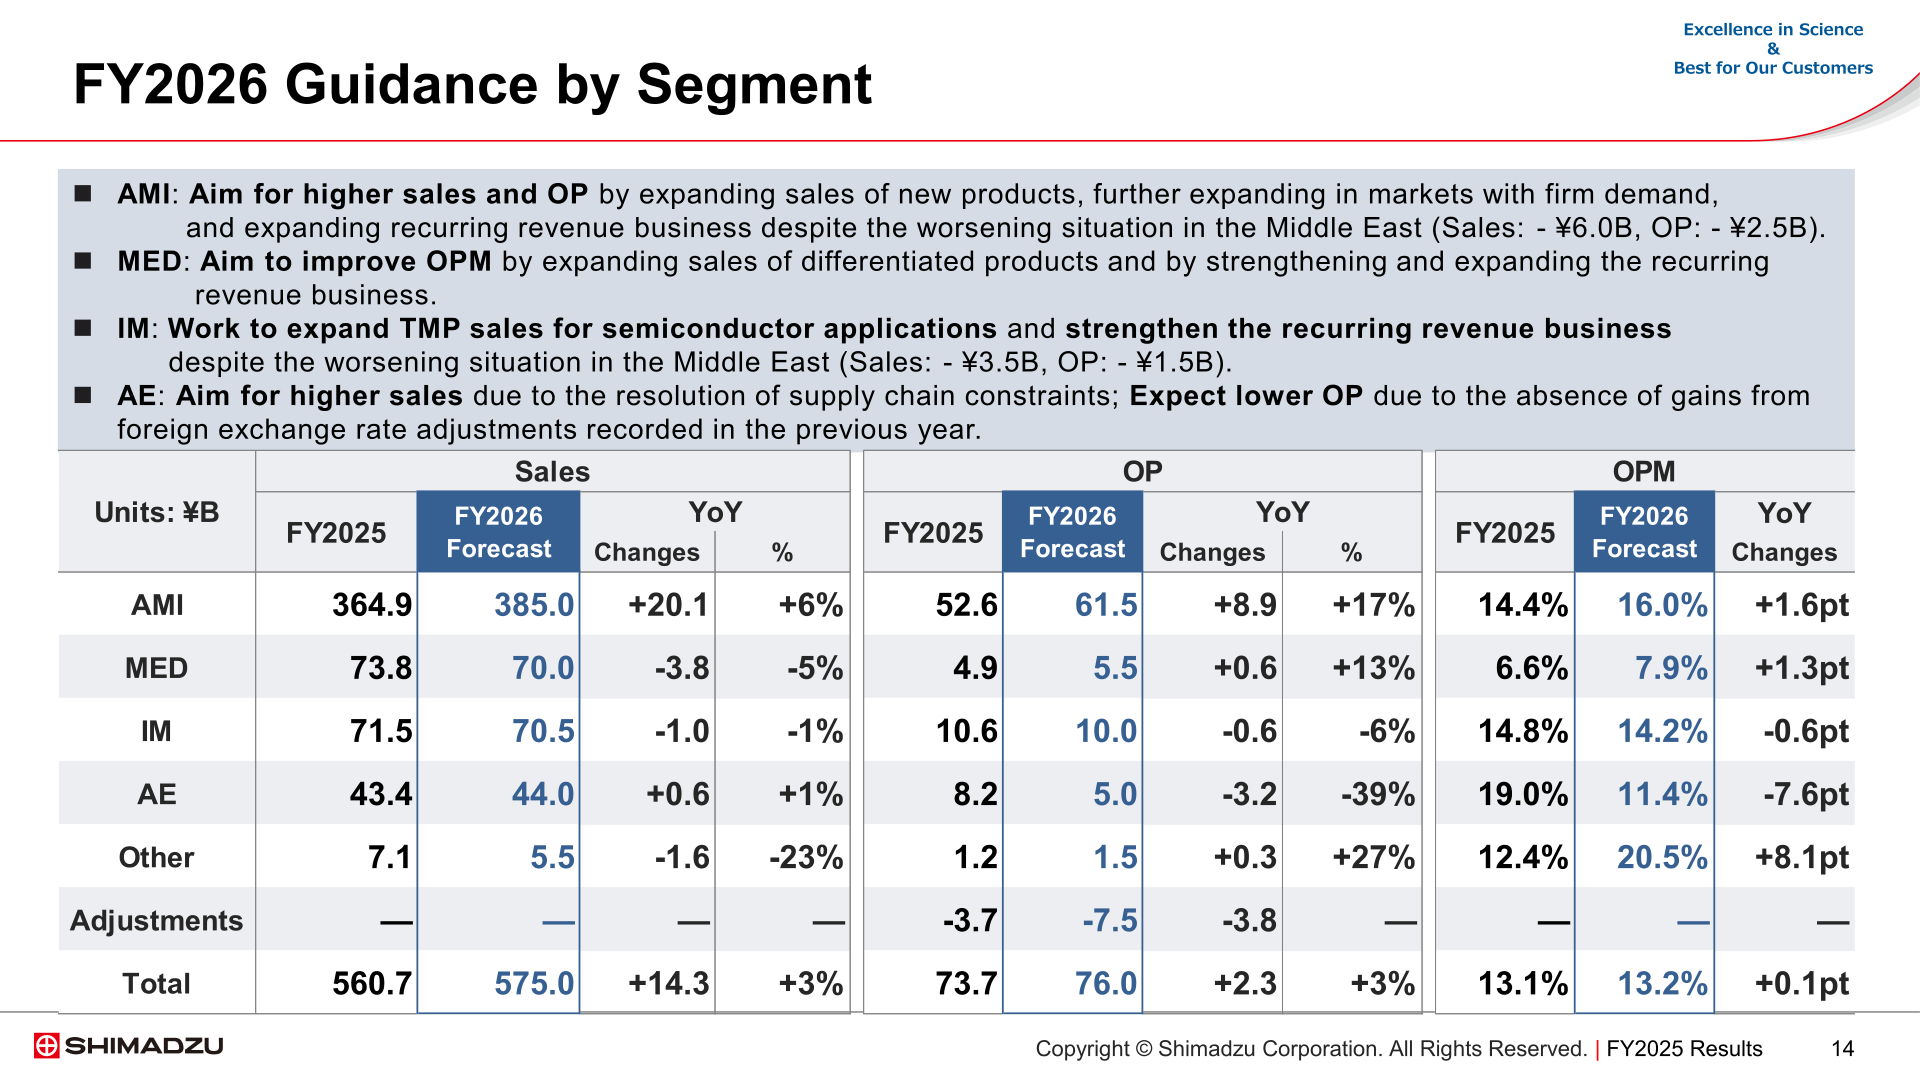
For FY2026 Shimadzu guides to sales of ¥575.0B (+¥14.3B, +3%), operating income of ¥76.0B (+¥2.3B, +3%), ordinary income of ¥75.0B (-¥7.8B, -9%) and net profit of ¥55.0B (-¥5.5B, -9%). The sales guidance includes an FX impact of -¥2.0B and a Middle East-related impact of -¥10.0B, and the operating income guidance includes an FX impact of -¥0.7B and a Middle East-related impact of -¥4.0B. Assumed exchange rates are ¥150 to 1 USD and ¥175 to 1 EUR, against ¥150.8 and ¥174.8 in FY2025. R&D expenses are planned at ¥30.5B (+1.4), CAPEX at ¥25.0B (+2.9) and depreciation and amortization at ¥20.0B (-0.4). Tescan’s performance is not included in the guidance, as the closing of the transaction has not yet completed.
| Segment (Units: ¥B) | Sales FY2026 Forecast | Sales YoY | Sales % | OP FY2026 Forecast | OP YoY | OP % | OPM FY2026 Forecast | OPM YoY |
|---|---|---|---|---|---|---|---|---|
| AMI | 385.0 | +20.1 | +6% | 61.5 | +8.9 | +17% | 16.0% | +1.6pt |
| MED | 70.0 | -3.8 | -5% | 5.5 | +0.6 | +13% | 7.9% | +1.3pt |
| IM | 70.5 | -1.0 | -1% | 10.0 | -0.6 | -6% | 14.2% | -0.6pt |
| AE | 44.0 | +0.6 | +1% | 5.0 | -3.2 | -39% | 11.4% | -7.6pt |
| Other | 5.5 | -1.6 | -23% | 1.5 | +0.3 | +27% | 20.5% | +8.1pt |
| Adjustments | — | — | — | -7.5 | -3.8 | — | — | — |
| Total | 575.0 | +14.3 | +3% | 76.0 | +2.3 | +3% | 13.2% | +0.1pt |
By segment, AMI aims for higher sales and operating income by expanding sales of new products, further expanding in markets with firm demand and expanding the recurring revenue business, despite a Middle East-related impact of -¥6.0B on sales and -¥2.5B on operating income. MED aims to improve its operating margin by expanding sales of differentiated products and by strengthening and expanding the recurring revenue business. IM will work to expand TMP sales for semiconductor applications and strengthen the recurring revenue business, despite a Middle East-related impact of -¥3.5B on sales and -¥1.5B on operating income. AE aims for higher sales due to the resolution of supply chain constraints but expects lower operating income due to the absence of gains from foreign exchange rate adjustments recorded in the previous year.
Shareholder Returns
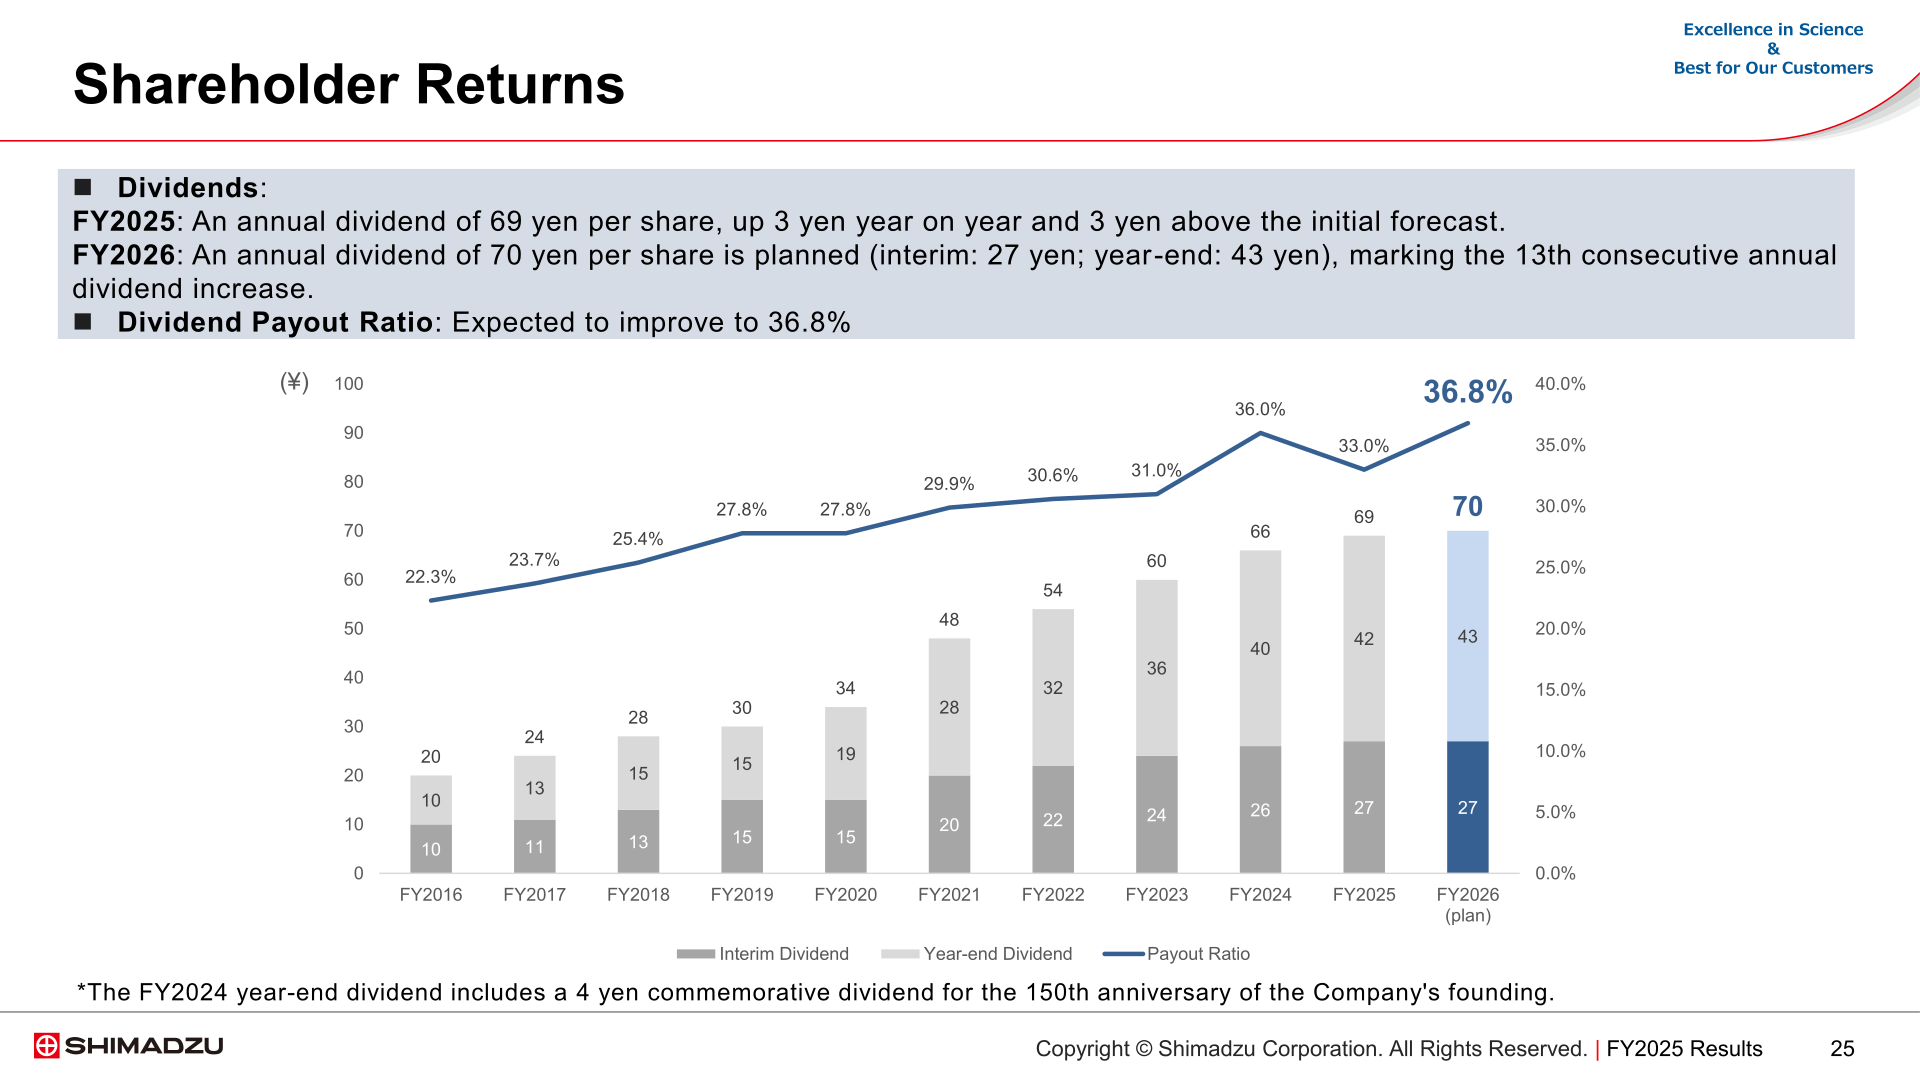
For FY2025 the company set an annual dividend of ¥69 per share, up ¥3 year on year and ¥3 above the initial forecast. For FY2026 an annual dividend of ¥70 per share is planned, comprising an interim dividend of ¥27 and a year-end dividend of ¥43, marking the 13th consecutive annual dividend increase. The dividend payout ratio is expected to improve to 36.8%. The company notes that the FY2024 year-end dividend included a ¥4 commemorative dividend for the 150th anniversary of its founding.
| Item (¥ per share) | FY2026 (plan) | FY2025 | FY2024 |
|---|---|---|---|
| Interim Dividend | 27 | 27 | 26 |
| Year-end Dividend | 43 | 42 | 40 |
| Annual Dividend | 70 | 69 | 66 |
| Payout Ratio | 36.8% | 33.0% | 36.0% |
Financial Position
Total assets as of the end of March 2026 were ¥738.0B, up ¥65.8B from the end of March 2025. Current assets rose ¥43.3B to ¥497.7B on an increase in cash and deposits of ¥23.9B and higher inventories of ¥8.7B associated with increased demand, while investments and other assets rose ¥19.1B to ¥93.5B, including a ¥13.2B increase in retirement benefit assets and a ¥5.2B increase in investment securities. Property, plant and equipment was ¥122.8B (+3.3) and intangible assets ¥23.9B (+0.1). Current liabilities decreased ¥1.0B to ¥150.2B and non-current liabilities were ¥22.6B (-0.3), while net assets increased ¥67.1B to ¥565.2B, including a ¥40.9B increase in retained earnings and a ¥15.3B increase in foreign currency translation adjustment. The equity ratio was 76.6%, up 2.5pts.
Topics: Market Environment and New Products
For FY2026 the company projects year-on-year growth in consolidated sales excluding FX impact of +1 to 3% in Japan, +4 to 6% in North America, +4 to 6% in Europe, +1 to 3% in China and +4 to 6% in Other Asian Countries, of which India is expected at +7 to 9%. Across regions it cites solid demand for analytical and measuring instruments, a firm semiconductor market, investment related to PFAS regulations for drinking water, and a significant increase in production of semiconductor production equipment, while academia and government markets in North America are expected to remain sluggish and market conditions for Medical Systems in Japan remain soft.
Key new products and solutions to be rolled out include the integrated liquid chromatograph i-Series LC-2070/2080 and the ultra high performance liquid chromatograph Nexera X4 for the life science market; the Nexera CL LCMS System, the high-throughput LCMS system Nexera QX, the CLAM-2030CL fully automated sample preparation module, DOSIMMUNE testing reagents and the MicrobialTrack microbial identification software for the MedTech and molecular diagnosis markets; the MobileDaRt Evolution MX9 Version, RADspeed Pro SR5 Version, RADspeed Pro XF type and the Trinias Series with SCORE Opera in imaging diagnosis; the LCMS-8065XE, the ion chromatograph Nexera IC and the gas chromatograph Nexis GC-2060 for environmental analysis and GX-related markets; and the inspeXio 7000 industrial microfocus X-ray CT system, the SUPERSCAN Series scanning electron microscope co-branded with TESCAN of the Czech Republic, and the TOC-1000e S online TOC analyzer for the battery and semiconductor markets. In AMI the company plans to expand recurring revenue through higher value-added repair and maintenance services, enhanced MVS proposal capabilities through collaboration with Zef Scientific, Inc., an expanded overseas calibration business for testing machines, and OEM sales of YMC’s consumables in ASEAN.
This article is an analysis based on publicly available information and is not a recommendation to buy or sell any specific securities. Investment decisions are your own responsibility.
![[Obayashi] Investors’ Guide 2026 — The Complete 24-Article Breakdown](https://japan-equity.com/wp-content/uploads/2026/07/hub_cover-1024x1024.png)
![[Obayashi] IR & SR Policy — Feeding Dialogue Back into Management](https://japan-equity.com/wp-content/uploads/2026/07/p32_sq-1024x1024.jpg)
![[Obayashi] Real Estate Development — 18.7% Margin, ¥287.7bn Unrealized Gains](https://japan-equity.com/wp-content/uploads/2026/07/p20_sq-1024x1024.jpg)
![[Obayashi] Domestic Civil Engineering — Resilience Spending Supports 9.6% Margin](https://japan-equity.com/wp-content/uploads/2026/07/p11_sq-1024x1024.jpg)
![[Obayashi] Share Price & External Ratings — vs TOPIX, ESG Index Inclusion](https://japan-equity.com/wp-content/uploads/2026/07/p40_sq-1024x1024.jpg)
![[Construction] ¥75.5tn Investment, Shrinking Workforce — Big-5 Market Share](https://japan-equity.com/wp-content/uploads/2026/07/p12_sq-1024x1024.jpg)



![[Obayashi] Capital Policy & Shareholder Returns — ROE 10%+, DOE ~5%, ¥100bn Buyback](https://japan-equity.com/wp-content/uploads/2026/07/p27_sq-1024x1024.jpg)
![[Obayashi] Reducing Cross-Shareholdings — ¥285.2bn Sold in Five Years](https://japan-equity.com/wp-content/uploads/2026/07/p29_sq-1024x1024.jpg)
![[Obayashi] ¥750bn Investment Plan — ¥300bn to Development, ¥190bn to Tech/DX](https://japan-equity.com/wp-content/uploads/2026/07/p30_sq-1024x1024.jpg)
![[Obayashi] MTP2022 KPIs — Operating Profit ~2x Target, ROE 14.4%](https://japan-equity.com/wp-content/uploads/2026/07/p25_sq-1024x1024.jpg)
![[Obayashi] Cash Allocation — ¥420bn Investment CF Over Five Years](https://japan-equity.com/wp-content/uploads/2026/07/p26_sq-1024x1024.jpg)
![[Obayashi] Green Energy — 44 Plants, 344MW, and the Green Hydrogen Challenge](https://japan-equity.com/wp-content/uploads/2026/07/p21_sq-1024x1024.jpg)
![[Obayashi] Tackling the Labor Shortage — Robotics Construction®](https://japan-equity.com/wp-content/uploads/2026/07/p14_sq-1024x1024.jpg)
