
This article is based on publicly available IR materials and is not a recommendation to buy or sell any specific securities.
Hirogin Holdings, the holding company of Hiroshima Bank, reported net income attributable to owners of the parent of 43.7 billion yen for FY2025 (the fiscal year ended March 31, 2026), up 7.9 billion yen or 22.0% year on year and a record high for the second consecutive year. Consolidated ROE rose 1.3 points year on year to 8.2%. At Hiroshima Bank, net income from core businesses (excluding gains/losses from cancellation of investment trusts) grew 14.7 billion yen year on year to 63.7 billion yen and net income grew 7.4 billion yen to 40.3 billion yen, both record highs. For FY2026 the company projects net income attributable to owners of the parent of 51.0 billion yen, which would be a record high for the third consecutive year.
Consolidated Results (Full-Year Actual)
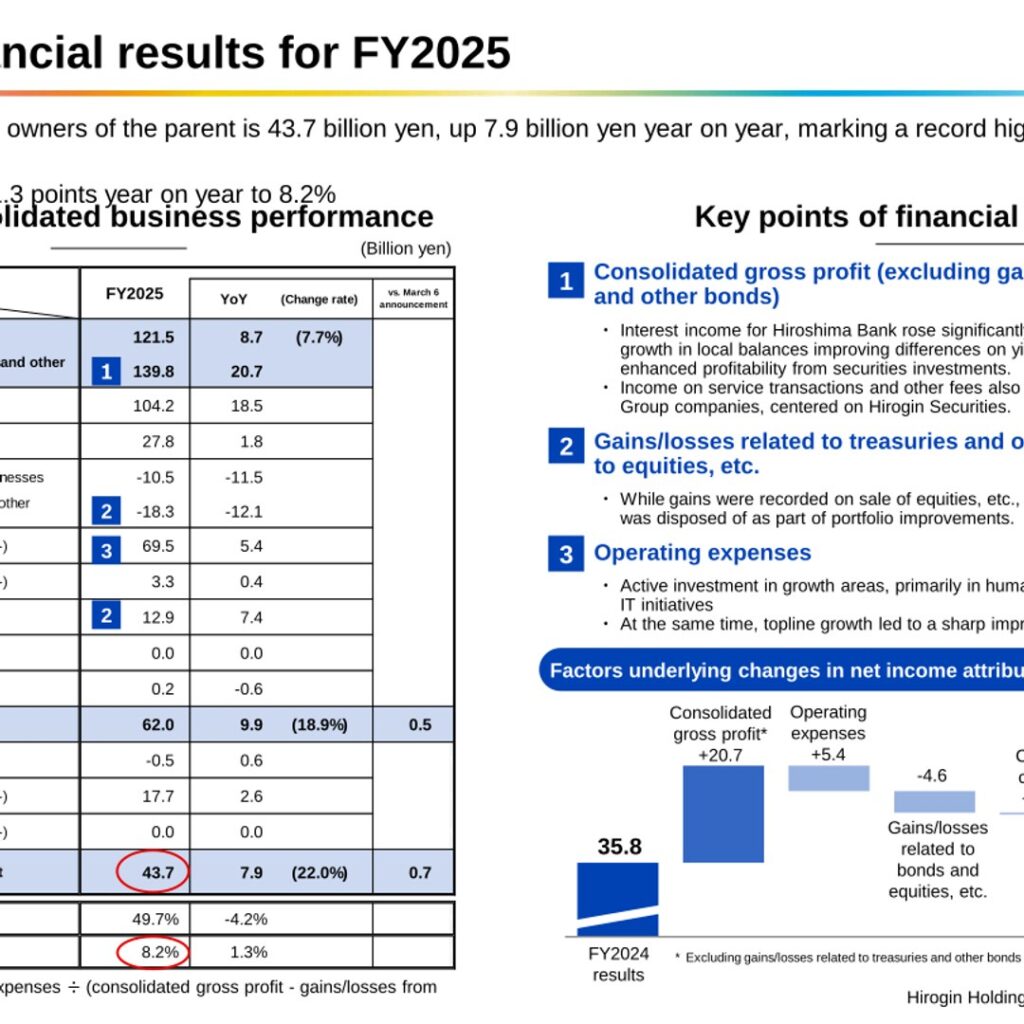
Consolidated gross profit was 121.5 billion yen, up 8.7 billion yen (7.7%) year on year. Excluding gains/losses related to treasuries and other bonds, consolidated gross profit was 139.8 billion yen, up 20.7 billion yen. The company attributes the increase to a significant rise in interest income at Hiroshima Bank, driven by higher loan interest from growth in local balances, improving differences on yields between deposits and loans, and enhanced profitability from securities investments, as well as to growth in income on service transactions and other fees helped by higher earnings at Group companies centered on Hirogin Securities. Ordinary profit rose 9.9 billion yen (18.9%) to 62.0 billion yen and net income attributable to owners of the parent rose 7.9 billion yen (22.0%) to 43.7 billion yen. Both figures exceeded the March 6 announcement, by 0.5 billion yen and 0.7 billion yen respectively. Credit costs were 3.3 billion yen, up 0.4 billion yen year on year, and the operating overhead ratio improved 4.2 points to 49.7%.
| Item (Billion yen) | FY2025 | YoY | (Change rate) |
|---|---|---|---|
| Consolidated gross profit | 121.5 | 8.7 | (7.7%) |
| (excluding gains/losses related to treasuries and other bonds) | 139.8 | 20.7 | |
| Net interest income | 104.2 | 18.5 | |
| Income on service transactions and other fees | 27.8 | 1.8 | |
| Income from specific transactions and other businesses | -10.5 | -11.5 | |
| (including gains/losses related to treasuries and other bonds) | -18.3 | -12.1 | |
| Operating expenses (-) | 69.5 | 5.4 | |
| Credit costs (-) | 3.3 | 0.4 | |
| Gains/losses related to equities, etc. | 12.9 | 7.4 | |
| Equity in earnings of affiliates | 0.0 | 0.0 | |
| Other | 0.2 | -0.6 | |
| Ordinary profit | 62.0 | 9.9 | (18.9%) |
| Extraordinary gains/losses | -0.5 | 0.6 | |
| Total income tax, etc. (-) | 17.7 | 2.6 | |
| Net income attributable to non-controlling interests (-) | 0.0 | 0.0 | |
| Net income attributable to owners of the parent | 43.7 | 7.9 | (22.0%) |
| Operating overhead ratio | 49.7% | -4.2% | |
| Consolidated ROE | 8.2% | 1.3% |
On the changes in net income attributable to owners of the parent, the materials show consolidated gross profit (excluding gains/losses related to treasuries and other bonds) contributing +20.7 billion yen and credit costs +0.4 billion yen, against operating expenses of +5.4 billion yen, gains/losses related to bonds and equities, etc. of -4.6 billion yen and other items (tax expenses, etc.) of -2.4 billion yen, taking the result from 35.8 billion yen in FY2024 to 43.7 billion yen. The company notes that while gains were recorded on sale of equities, etc., approximately 300 billion yen in low-yield bonds was disposed of as part of portfolio improvements, and that it invested actively in growth areas, primarily human capital, digital transformation (DX) and IT initiatives.
Hiroshima Bank (Nonconsolidated)
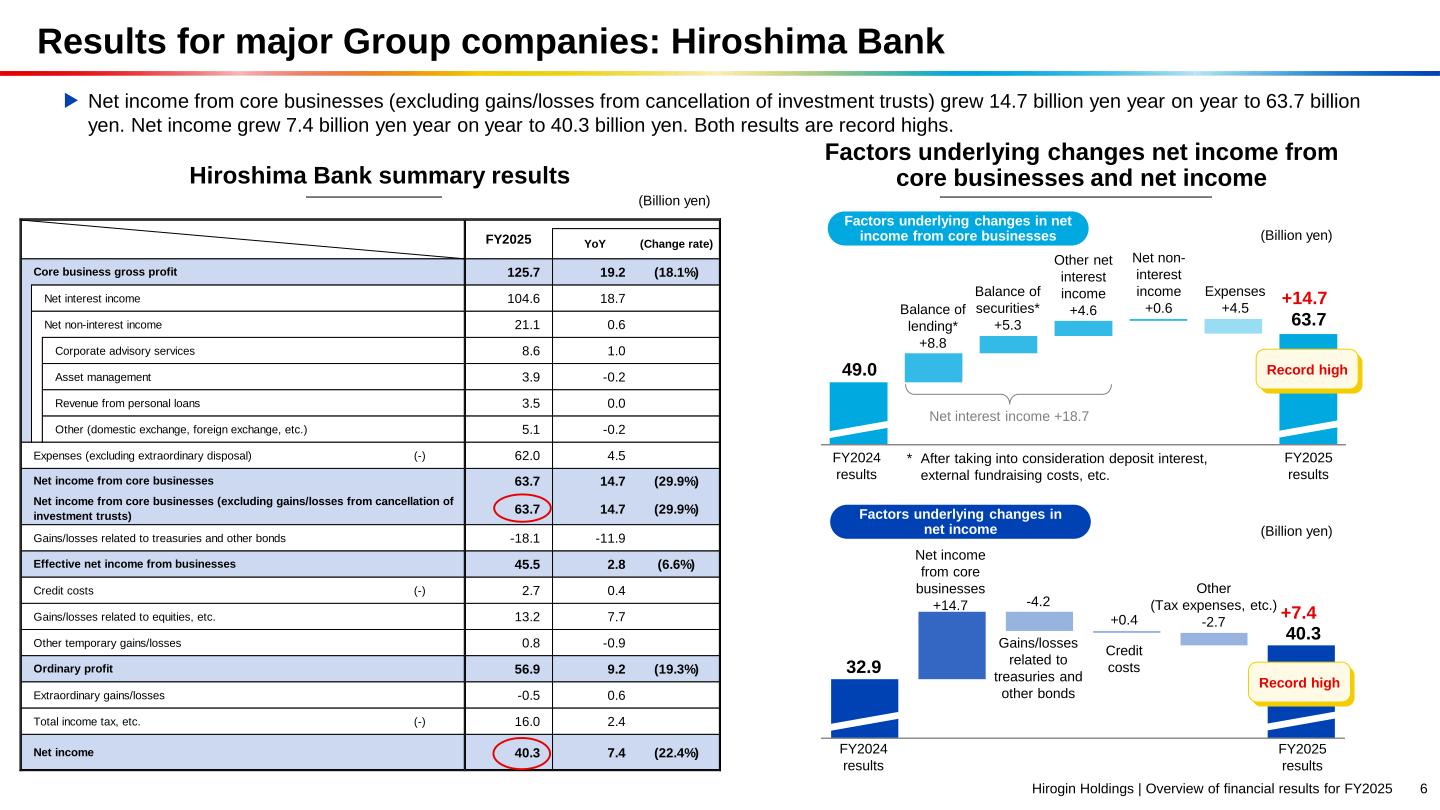
At Hiroshima Bank, core business gross profit rose 19.2 billion yen (18.1%) to 125.7 billion yen, with net interest income up 18.7 billion yen to 104.6 billion yen and net non-interest income up 0.6 billion yen to 21.1 billion yen. Expenses (excluding extraordinary disposal) were 62.0 billion yen, up 4.5 billion yen. Net income from core businesses rose 14.7 billion yen (29.9%) to 63.7 billion yen, ordinary profit rose 9.2 billion yen (19.3%) to 56.9 billion yen and net income rose 7.4 billion yen (22.4%) to 40.3 billion yen. The bank breaks down the 14.7 billion yen increase in net income from core businesses into balance of lending +8.8 billion yen, balance of securities +5.3 billion yen, other net interest income +4.6 billion yen, net non-interest income +0.6 billion yen and expenses +4.5 billion yen.
| Hiroshima Bank (Billion yen) | FY2025 | YoY | (Change rate) |
|---|---|---|---|
| Core business gross profit | 125.7 | 19.2 | (18.1%) |
| Net interest income | 104.6 | 18.7 | |
| Net non-interest income | 21.1 | 0.6 | |
| Corporate advisory services | 8.6 | 1.0 | |
| Asset management | 3.9 | -0.2 | |
| Revenue from personal loans | 3.5 | 0.0 | |
| Other (domestic exchange, foreign exchange, etc.) | 5.1 | -0.2 | |
| Expenses (excluding extraordinary disposal) (-) | 62.0 | 4.5 | |
| Net income from core businesses | 63.7 | 14.7 | (29.9%) |
| Net income from core businesses (excluding gains/losses from cancellation of investment trusts) | 63.7 | 14.7 | (29.9%) |
| Gains/losses related to treasuries and other bonds | -18.1 | -11.9 | |
| Effective net income from businesses | 45.5 | 2.8 | (6.6%) |
| Credit costs (-) | 2.7 | 0.4 | |
| Gains/losses related to equities, etc. | 13.2 | 7.7 | |
| Other temporary gains/losses | 0.8 | -0.9 | |
| Ordinary profit | 56.9 | 9.2 | (19.3%) |
| Extraordinary gains/losses | -0.5 | 0.6 | |
| Total income tax, etc. (-) | 16.0 | 2.4 | |
| Net income | 40.3 | 7.4 | (22.4%) |
Group Company Results (Excluding Hiroshima Bank)
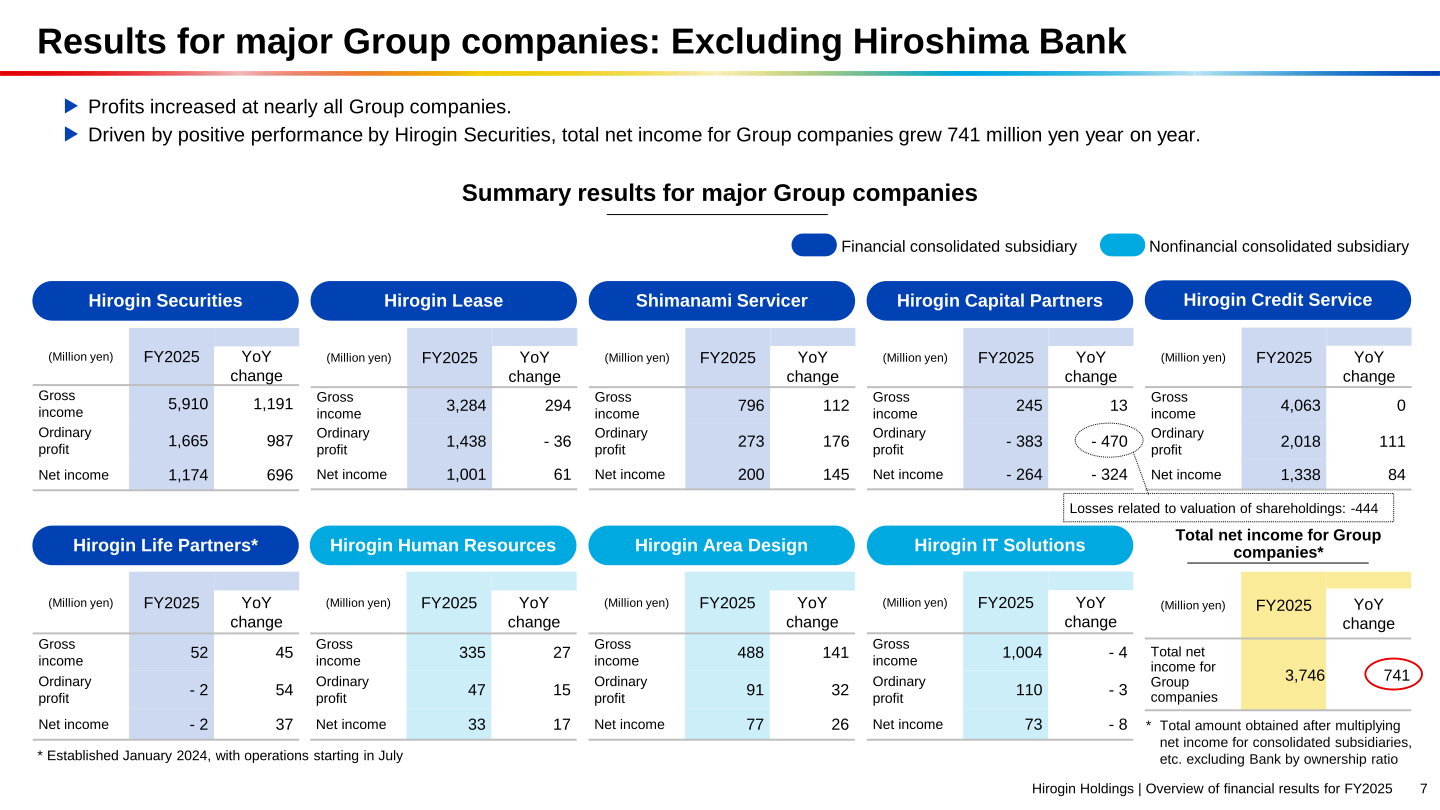
The company reports that profits increased at nearly all Group companies and that, driven by positive performance by Hirogin Securities, total net income for Group companies grew 741 million yen year on year to 3,746 million yen. Hirogin Securities posted gross income of 5,910 million yen and net income of 1,174 million yen, up 696 million yen. Hirogin Capital Partners recorded an ordinary loss of 383 million yen and a net loss of 264 million yen, with losses related to valuation of shareholdings of -444 million yen noted in the materials. Total net income for Group companies is the total amount obtained after multiplying net income for consolidated subsidiaries, etc. excluding the Bank by ownership ratio.
FY2026 Forecast
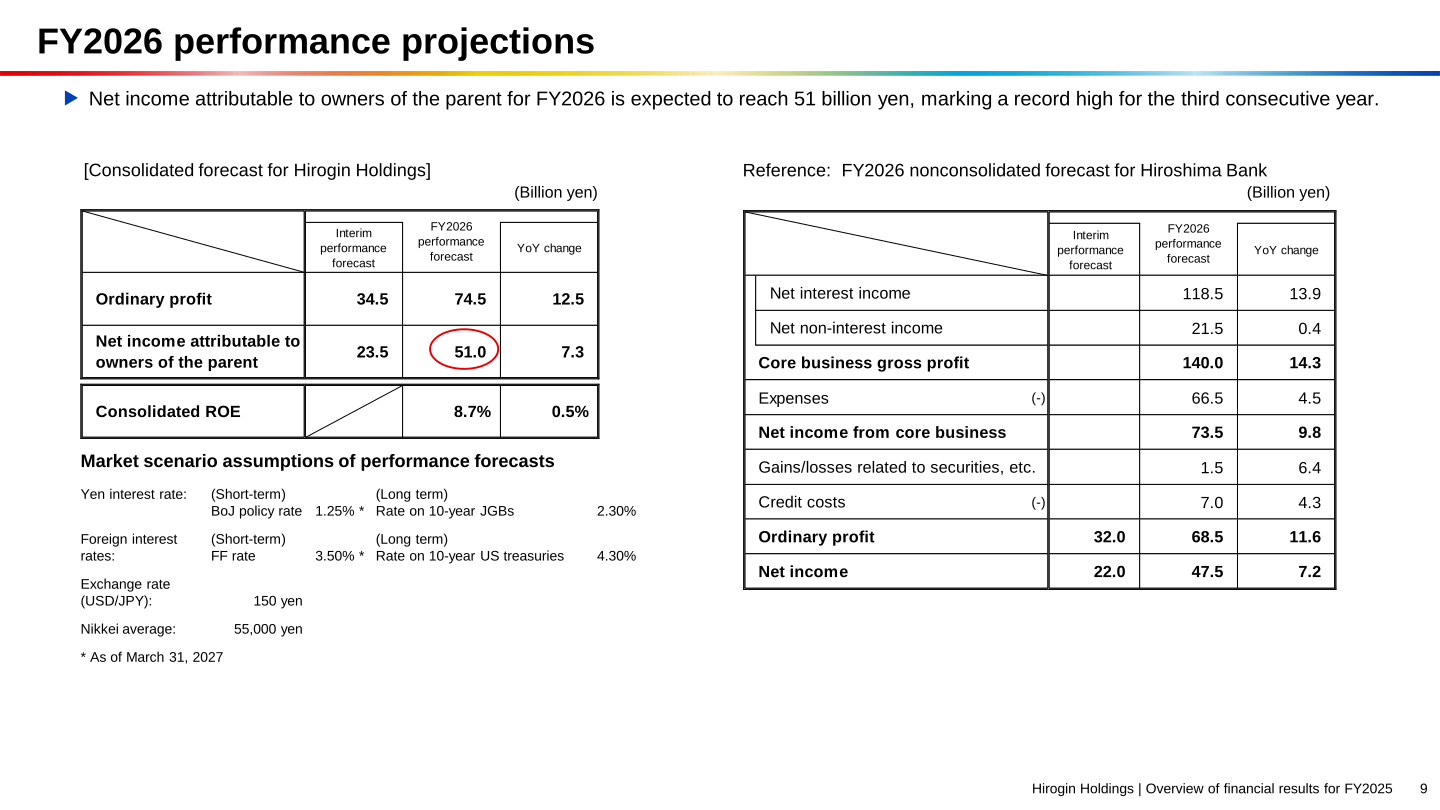
For FY2026, Hirogin Holdings forecasts consolidated ordinary profit of 74.5 billion yen, up 12.5 billion yen year on year, and net income attributable to owners of the parent of 51.0 billion yen, up 7.3 billion yen, which the company describes as a record high for the third consecutive year. Consolidated ROE is projected at 8.7%, up 0.5 points. The interim forecast is ordinary profit of 34.5 billion yen and net income of 23.5 billion yen. On a nonconsolidated basis, Hiroshima Bank forecasts core business gross profit of 140.0 billion yen, net income from core business of 73.5 billion yen, ordinary profit of 68.5 billion yen and net income of 47.5 billion yen, with credit costs of 7.0 billion yen (up 4.3 billion yen). The market scenario assumptions behind these forecasts are a BoJ policy rate of 1.25% and a rate on 10-year JGBs of 2.30%, an FF rate of 3.50% and a rate on 10-year US treasuries of 4.30% (short-term rates as of March 31, 2027), an exchange rate of 150 yen to the US dollar and a Nikkei average of 55,000 yen.
| Item (Billion yen) | Interim forecast | FY2026 forecast | YoY change |
|---|---|---|---|
| Ordinary profit (consolidated) | 34.5 | 74.5 | 12.5 |
| Net income attributable to owners of the parent | 23.5 | 51.0 | 7.3 |
| Consolidated ROE | 8.7% | 0.5% | |
| Hiroshima Bank: Net interest income | 118.5 | 13.9 | |
| Hiroshima Bank: Net non-interest income | 21.5 | 0.4 | |
| Hiroshima Bank: Core business gross profit | 140.0 | 14.3 | |
| Hiroshima Bank: Expenses (-) | 66.5 | 4.5 | |
| Hiroshima Bank: Net income from core business | 73.5 | 9.8 | |
| Hiroshima Bank: Gains/losses related to securities, etc. | 1.5 | 6.4 | |
| Hiroshima Bank: Credit costs (-) | 7.0 | 4.3 | |
| Hiroshima Bank: Ordinary profit | 32.0 | 68.5 | 11.6 |
| Hiroshima Bank: Net income | 22.0 | 47.5 | 7.2 |
Shareholder Returns
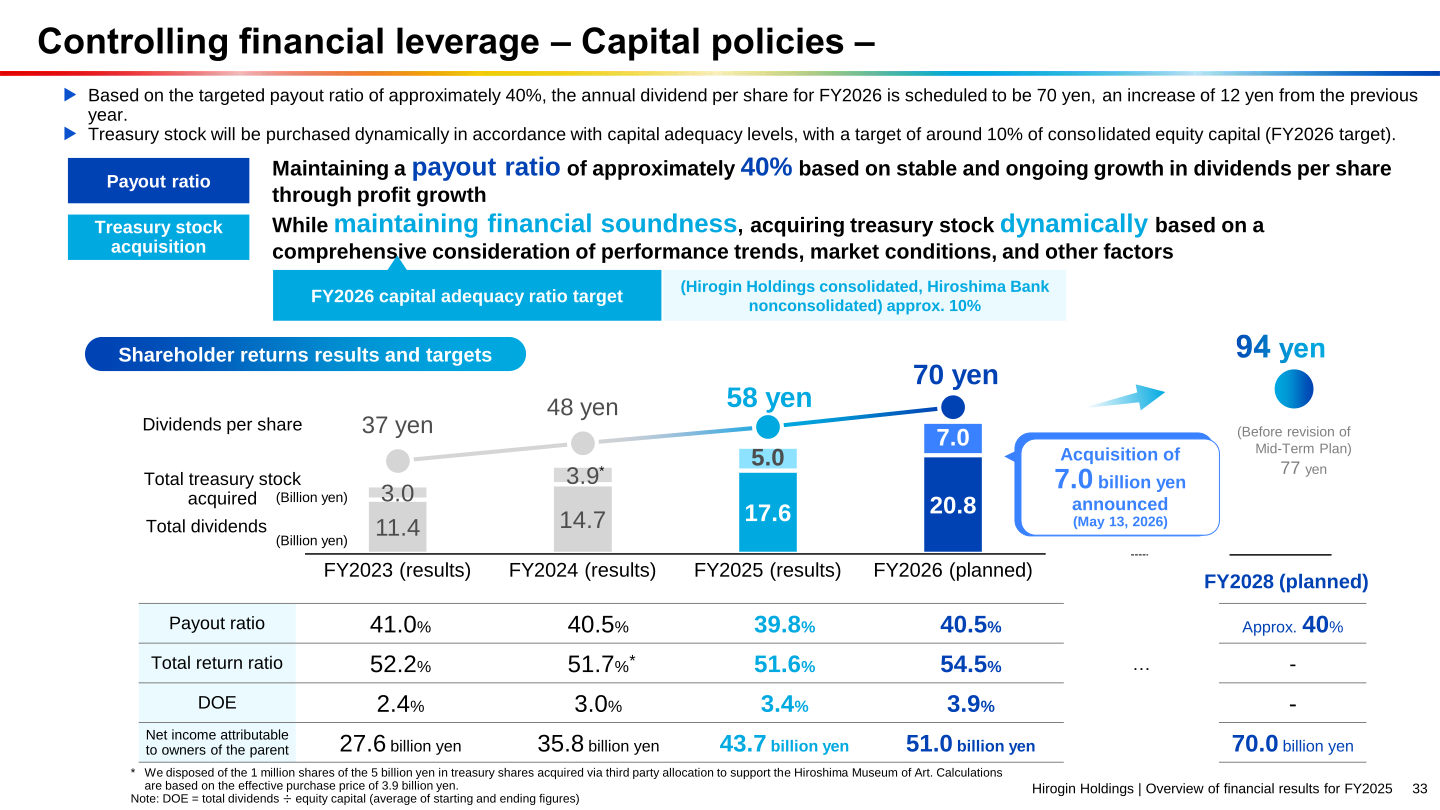
The company maintains a targeted payout ratio of approximately 40% based on stable and ongoing growth in dividends per share through profit growth. The annual dividend per share for FY2026 is scheduled to be 70 yen, an increase of 12 yen from the previous year, following 58 yen in FY2025. Treasury stock will be purchased dynamically in accordance with capital adequacy levels, with a target of around 10% of consolidated equity capital as an FY2026 capital adequacy ratio target for Hirogin Holdings consolidated and Hiroshima Bank nonconsolidated. An acquisition of treasury stock of 7.0 billion yen was announced on May 13, 2026. The materials show a total return ratio of more than 50% planned in FY2026 for the fifth consecutive period, and a dividend per share of 94 yen planned for FY2028, the final fiscal year of Mid-Term Plan 2024 (77 yen before the revision of the Mid-Term Plan).
| Item | FY2023 (results) | FY2024 (results) | FY2025 (results) | FY2026 (planned) |
|---|---|---|---|---|
| Dividends per share | 37 yen | 48 yen | 58 yen | 70 yen |
| Total dividends (Billion yen) | 11.4 | 14.7 | 17.6 | 20.8 |
| Total treasury stock acquired (Billion yen) | 3.0 | 3.9 | 5.0 | 7.0 |
| Payout ratio | 41.0% | 40.5% | 39.8% | 40.5% |
| Total return ratio | 52.2% | 51.7% | 51.6% | 54.5% |
| DOE | 2.4% | 3.0% | 3.4% | 3.9% |
| Net income attributable to owners of the parent (Billion yen) | 27.6 | 35.8 | 43.7 | 51.0 |
Mid-Term Plan 2024 Revisions
Hirogin Holdings revised upward its targets for FY2028, the final fiscal year of Mid-Term Plan 2024. Net income attributable to owners of the parent was raised from 57 billion yen to 70 billion yen, consolidated ROE from 9.5% or more to 11% or more, and consolidated BPS from 2,000 yen or more to 2,200 yen or more. The consolidated capital adequacy ratio target of approximately 10% is unchanged. Three points underlie the revisions: strong growth in the balance of commercial loans, with the average balance target raised from approximately 5.5 trillion yen to approximately 6.0 trillion yen and the annual growth rate from approximately 3% to approximately 6%; securities portfolio improvements, with returns on funds raised from 22.5 billion yen to 34.5 billion yen and the yield from 1.1% or more to 1.7% or more; and a revision of the policy interest rate scenario, with the BoJ policy interest rate assumption raised from 1.00% to 1.50%, assuming semiannual increases from September 2026 up to 1.5%.
On the KPI trend, consolidated ROE moved from 5.4% in FY2023 to 6.9% in FY2024 and 8.2% in FY2025, and is planned at 8.7% for FY2026 against recognized capital costs of approximately 6-10%. The consolidated capital adequacy ratio was 10.8% in FY2025 after 11.0% in both FY2023 and FY2024, and consolidated BPS was 1,904 yen in FY2025, with 2,030 yen planned for FY2026.
This article is an analysis based on publicly available information and is not a recommendation to buy or sell any specific securities. Investment decisions are your own responsibility.
![[Obayashi] Investors’ Guide 2026 — The Complete 24-Article Breakdown](https://japan-equity.com/wp-content/uploads/2026/07/hub_cover-1024x1024.png)
![[Obayashi] IR & SR Policy — Feeding Dialogue Back into Management](https://japan-equity.com/wp-content/uploads/2026/07/p32_sq-1024x1024.jpg)
![[Obayashi] Real Estate Development — 18.7% Margin, ¥287.7bn Unrealized Gains](https://japan-equity.com/wp-content/uploads/2026/07/p20_sq-1024x1024.jpg)
![[Obayashi] Domestic Civil Engineering — Resilience Spending Supports 9.6% Margin](https://japan-equity.com/wp-content/uploads/2026/07/p11_sq-1024x1024.jpg)
![[Obayashi] Share Price & External Ratings — vs TOPIX, ESG Index Inclusion](https://japan-equity.com/wp-content/uploads/2026/07/p40_sq-1024x1024.jpg)
![[Construction] ¥75.5tn Investment, Shrinking Workforce — Big-5 Market Share](https://japan-equity.com/wp-content/uploads/2026/07/p12_sq-1024x1024.jpg)



![[Obayashi] Capital Policy & Shareholder Returns — ROE 10%+, DOE ~5%, ¥100bn Buyback](https://japan-equity.com/wp-content/uploads/2026/07/p27_sq-1024x1024.jpg)
![[Obayashi] Reducing Cross-Shareholdings — ¥285.2bn Sold in Five Years](https://japan-equity.com/wp-content/uploads/2026/07/p29_sq-1024x1024.jpg)
![[Obayashi] ¥750bn Investment Plan — ¥300bn to Development, ¥190bn to Tech/DX](https://japan-equity.com/wp-content/uploads/2026/07/p30_sq-1024x1024.jpg)
![[Obayashi] MTP2022 KPIs — Operating Profit ~2x Target, ROE 14.4%](https://japan-equity.com/wp-content/uploads/2026/07/p25_sq-1024x1024.jpg)
![[Obayashi] Cash Allocation — ¥420bn Investment CF Over Five Years](https://japan-equity.com/wp-content/uploads/2026/07/p26_sq-1024x1024.jpg)
![[Obayashi] Green Energy — 44 Plants, 344MW, and the Green Hydrogen Challenge](https://japan-equity.com/wp-content/uploads/2026/07/p21_sq-1024x1024.jpg)
![[Obayashi] Tackling the Labor Shortage — Robotics Construction®](https://japan-equity.com/wp-content/uploads/2026/07/p14_sq-1024x1024.jpg)
