
This article is based on publicly available IR materials and is not a recommendation to buy or sell any specific securities.
NIPPON SHOKUBAI CO., LTD. (4114, TSE Prime Market) announced its FY2025 results (twelve months: April 1, 2025 – March 31, 2026) on May 14, 2026. Revenue came to 399.9 billion yen (down 9.4 billion yen, or -2.3%, year on year) and operating profit was 17.5 billion yen (down 1.5 billion yen, -8.0%), with profit attributable to owners of parent of 16.8 billion yen (down 0.6 billion yen, -3.6%). The Solutions Business increased both revenue and operating profit excluding equity-method investment results, but overall profitability deteriorated in the Materials Business, and impairment losses were recorded at an equity-method associate. Citing heightened tensions in the Middle East, the company has not determined its consolidated financial forecast for the fiscal year ending March 31, 2027 at this time.
Consolidated Results (Full-Year Actual)
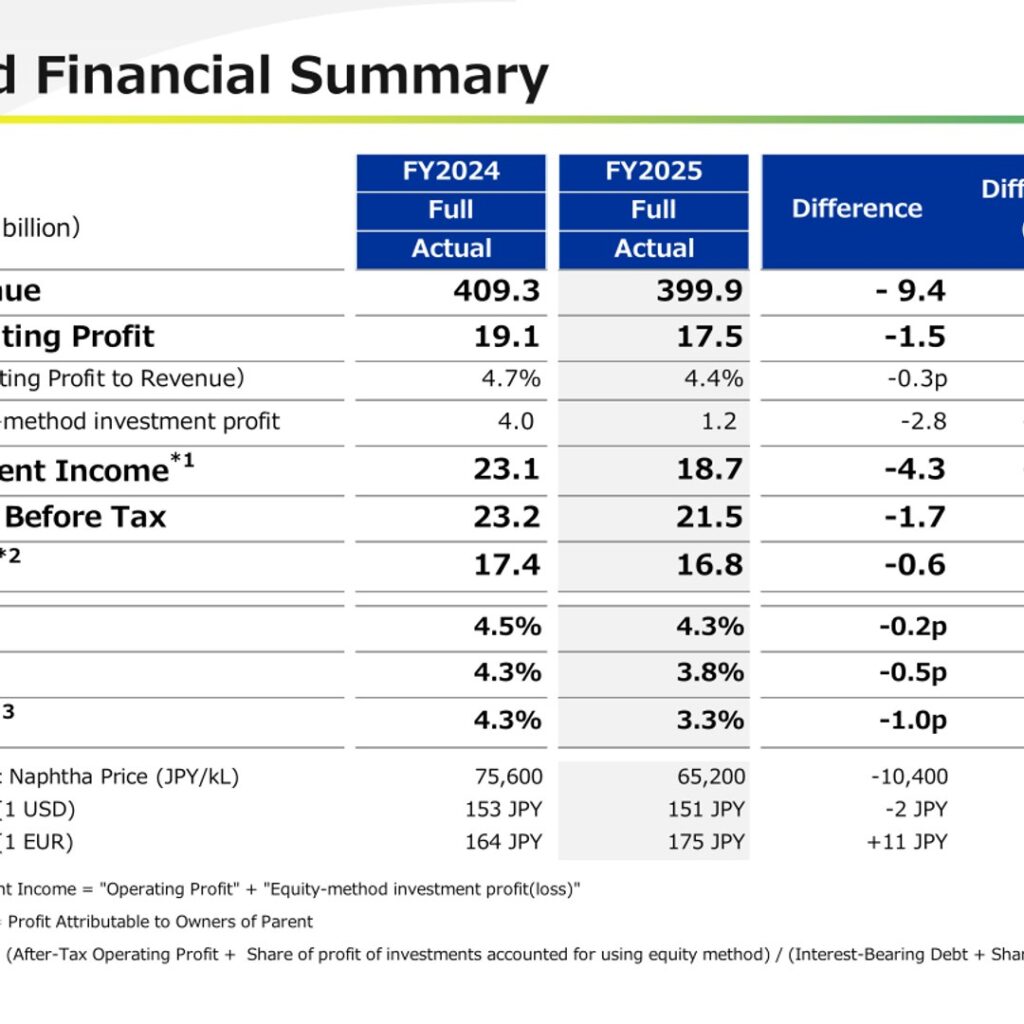
Revenue declined 2.3% year on year to 399.9 billion yen, and operating profit fell 8.0% to 17.5 billion yen. Equity-method investment profit dropped 70.1% to 1.2 billion yen, and segment income (operating profit plus equity-method investment profit/loss) decreased 18.8% to 18.7 billion yen. Profit before tax was 21.5 billion yen (-7.4%) and profit attributable to owners of parent was 16.8 billion yen (-3.6%). Positive factors included higher volumes of electronics materials and SAP and wider spreads due to lower raw material prices; negative factors included increased SG&A and fixed manufacturing costs, decreased inventory valuation gains, and impairment losses at an equity-method associate. The domestic naphtha price averaged 65,200 JPY/kL (FY2024: 75,600 JPY/kL, -13.8%), and the FX rate was 151 JPY per USD (FY2024: 153 JPY).
| Item (JPY billion) | FY2025 Actual | FY2024 Actual | Difference | Difference (%) |
|---|---|---|---|---|
| Revenue | 399.9 | 409.3 | -9.4 | -2.3% |
| Operating Profit | 17.5 | 19.1 | -1.5 | -8.0% |
| (Operating Profit to Revenue) | 4.4% | 4.7% | -0.3p | – |
| Equity-method investment profit | 1.2 | 4.0 | -2.8 | -70.1% |
| Segment Income | 18.7 | 23.1 | -4.3 | -18.8% |
| Profit Before Tax | 21.5 | 23.2 | -1.7 | -7.4% |
| Profit (Attributable to Owners of Parent) | 16.8 | 17.4 | -0.6 | -3.6% |
| ROE | 4.3% | 4.5% | -0.2p | – |
| ROIC | 3.3% | 4.3% | -1.0p | – |
Segment Results
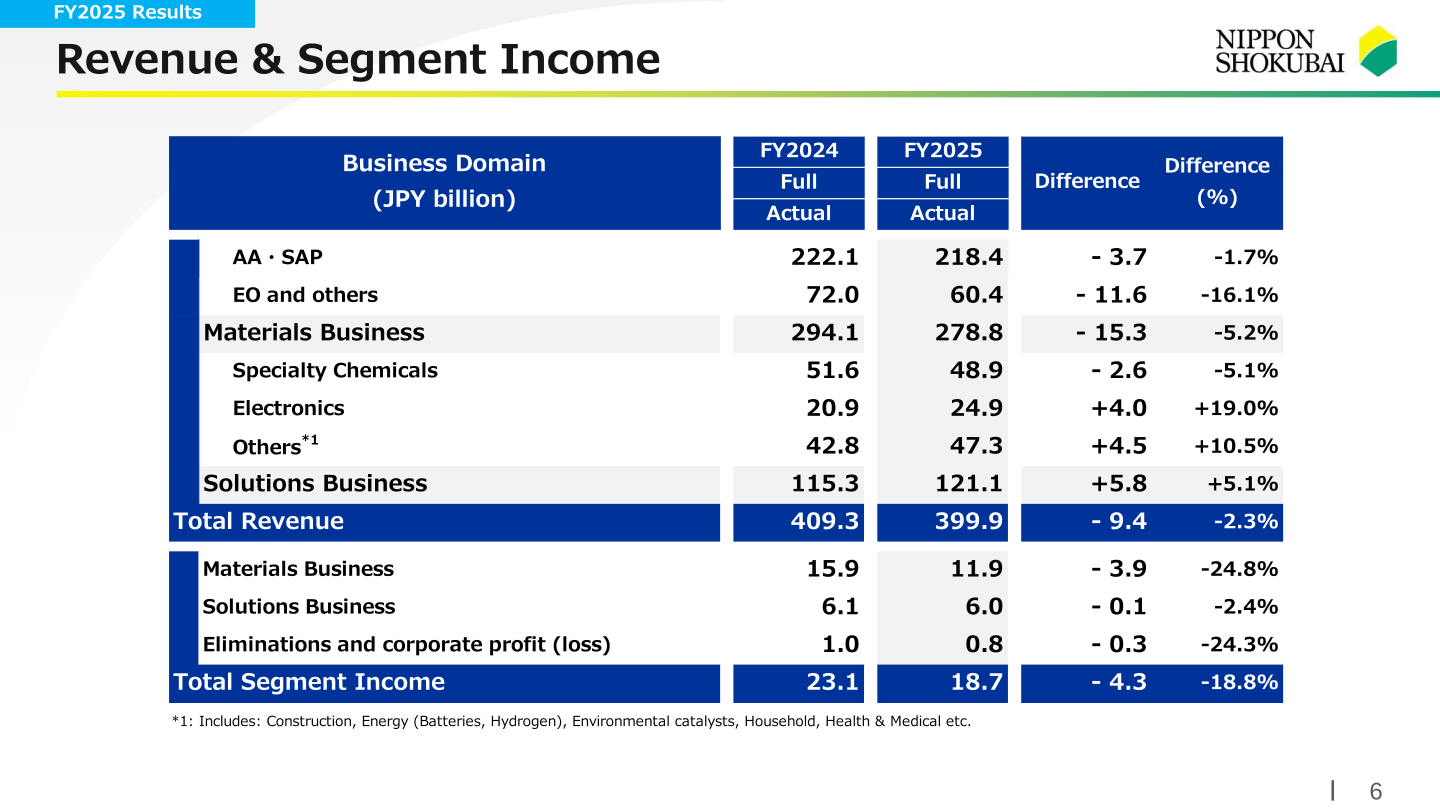
In the Materials Business, revenue fell 5.2% to 278.8 billion yen and segment income fell 24.8% to 11.9 billion yen. Within the segment, AA・SAP revenue was 218.4 billion yen (-1.7%) and EO and others revenue was 60.4 billion yen (-16.1%). SAP saw spread expansion driven by lower raw material prices and increased volume from expanded sales in emerging markets, while AES and special esters faced continued weak overseas market conditions; equity-method investment profit deteriorated due to the decline in MMA market conditions. In the Solutions Business, revenue rose 5.1% to 121.1 billion yen while segment income edged down 2.4% to 6.0 billion yen. Electronics revenue grew 19.0% to 24.9 billion yen on expanded sales of display-related materials to China, and the Others domain grew 10.5% to 47.3 billion yen, helped by the consolidation of E-TEC (Emulsion Technology Co., Ltd.) as a subsidiary; impairment losses were recorded at an equity-method associate.
| Business Domain | Metric (JPY billion) | FY2025 | FY2024 | Difference (%) |
|---|---|---|---|---|
| Materials: AA・SAP | Revenue | 218.4 | 222.1 | -1.7% |
| Materials: EO and others | Revenue | 60.4 | 72.0 | -16.1% |
| Materials Business total | Revenue | 278.8 | 294.1 | -5.2% |
| Solutions: Specialty Chemicals | Revenue | 48.9 | 51.6 | -5.1% |
| Solutions: Electronics | Revenue | 24.9 | 20.9 | +19.0% |
| Solutions: Others | Revenue | 47.3 | 42.8 | +10.5% |
| Solutions Business total | Revenue | 121.1 | 115.3 | +5.1% |
| Total Revenue | Revenue | 399.9 | 409.3 | -2.3% |
| Materials Business | Segment Income | 11.9 | 15.9 | -24.8% |
| Solutions Business | Segment Income | 6.0 | 6.1 | -2.4% |
| Eliminations and corporate profit (loss) | Segment Income | 0.8 | 1.0 | -24.3% |
| Total Segment Income | Segment Income | 18.7 | 23.1 | -18.8% |
Next-Year Forecast (Undetermined)
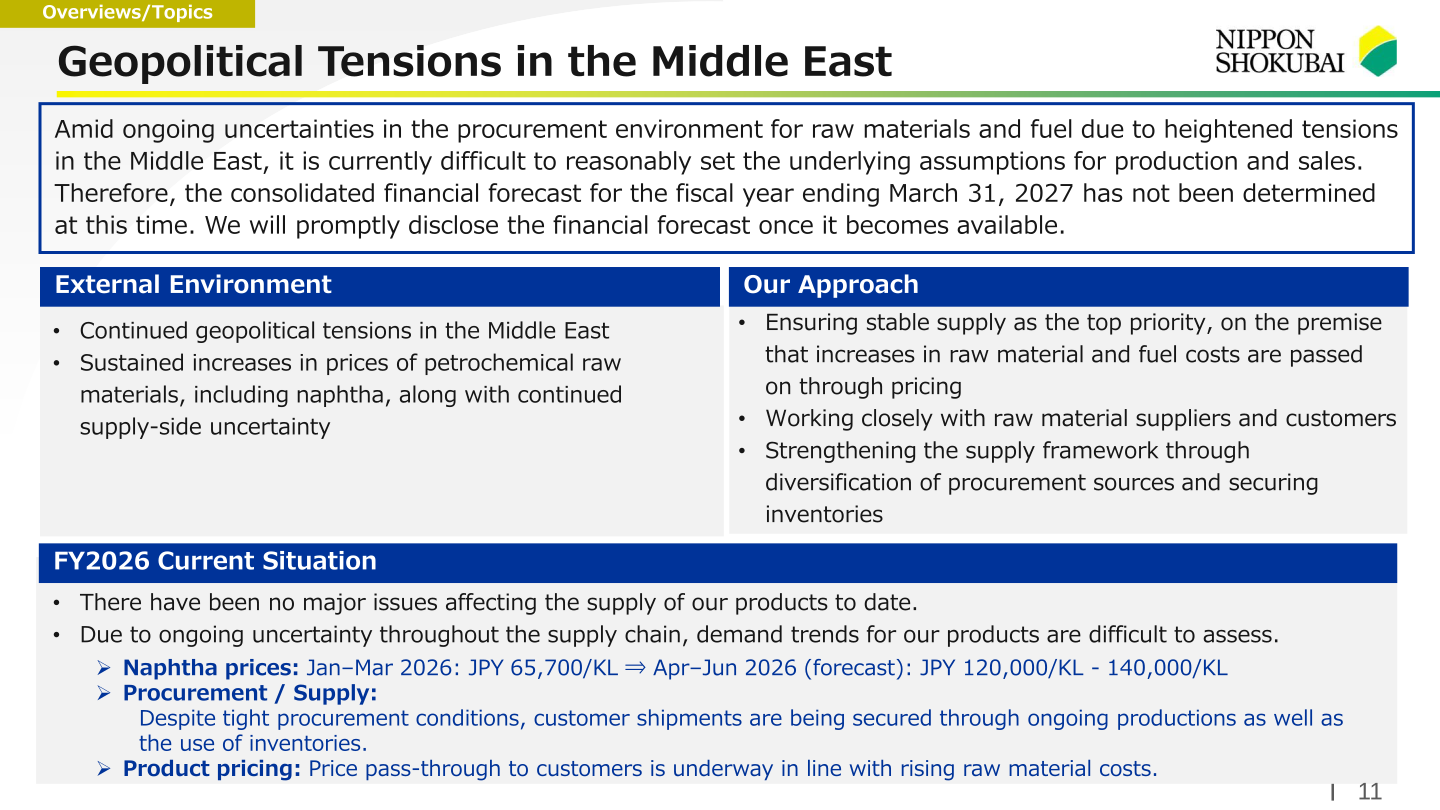
As it is extremely difficult to reasonably estimate the impact of heightened tensions in the Middle East on the Group, the consolidated financial forecast for the fiscal year ending March 31, 2027 has not been determined at this time; the company states it will promptly disclose the financial forecast once it becomes available. The company notes sustained increases in prices of petrochemical raw materials, including naphtha — Jan–Mar 2026 naphtha prices of 65,700 JPY/KL versus an Apr–Jun 2026 forecast of 120,000 JPY/KL – 140,000 JPY/KL — along with continued supply-side uncertainty. There have been no major issues affecting the supply of its products to date; despite tight procurement conditions, customer shipments are being secured through ongoing production and the use of inventories, and price pass-through to customers is underway in line with rising raw material costs.
Shareholder Returns
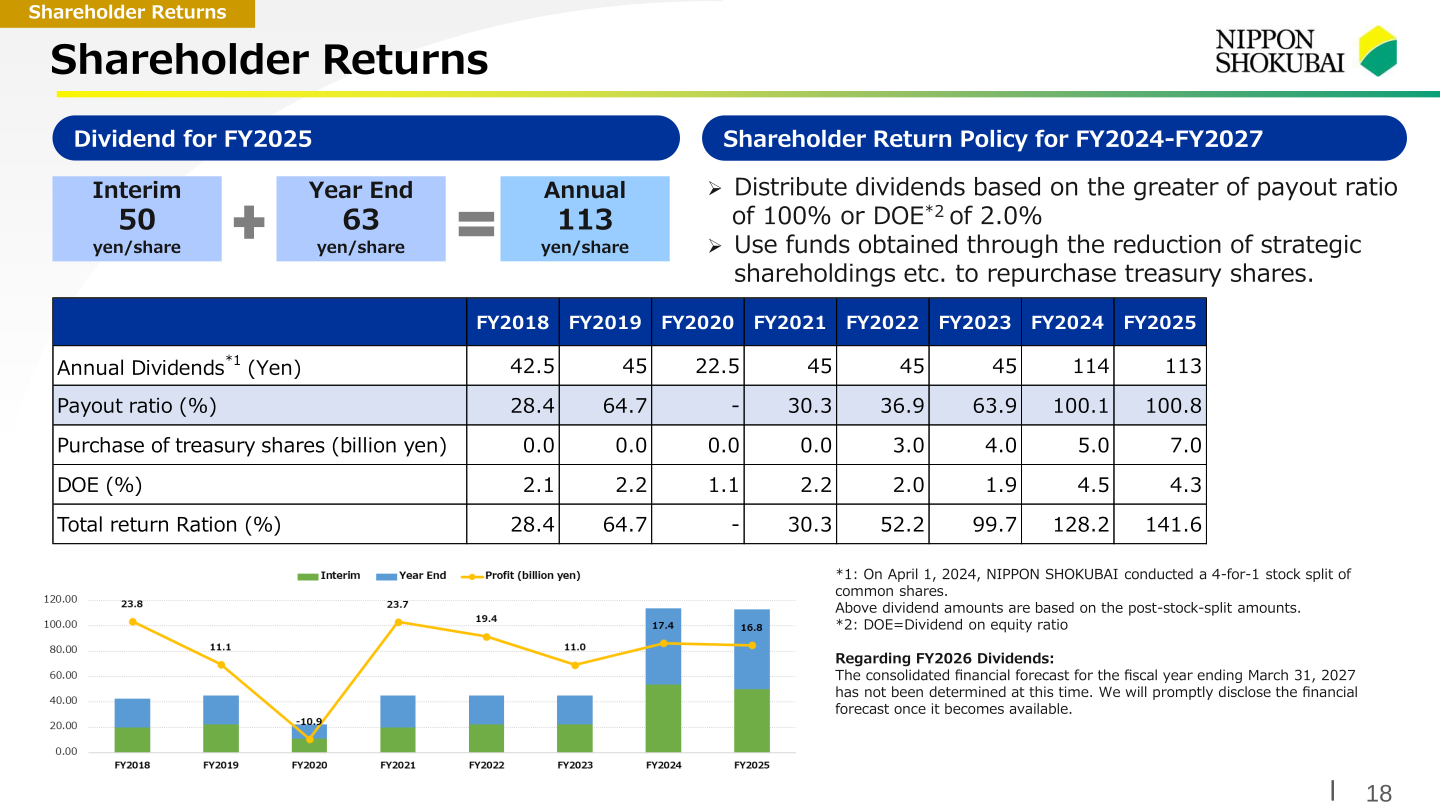
The annual dividend for FY2025 was 113 yen per share (interim 50 yen, year-end 63 yen), with a payout ratio of 100.8% and DOE of 4.3%. Purchases of treasury shares totaled 7.0 billion yen, bringing the total return ratio to 141.6%. Under its shareholder return policy for FY2024–FY2027, the company distributes dividends based on the greater of a payout ratio of 100% or DOE of 2.0%, and uses funds obtained through the reduction of strategic shareholdings and other sources to repurchase treasury shares. The number of cross-holding stocks held declined from 30 as of March 31, 2025 to 22 as of March 31, 2026, with net proceeds from sales of 9.1 billion yen. Regarding FY2026 dividends, because the consolidated financial forecast for the fiscal year ending March 31, 2027 has not been determined, the dividend has not been announced at this time.
| Item | FY2025 | FY2024 |
|---|---|---|
| Annual dividends (yen/share) | 113 | 114 |
| Payout ratio (%) | 100.8 | 100.1 |
| Purchase of treasury shares (billion yen) | 7.0 | 5.0 |
| DOE (%) | 4.3 | 4.5 |
| Total return ratio (%) | 141.6 | 128.2 |
Topics
In Energy (Batteries), the company is expanding production capacity for IONEL(TM) lithium-ion battery electrolytes at its joint venture in China: commercial production of an additional 3,000 tons per year is to start in the first half of FY2026 and a further 7,000 tons per year in the first half of FY2027, bringing total capacity, combined with the existing 2,400 tons per year, to 12,400 tons per year, with profit contribution expected from the second half of fiscal year 2026. The company also plans to establish a new IONEL plant in Kitakyushu, with construction started in January 2026 and commercial production of 3,000 tons per year to begin during FY2028. In SAP, production capacity in Indonesia is being expanded by 50,000 tons per year, with commercial operation scheduled to commence in July 2027. In Electronics, materials such as ACRYVIEWA(TM) resins for optical films continue to grow, driven by the trend toward larger-sized and higher-definition LCD displays.
Key performance indicators for FY2025 included capital expenditure of 53.3 billion yen (FY2024: 37.8 billion yen), depreciation and amortization of 32.2 billion yen, R&D costs of 16.8 billion yen, and EBITDA of 54.8 billion yen (FY2024: 56.1 billion yen). Cash flows from operating activities were 53.5 billion yen and free cash flows were 5.2 billion yen. The D/E ratio was 0.17x and the shareholders’ equity ratio was 68.4%.
| Item (JPY billion) | FY2025 Full | FY2024 Full | FY2023 Full |
|---|---|---|---|
| Capex | 53.3 | 37.8 | 16.8 |
| Depreciation and amortization | 32.2 | 31.6 | 31.9 |
| R&D cost | 16.8 | 15.7 | 15.1 |
| EBITDA | 54.8 | 56.1 | 49.3 |
| Interest-bearing loans | 65.5 | 46.6 | 45.6 |
| ROE (%) | 4.3 | 4.5 | 3.0 |
This article is an analysis based on publicly available information and is not a recommendation to buy or sell any specific securities. Investment decisions are your own responsibility.
![[Obayashi] Investors’ Guide 2026 — The Complete 24-Article Breakdown](https://japan-equity.com/wp-content/uploads/2026/07/hub_cover-1024x1024.png)
![[Obayashi] IR & SR Policy — Feeding Dialogue Back into Management](https://japan-equity.com/wp-content/uploads/2026/07/p32_sq-1024x1024.jpg)
![[Obayashi] Real Estate Development — 18.7% Margin, ¥287.7bn Unrealized Gains](https://japan-equity.com/wp-content/uploads/2026/07/p20_sq-1024x1024.jpg)
![[Obayashi] Domestic Civil Engineering — Resilience Spending Supports 9.6% Margin](https://japan-equity.com/wp-content/uploads/2026/07/p11_sq-1024x1024.jpg)
![[Obayashi] Share Price & External Ratings — vs TOPIX, ESG Index Inclusion](https://japan-equity.com/wp-content/uploads/2026/07/p40_sq-1024x1024.jpg)
![[Construction] ¥75.5tn Investment, Shrinking Workforce — Big-5 Market Share](https://japan-equity.com/wp-content/uploads/2026/07/p12_sq-1024x1024.jpg)



![[Obayashi] Capital Policy & Shareholder Returns — ROE 10%+, DOE ~5%, ¥100bn Buyback](https://japan-equity.com/wp-content/uploads/2026/07/p27_sq-1024x1024.jpg)
![[Obayashi] Reducing Cross-Shareholdings — ¥285.2bn Sold in Five Years](https://japan-equity.com/wp-content/uploads/2026/07/p29_sq-1024x1024.jpg)
![[Obayashi] ¥750bn Investment Plan — ¥300bn to Development, ¥190bn to Tech/DX](https://japan-equity.com/wp-content/uploads/2026/07/p30_sq-1024x1024.jpg)
![[Obayashi] MTP2022 KPIs — Operating Profit ~2x Target, ROE 14.4%](https://japan-equity.com/wp-content/uploads/2026/07/p25_sq-1024x1024.jpg)
![[Obayashi] Cash Allocation — ¥420bn Investment CF Over Five Years](https://japan-equity.com/wp-content/uploads/2026/07/p26_sq-1024x1024.jpg)
![[Obayashi] Green Energy — 44 Plants, 344MW, and the Green Hydrogen Challenge](https://japan-equity.com/wp-content/uploads/2026/07/p21_sq-1024x1024.jpg)
![[Obayashi] Tackling the Labor Shortage — Robotics Construction®](https://japan-equity.com/wp-content/uploads/2026/07/p14_sq-1024x1024.jpg)
