
This article is based on publicly available IR materials and is not a recommendation to buy or sell any specific securities.
GS Yuasa Corporation (6674) reported consolidated results for the fiscal year ended March 31, 2026 (FY2025) on May 13, 2026, together with an update to its long-term vision (Vision 2035) and the 7th Mid-term Management Plan. Net sales rose 4.9% year on year to 609.0 billion yen, operating income increased 20.3% to 60.2 billion yen, and profit attributable to owners of parent rose 37.6% to 41.9 billion yen. All five segments posted higher sales, with Automotive Batteries (Overseas) and Automotive Lithium-ion Batteries driving the operating income gain. The annual dividend was raised by ¥15 to ¥90 per share, and FY2026 guidance calls for net sales of 660.0 billion yen, operating income of 60.0 billion yen and a dividend of ¥98.
Consolidated Results (Full-Year Actual)
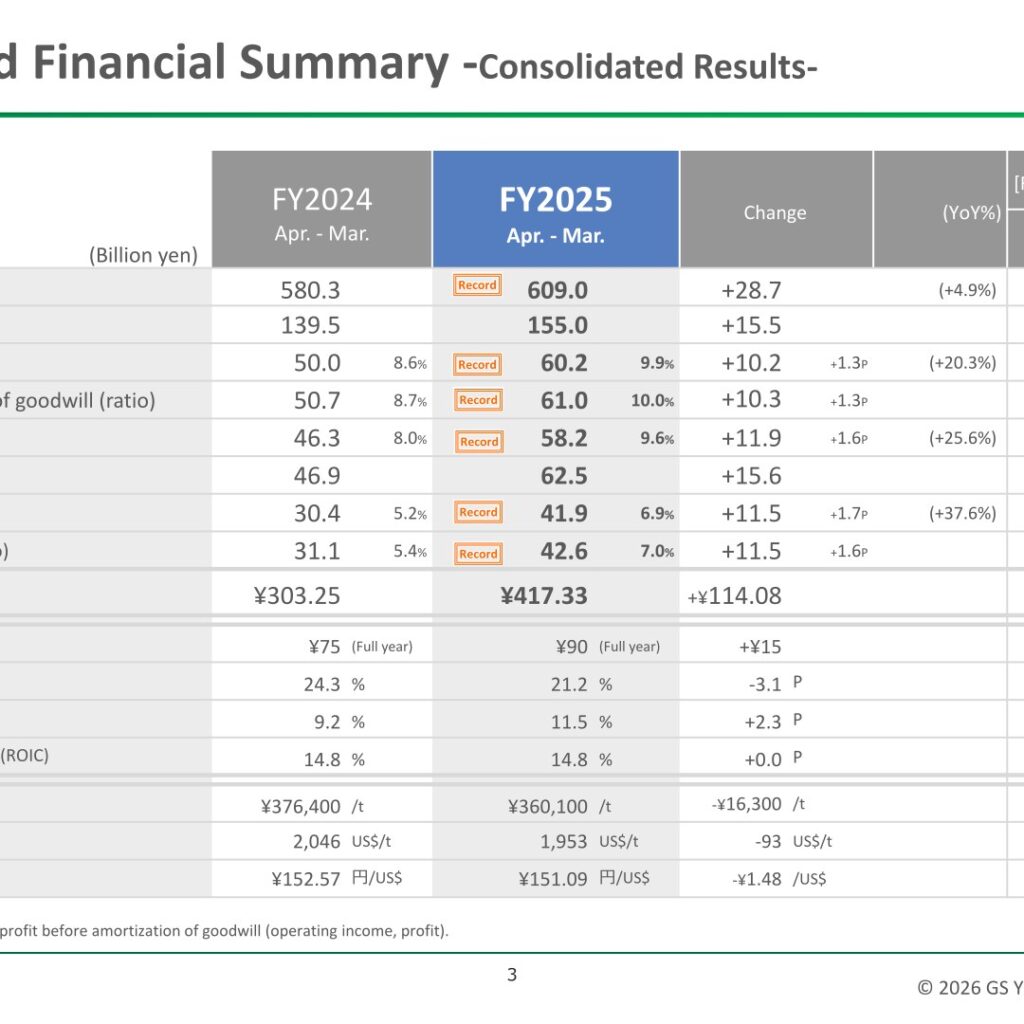
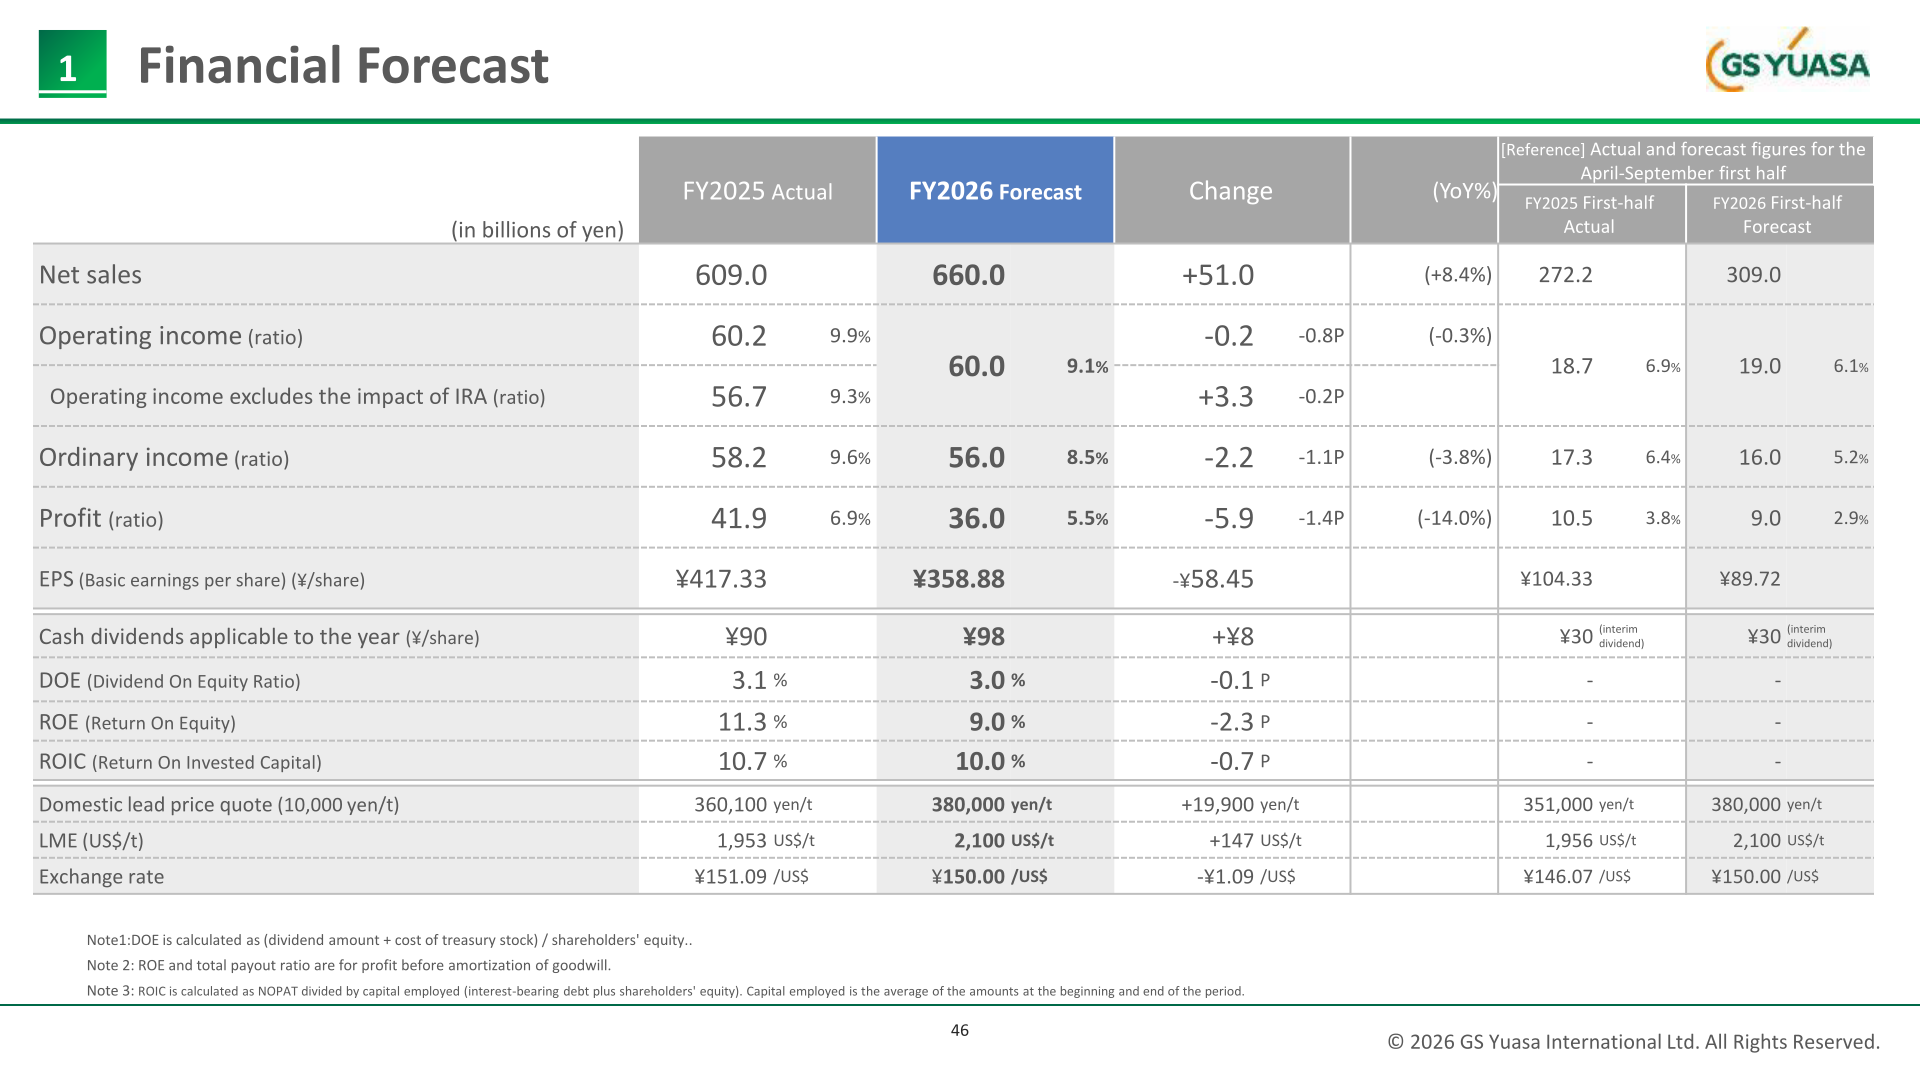
For FY2025 (April 2025 to March 2026), net sales were 609.0 billion yen, up 28.7 billion yen (+4.9%) from 580.3 billion yen in FY2024. Gross profit rose 15.5 billion yen to 155.0 billion yen. Operating income was 60.2 billion yen (operating margin 9.9%), up 10.2 billion yen (+20.3%) from 50.0 billion yen, while operating income before amortization of goodwill was 61.0 billion yen (10.0%), up 10.3 billion yen. Ordinary income rose 11.9 billion yen (+25.6%) to 58.2 billion yen and profit (attributable to owners of parent) rose 11.5 billion yen (+37.6%) to 41.9 billion yen. Basic EPS was ¥417.33, up ¥114.08. Results exceeded both the initial forecast (net sales 600.0 billion yen, operating income 51.0 billion yen, profit 33.0 billion yen) and the February 2026 revised forecast (600.0 / 53.5 / 36.0 billion yen). ROE was 11.5% (+2.3 P) and ROIC 14.8% (+0.0 P). Market assumptions: domestic lead price ¥360,100/t (down ¥16,300/t), LME 1,953 US$/t (down 93 US$/t) and an exchange rate of ¥151.09/US$ (down ¥1.48).
| Item (Billion yen) | FY2024 | FY2025 | Change (YoY%) | Initial forecast (May 2025) | Revised forecast (Feb. 2026) |
|---|---|---|---|---|---|
| Net sales | 580.3 | 609.0 | +28.7 (+4.9%) | 600.0 | 600.0 |
| Gross profit | 139.5 | 155.0 | +15.5 | – | – |
| Operating income (ratio) | 50.0 (8.6%) | 60.2 (9.9%) | +10.2 +1.3P (+20.3%) | 51.0 (8.5%) | 53.5 (8.9%) |
| Operating income before amortization of goodwill (ratio) | 50.7 (8.7%) | 61.0 (10.0%) | +10.3 +1.3P | 52.0 (8.7%) | 54.5 (9.1%) |
| Ordinary income (ratio) | 46.3 (8.0%) | 58.2 (9.6%) | +11.9 +1.6P (+25.6%) | 49.0 (8.2%) | 51.5 (8.6%) |
| Profit before income taxes | 46.9 | 62.5 | +15.6 | – | – |
| Profit (ratio) | 30.4 (5.2%) | 41.9 (6.9%) | +11.5 +1.7P (+37.6%) | 33.0 (5.5%) | 36.0 (6.0%) |
| Profit before amortization of goodwill (ratio) | 31.1 (5.4%) | 42.6 (7.0%) | +11.5 +1.6P | 34.0 (5.7%) | 37.0 (6.2%) |
| EPS (¥/share) | ¥303.25 | ¥417.33 | +¥114.08 | ¥328.99 | ¥358.88 |
| Annual dividend (¥/share) | ¥75 | ¥90 | +¥15 | ¥80 | ¥90 |
| Total return ratio | 24.3% | 21.2% | -3.1 P | 23.6% | – |
| ROE | 9.2% | 11.5% | +2.3 P | 9.5% | – |
| ROIC | 14.8% | 14.8% | +0.0 P | 13.0% | – |
Factors behind the 10.3 billion yen year-on-year increase in operating income before amortization of goodwill (50.7 to 61.0 billion yen) were: quantity/composition change +7.9, sales price +13.3, raw material price -2.4, expenses etc. -10.6, exchange +0.1, hyperinflationary accounting -0.6, others -0.8, and subsidies under the US Inflation Reduction Act of 2022 (IRA) +3.5 billion yen. Below operating income, extraordinary income included 7.0 billion yen of gains on the sale of investment securities (profits from the sale of Mitsubishi Logisnext shares +6.9 billion yen), while extraordinary loss included a 3.3 billion yen provision for losses due to restructuring of affiliated companies (provisions related to the sale of the Turkey site +3.3 billion yen). Income taxes were 15.0 billion yen (+2.0) and profit attributable to non-controlling interests 5.6 billion yen (+2.1).
Segment Results
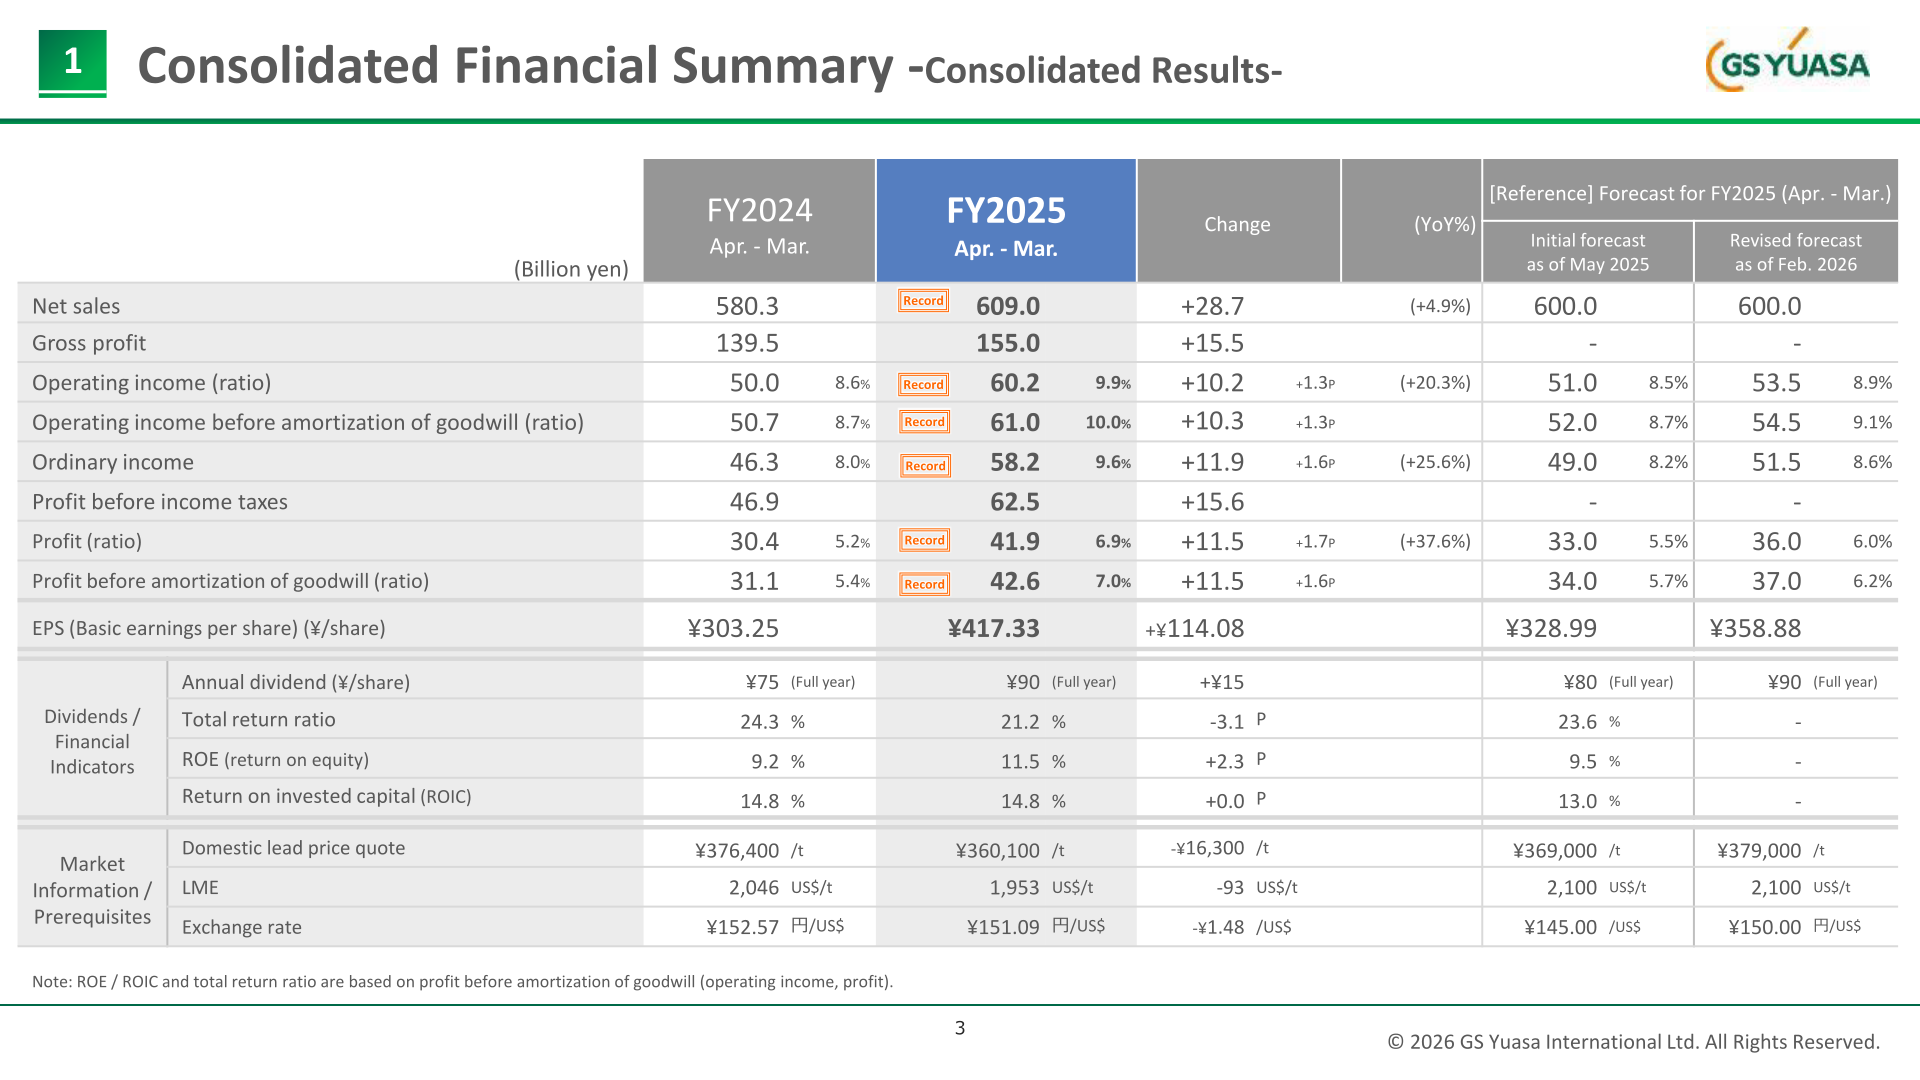
All five segments recorded higher net sales. Operating income (before amortization of goodwill) rose in four segments and fell in Specialized Batteries and Others. Automotive Batteries (Japan): net sales 108.0 billion yen (+6.1), operating income 11.7 billion yen (+1.0), margin 10.8%; net sales rose on selling price revisions and the antimony price slide for new automobiles, and on higher volume and a better mix (e.g., batteries for ISS vehicles) for replacement. Automotive Batteries (Overseas): net sales 264.5 billion yen (+4.4), operating income 24.5 billion yen (+5.8), margin 9.3%; ASEAN replacement demand in Thailand and Vietnam remained strong, European volume increased, Turkey domestic sales fell substantially, and IRA subsidies contributed +3.5 billion yen (FY2023 and FY2024 subsidies were also recorded in addition to FY2025). Industrial Batteries and Power Supplies: net sales 124.1 billion yen (+11.0), operating income 18.4 billion yen (+0.5), margin 14.8%; sales increased significantly in both the regular field (postponed projects plus new projects) and the emergency field (telecommunications HVDC, convenience stores, nuclear power plants and data centers). Automotive Lithium-ion Batteries: net sales 89.9 billion yen (+7.1), operating income 4.9 billion yen (+3.5), margin 5.5%; volumes for HEVs (Honda) and PHEVs (Mitsubishi Motors) increased while 12V lithium-ion sales decreased. Specialized Batteries and Others: net sales 22.5 billion yen (+0.1), operating income 1.5 billion yen (-0.6); profit fell on higher R&D and administrative expenses and lower sales of lithium-ion batteries for aircraft.
| Segment (Billion yen) | FY2024 Net sales | FY2024 Op. income (ratio %) | FY2025 Net sales | FY2025 Op. income (ratio %) | Change Net sales | Change Op. income (pp) |
|---|---|---|---|---|---|---|
| Automotive Batteries (Japan) | 101.9 | 10.7 (10.5) | 108.0 | 11.7 (10.8) | +6.1 | +1.0 (+0.3) |
| Automotive Batteries (Overseas) | 260.1 | 18.7 (7.2) | 264.5 | 24.5 (9.3) | +4.4 | +5.8 (+2.1) |
| Industrial Batteries and Power Supplies | 113.1 | 17.9 (15.8) | 124.1 | 18.4 (14.8) | +11.0 | +0.5 (-1.0) |
| Automotive Lithium-ion Batteries | 82.8 | 1.4 (1.7) | 89.9 | 4.9 (5.5) | +7.1 | +3.5 (+3.8) |
| Specialized Batteries and Others | 22.4 | 2.1 (9.5) | 22.5 | 1.5 (6.7) | +0.1 | -0.6 (-2.8) |
| Total | 580.3 | 50.7 (8.7) | 609.0 | 61.0 (10.0) | +28.7 | +10.3 (+1.3) |
Note: Segment operating income is operating income before amortization of goodwill. On the balance sheet, total assets were 741.0 billion yen (+47.2) as of March 31, 2026, the equity ratio improved from 50.0% to 53.3%, and total borrowings fell from ¥105.7bn to ¥87.8bn. Operating cash flow was +49.5 billion yen, investing cash flow -44.9 billion yen (including capacity expansion of Blue Energy No.2 plant to 70 million cells per year and BEV battery investment), leaving free cash flow of +¥4.6 billion; cash and cash equivalents decreased from 56.7 billion yen to 32.0 billion yen. Capital investment was 54.4 billion yen (-4.4), depreciation 26.6 billion yen (+1.9) and R&D costs 21.1 billion yen (+2.6; 3.5% of net sales).
FY2026 Forecast
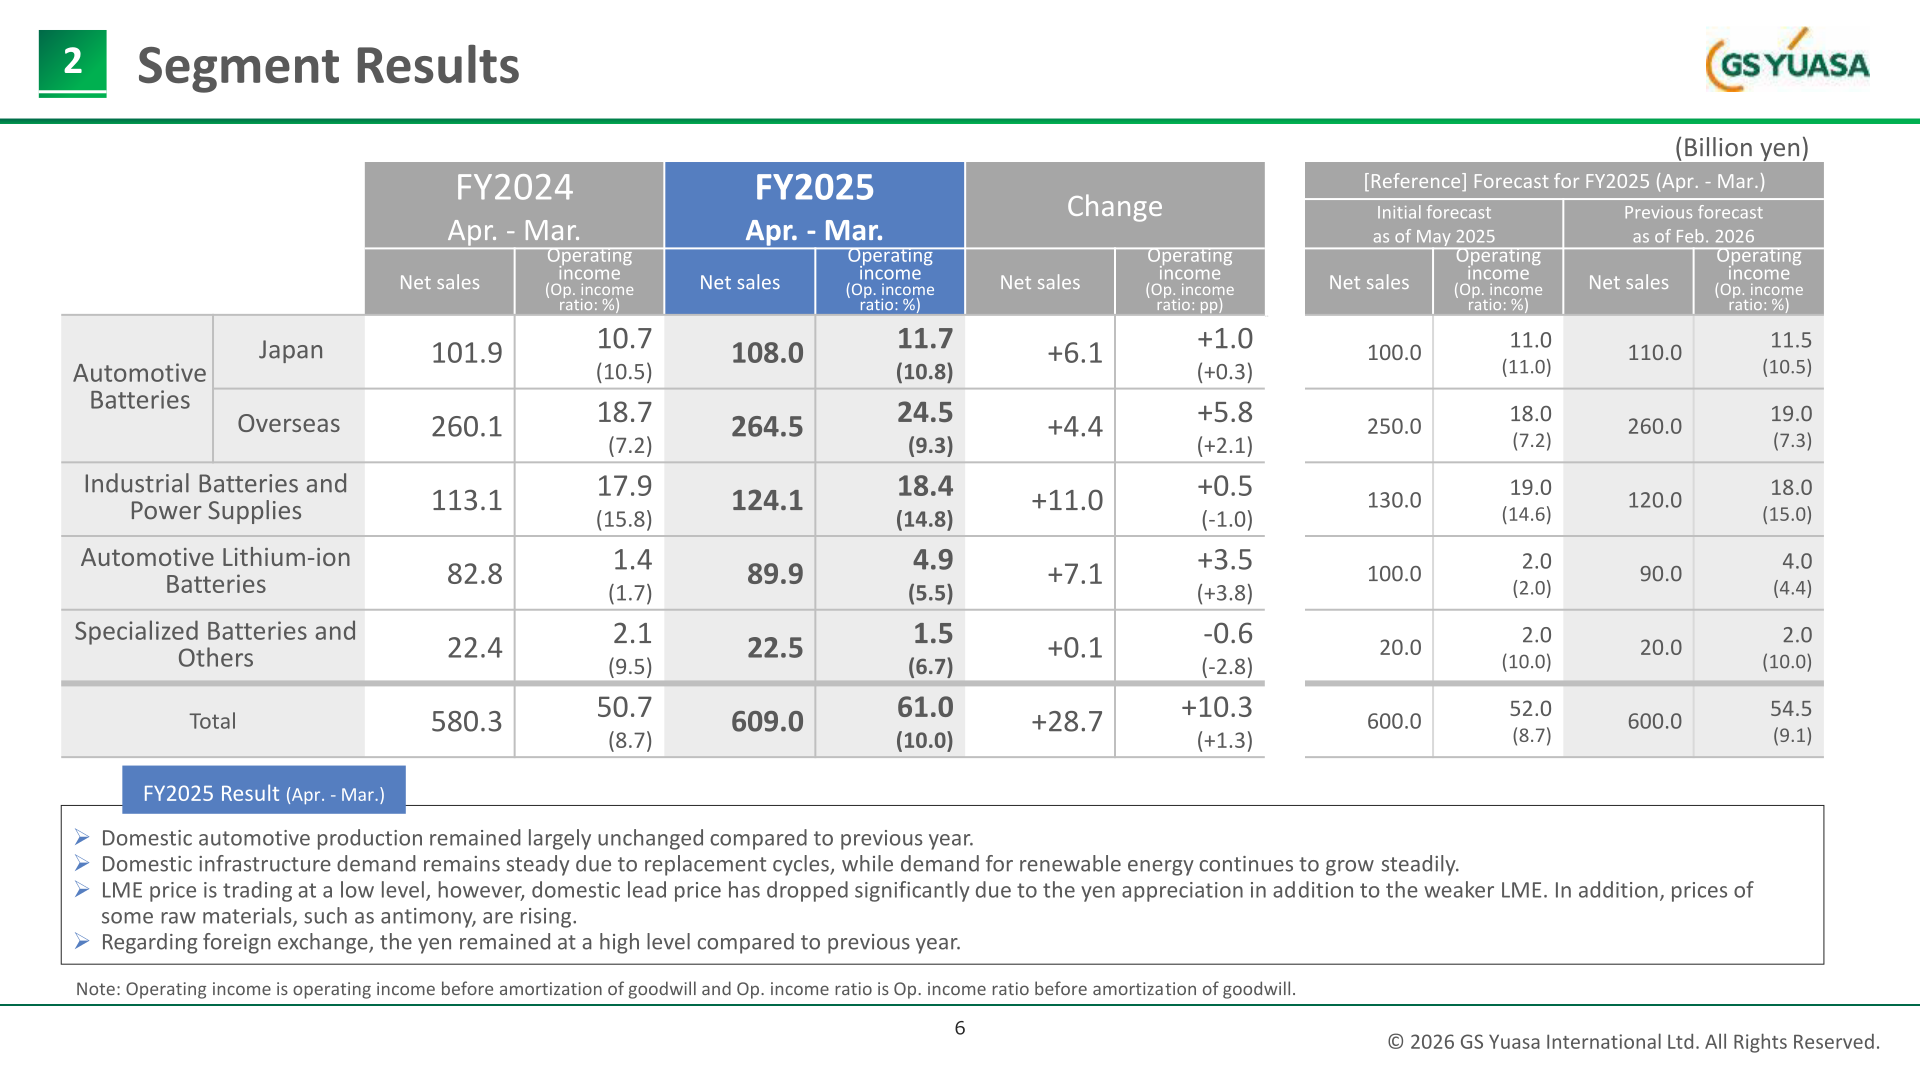
For FY2026 (ending March 31, 2027), the company forecasts net sales of 660.0 billion yen (+51.0 billion yen, +8.4%), operating income of 60.0 billion yen (-0.2 billion yen, -0.3%; margin 9.1%), ordinary income of 56.0 billion yen (-2.2, -3.8%), profit of 36.0 billion yen (-5.9, -14.0%) and EPS of ¥358.88. Excluding the IRA impact, FY2025 operating income was 56.7 billion yen (9.3%), so the FY2026 forecast represents a +3.3 billion yen increase on that basis. The operating income bridge from 56.7 to 60.0 billion yen comprises quantity/composition change +8.8, sales price +15.9, raw material price -7.6, expenses etc. -15.7, exchange -0.1, others -0.3 and the impact of restructuring of the Turkish base +2.4 billion yen. Assumptions are a domestic lead price of 380,000 yen/t, LME of 2,100 US$/t and an exchange rate of ¥150.00/US$. First-half forecasts are net sales of 309.0 billion yen, operating income of 19.0 billion yen and profit of 9.0 billion yen. From FY2026 the disclosed segments are reorganized into Mobility and Public Infrastructure, with Aviation, Space and Defense disclosed independently and the overseas industrial business reclassified from Automotive Batteries (Overseas) into Public Infrastructure.
| Item (in billions of yen) | FY2025 Actual | FY2026 Forecast | Change (YoY%) |
|---|---|---|---|
| Net sales | 609.0 | 660.0 | +51.0 (+8.4%) |
| Operating income (ratio) | 60.2 (9.9%) | 60.0 (9.1%) | -0.2 -0.8P (-0.3%) |
| Operating income excluding the impact of IRA (ratio) | 56.7 (9.3%) | – | +3.3 -0.2P |
| Ordinary income (ratio) | 58.2 (9.6%) | 56.0 (8.5%) | -2.2 -1.1P (-3.8%) |
| Profit (ratio) | 41.9 (6.9%) | 36.0 (5.5%) | -5.9 -1.4P (-14.0%) |
| EPS (¥/share) | ¥417.33 | ¥358.88 | -¥58.45 |
| Cash dividends applicable to the year (¥/share) | ¥90 | ¥98 | +¥8 |
| DOE | 3.1% | 3.0% | -0.1 P |
| ROE | 11.3% | 9.0% | -2.3 P |
| ROIC | 10.7% | 10.0% | -0.7 P |
| Segment (billion yen) | FY2025 Net sales | FY2025 Op. income (ratio) | FY2026 Net sales | FY2026 Op. income (ratio) | Change Net sales | Change Op. income |
|---|---|---|---|---|---|---|
| Automotive Batteries (Japan) | 108.0 | 11.7 (10.8%) | 113.0 | 11.5 (10.2%) | +5.0 | -0.2 (-0.6%) |
| Automotive Batteries (Overseas) | 264.5 | 23.6 (8.9%) | 224.0 | 23.0 (10.3%) | -40.5 | -0.6 (+1.4%) |
| Automotive Batteries (Overseas) excluding IRA | – | 20.1 (7.6%) | – | – | – | +2.9 (+2.7%) |
| Automotive Lithium (HEV, PHEV, 12V) | 89.9 | 4.9 (5.5%) | 107.0 | 5.0 (4.7%) | +17.1 | +0.1 (-0.8%) |
| Industrial Batteries and Power Supplies | 124.1 | 18.4 (14.8%) | 190.0 | 19.5 (10.3%) | +65.9 | +1.1 (-4.5%) |
| Aviation, Space and Defense | 19.8 | 2.7 (13.4%) | 23.0 | 2.5 (10.9%) | +3.2 | -0.2 (-2.5%) |
| Specialized Batteries and Others | 2.7 | -1.2 ( – ) | 3.0 | -1.5 ( – ) | +0.3 | -0.3 ( – ) |
| Total | 609.0 | 60.2 (9.9%) | 660.0 | 60.0 (9.1%) | +51.0 | -0.2 (-0.8%) |
| Total excluding IRA | – | 56.7 (9.3%) | – | – | – | +3.3 (-0.2%) |
Capital investment is planned at 90.0 billion yen in FY2026 (+35.6 billion yen from 54.4 billion yen), of which Industrial Batteries and Power Supplies accounts for 43.5 billion yen (+39.5), reflecting investment in the development and mass production of domestic stationary lithium-ion batteries. Depreciation is forecast at 25.0 billion yen (-1.6) and R&D expenses at 25.0 billion yen (+3.9; 3.8% of net sales).
Shareholder Returns
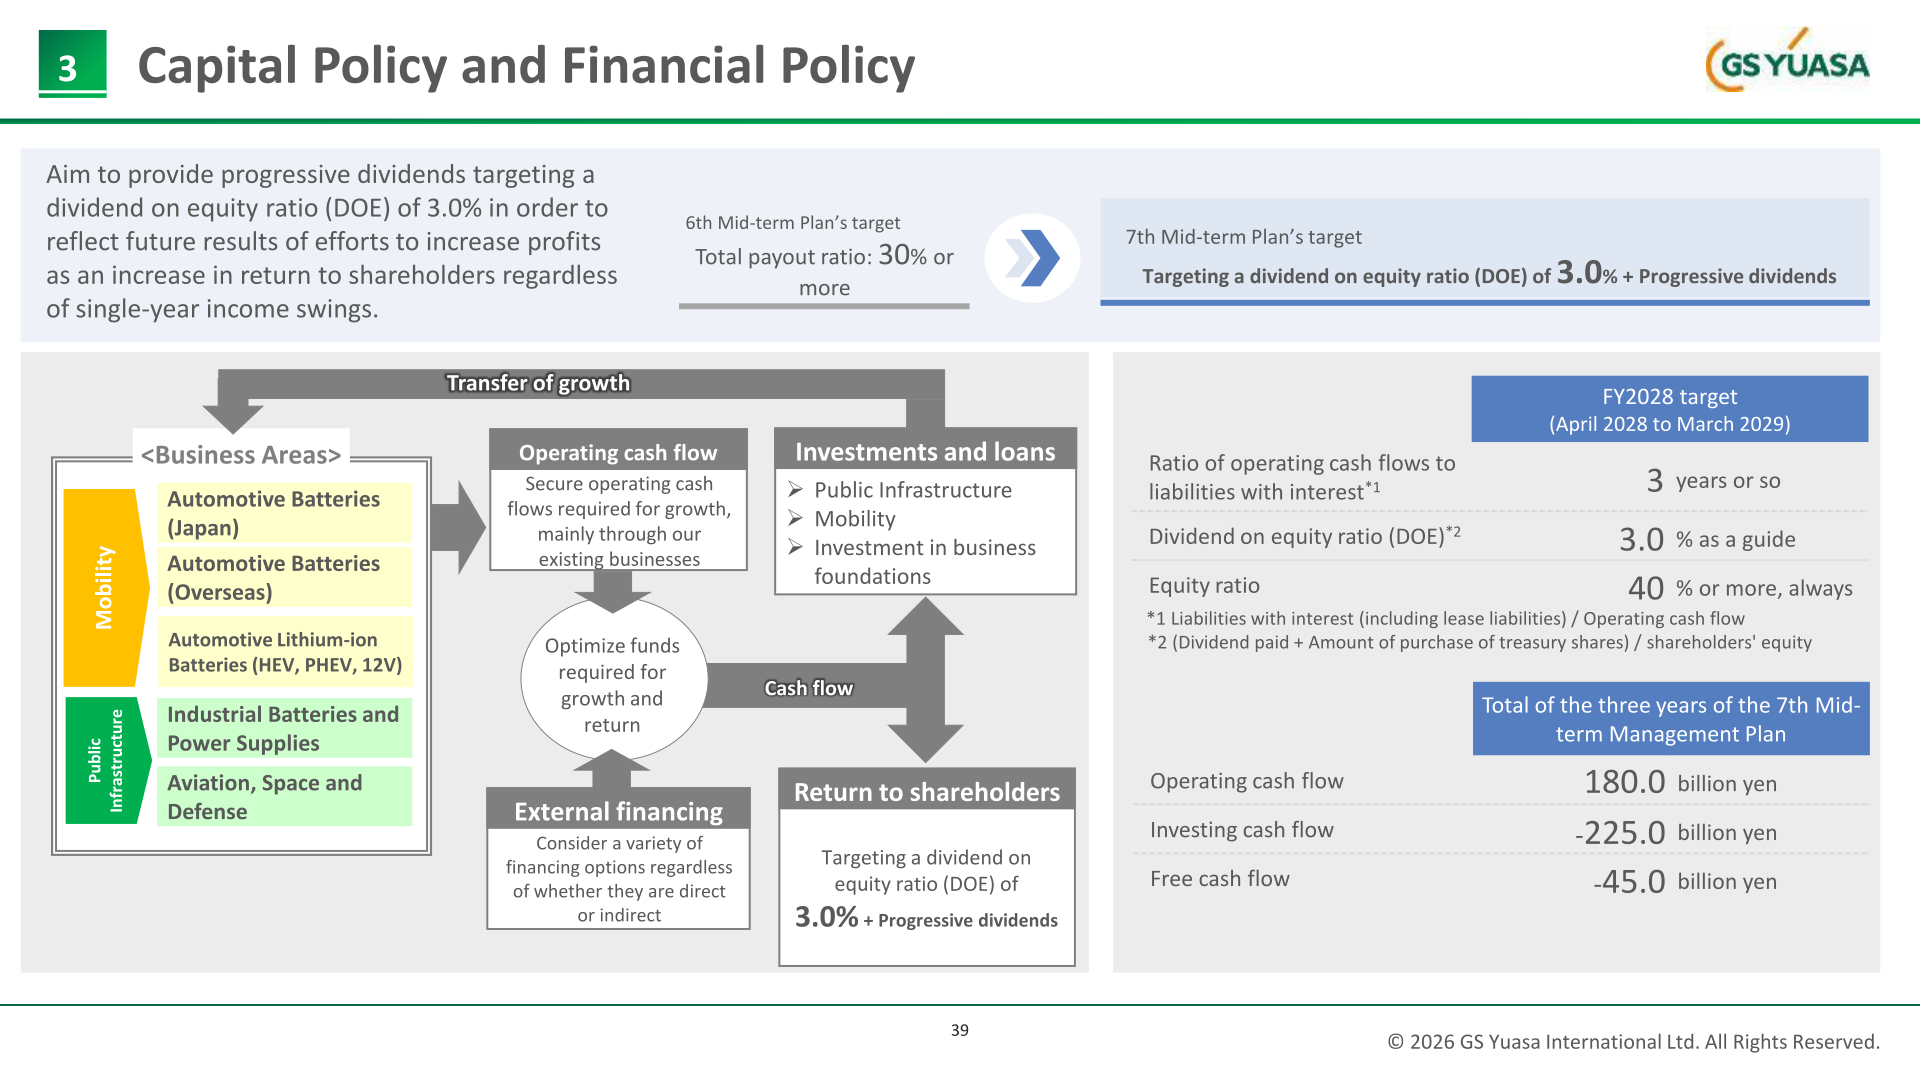
The annual dividend for FY2025 was ¥90 per share, up ¥15 from ¥75 in FY2024 and above the initial plan of ¥80. The total return ratio (based on profit before amortization of goodwill) was 21.2%, compared with 24.3% in FY2024 and the 6th Mid-term Plan target of 30% or more. For FY2026 the company plans cash dividends of ¥98 per share (+¥8), including an interim dividend of ¥30, and a DOE of 3.0%. Under the 7th Mid-term Management Plan, the shareholder return policy shifts from a total payout ratio target to progressive dividends targeting a dividend on equity ratio (DOE) of 3.0%, defined as (dividend paid + amount of purchase of treasury shares) / shareholders’ equity, so as to continue stable returns that are not affected by single-year income swings and to reflect future profit growth as higher returns. Treasury share purchases will be made flexibly considering the balance between financial health and investment opportunities. Of the approximately 255.0 billion yen of cash in over FY2026 to 2028 (operating CF 180.0 billion yen plus financing etc. 75.0 billion yen), approximately 30.0 billion yen is allocated to return to shareholders.
Medium-Term Plan / Topics
Review of the 6th Mid-term Management Plan (FY2023-2025): net sales of 609.0 billion yen were broadly in line with the initial target of 610.0 billion yen, while operating income before amortization of goodwill of 61.0 billion yen exceeded both the initial target of 41.0 billion yen and the revised target of 52.0 billion yen (+9.0 billion yen). ROE of 11.5% and ROIC of 14.8% exceeded targets of 8.0% and 10.0%, but the total payout ratio of 21.2% fell short of the 30.0% target. Cumulative operating cash flow over the three years was approximately 150.0 billion yen, about 2 times the 5th plan, and approximately 40.0 billion yen was raised through the issuance of new shares.
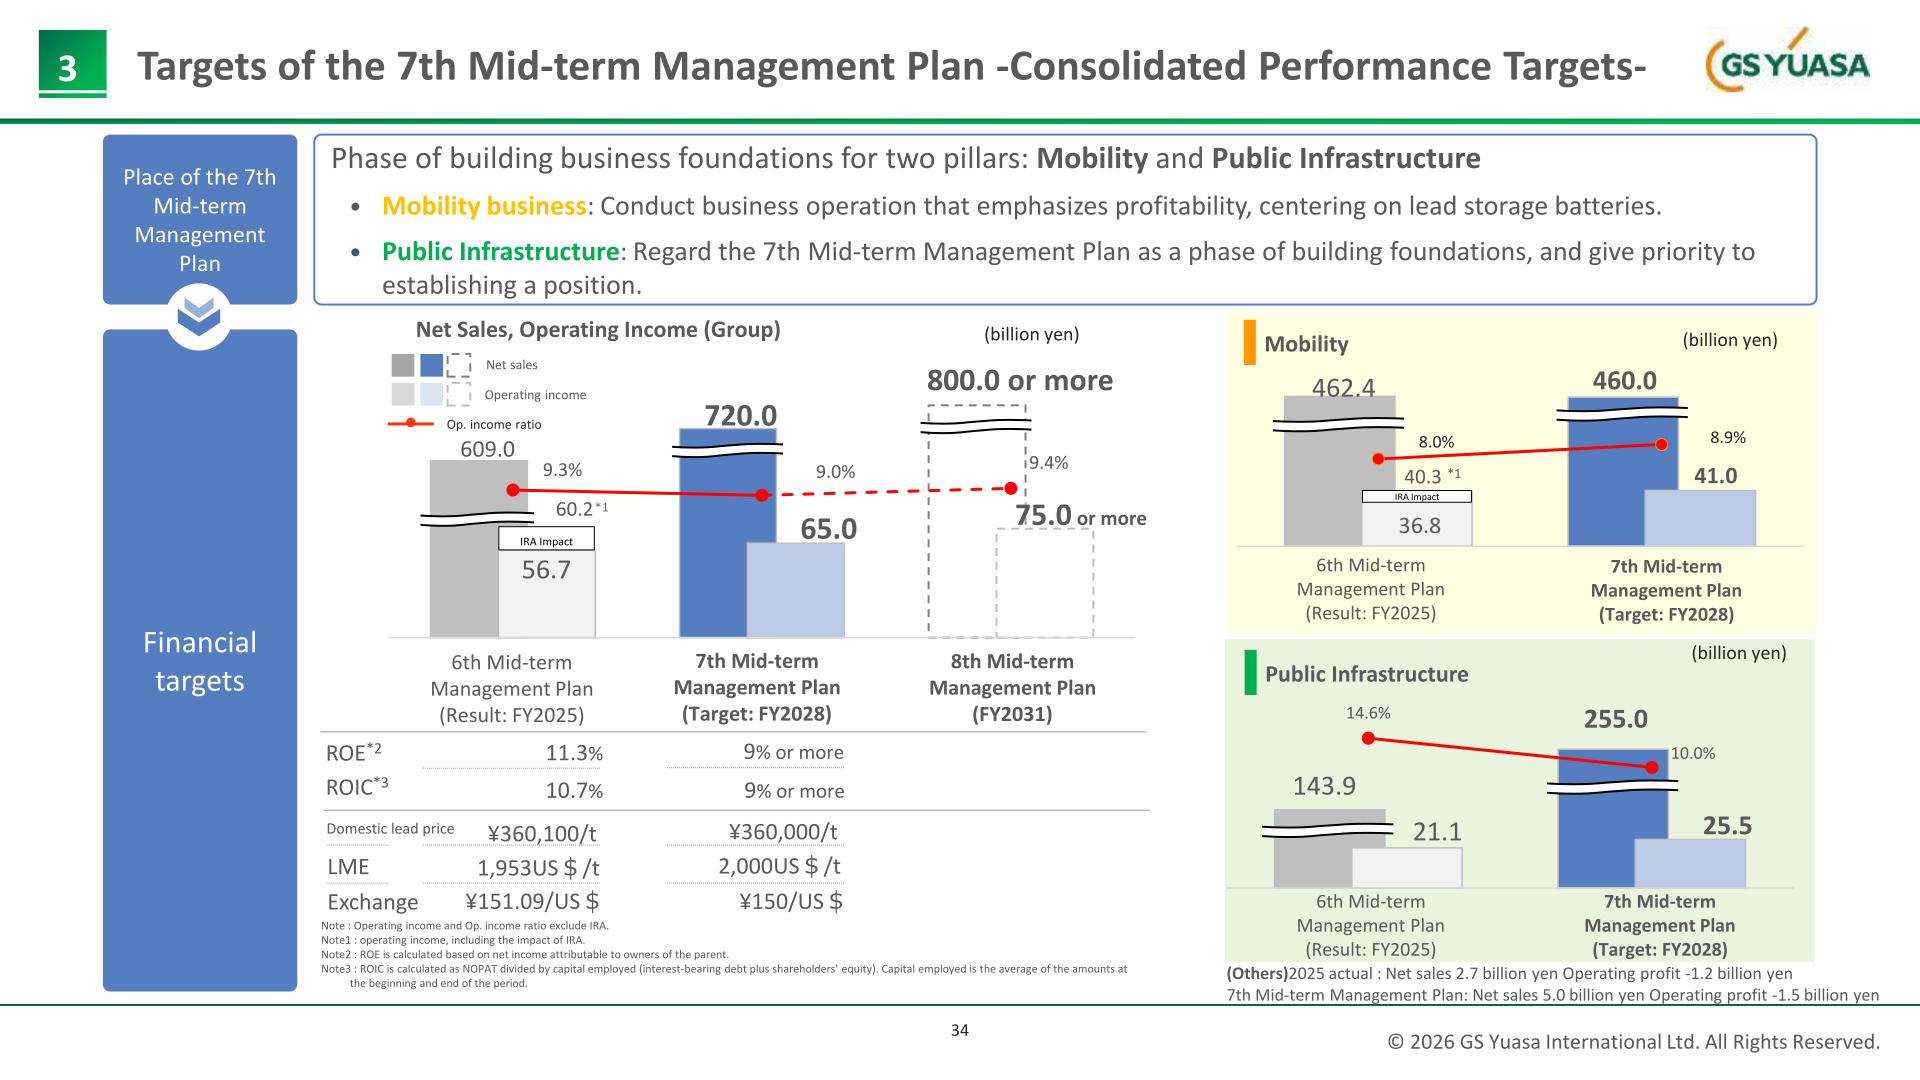
7th Mid-term Management Plan (FY2026-2028): the company defines its businesses as Mobility and Public Infrastructure and positions the plan as a phase of building business foundations for these two pillars. Financial targets for FY2028 are net sales of 720.0 billion yen (Mobility 460.0 billion yen, Public Infrastructure 255.0 billion yen, Others 5.0 billion yen) and operating income of 65.0 billion yen (Mobility 41.0 billion yen, Public Infrastructure 25.5 billion yen, Specialized Batteries and Others -1.5 billion yen), versus FY2025 results of 609.0 billion yen and 60.2 billion yen (56.7 billion yen excluding IRA). ROE is targeted at 9% or more and ROIC at 9% or more, with an equity ratio of 40% or more at all times and a ratio of interest-bearing liabilities to operating cash flow of 3 years or so. Three-year cash flow targets are operating cash flow of 180.0 billion yen, investing cash flow of -225.0 billion yen and free cash flow of -45.0 billion yen. Capital allocation of approximately 255.0 billion yen comprises growth investment in public infrastructure of 85.0 billion yen (new factories and equipment for infrastructure LiB, defense and specialized batteries), growth investment in mobility of 50.0 billion yen, investment in business foundations of 90.0 billion yen and shareholder returns of approximately 30.0 billion yen. Segment targets for FY2028 are: Automotive Batteries (Japan) net sales 120.0 / operating income 12.0 billion yen; Automotive Batteries (Overseas) 230.0 / 24.0; Automotive Lithium (HEV, PHEV, 12V) 110.0 / 5.0; Industrial Batteries and Power Supplies 230.0 / 23.0; Aviation, Space and Defense 25.0 / 2.5; Specialized Batteries and Others 5.0 / -1.5.
Updated Vision 2035: the net sales target of 800.0 billion yen, originally set for FY2035, is now expected to be achieved during the 8th Mid-term Management Plan period (until FY2031), and operating income of more than 75.0 billion yen is targeted for FY2031, with the profit contribution of Mobility and Public Infrastructure to reach 50:50 in FY2035. Key measures include expanding share in the domestic ESS market as a purely domestic manufacturer certified under the Plan for Securing the Supply of Storage Batteries, strengthening the business for AI-specific data centers (Japan and the United States), investing in a domestic LiB factory for infrastructure (operation from the second half of FY2028), increasing production of lithium-ion batteries for submarines and thermal batteries for defense, and, in Mobility, emphasizing profitability in lead-acid batteries, improving the operating ratio of existing HEV factories and reconsidering BEV plans given the slowdown in the BEV market.
This article is an analysis based on publicly available information and is not a recommendation to buy or sell any specific securities. Investment decisions are your own responsibility.
![[Obayashi] Investors’ Guide 2026 — The Complete 24-Article Breakdown](https://japan-equity.com/wp-content/uploads/2026/07/hub_cover-1024x1024.png)
![[Obayashi] IR & SR Policy — Feeding Dialogue Back into Management](https://japan-equity.com/wp-content/uploads/2026/07/p32_sq-1024x1024.jpg)
![[Obayashi] Real Estate Development — 18.7% Margin, ¥287.7bn Unrealized Gains](https://japan-equity.com/wp-content/uploads/2026/07/p20_sq-1024x1024.jpg)
![[Obayashi] Domestic Civil Engineering — Resilience Spending Supports 9.6% Margin](https://japan-equity.com/wp-content/uploads/2026/07/p11_sq-1024x1024.jpg)
![[Obayashi] Share Price & External Ratings — vs TOPIX, ESG Index Inclusion](https://japan-equity.com/wp-content/uploads/2026/07/p40_sq-1024x1024.jpg)
![[Construction] ¥75.5tn Investment, Shrinking Workforce — Big-5 Market Share](https://japan-equity.com/wp-content/uploads/2026/07/p12_sq-1024x1024.jpg)



![[Obayashi] Capital Policy & Shareholder Returns — ROE 10%+, DOE ~5%, ¥100bn Buyback](https://japan-equity.com/wp-content/uploads/2026/07/p27_sq-1024x1024.jpg)
![[Obayashi] Reducing Cross-Shareholdings — ¥285.2bn Sold in Five Years](https://japan-equity.com/wp-content/uploads/2026/07/p29_sq-1024x1024.jpg)
![[Obayashi] ¥750bn Investment Plan — ¥300bn to Development, ¥190bn to Tech/DX](https://japan-equity.com/wp-content/uploads/2026/07/p30_sq-1024x1024.jpg)
![[Obayashi] MTP2022 KPIs — Operating Profit ~2x Target, ROE 14.4%](https://japan-equity.com/wp-content/uploads/2026/07/p25_sq-1024x1024.jpg)
![[Obayashi] Cash Allocation — ¥420bn Investment CF Over Five Years](https://japan-equity.com/wp-content/uploads/2026/07/p26_sq-1024x1024.jpg)
![[Obayashi] Green Energy — 44 Plants, 344MW, and the Green Hydrogen Challenge](https://japan-equity.com/wp-content/uploads/2026/07/p21_sq-1024x1024.jpg)
![[Obayashi] Tackling the Labor Shortage — Robotics Construction®](https://japan-equity.com/wp-content/uploads/2026/07/p14_sq-1024x1024.jpg)
