
This article is based on publicly available IR materials and is not a recommendation to buy or sell any specific securities.
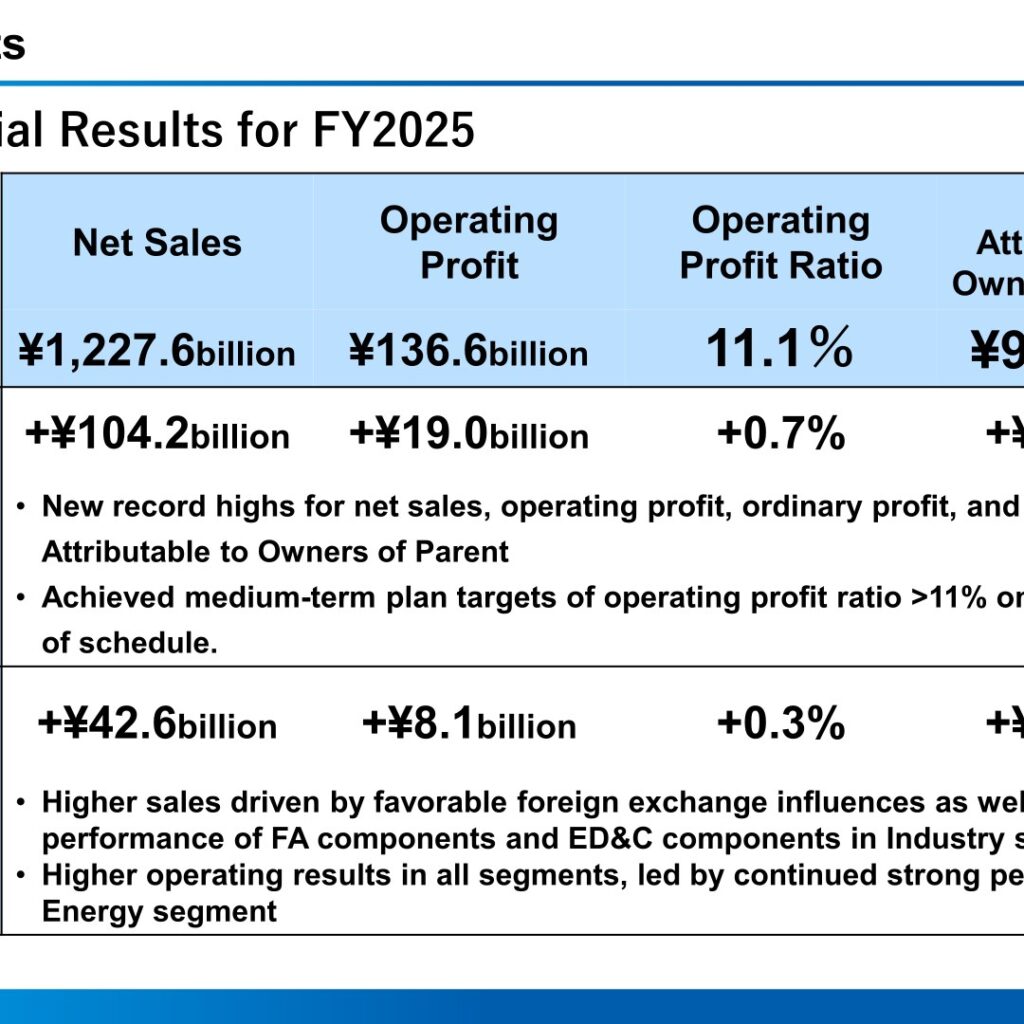
Fuji Electric Co., Ltd. (6504) announced its consolidated financial results for FY2025 (fiscal year ended March 31, 2026) on April 28, 2026, together with its Management Plan for FY2026. Net sales rose to ¥1,227.6 billion (+¥104.2 billion YoY), operating profit to ¥136.6 billion (+¥19.0 billion), and profit attributable to owners of parent to ¥98.0 billion (+¥5.8 billion), with new record highs for net sales, operating profit, ordinary profit, and profit attributable to owners of parent. The operating profit ratio reached 11.1%, achieving the medium-term plan target of an operating profit ratio of over 11% one year ahead of schedule. The company cites higher sales driven by favorable foreign exchange influences and strong performance of FA components and ED&C components in the Industry segment, and higher operating results in all segments led by continued strong performance in the Energy segment. This article is based on the company’s English-language presentations “Consolidated Financial Results for FY2025” and “Management Plan for FY2026”, both dated April 28, 2026; figures are in billion yen unless otherwise stated.
Consolidated Results (Full-Year Actual)
Net sales increased ¥104.2 billion YoY to ¥1,227.6 billion. Operating profit rose ¥19.0 billion to ¥136.6 billion, and the operating profit ratio improved 0.7 points to 11.1%. Ordinary profit increased ¥20.6 billion to ¥139.3 billion. Extraordinary profit fell ¥14.1 billion to ¥0.8 billion, reflecting the absence of the prior year’s gain on sales of investment securities (-12.5) and a decrease attributed to making Fuji Furukawa E&C Co., Ltd. a wholly owned subsidiary and others. Profit attributable to owners of parent rose ¥5.8 billion to ¥98.0 billion (8.0% of net sales). Results also came in above the January 29 forecast: net sales +¥42.6 billion versus ¥1,185.0 billion, operating profit +¥8.1 billion versus ¥128.5 billion, and profit attributable to owners of parent +¥9.0 billion versus ¥89.0 billion.
| Item (Billion yen) | FY2024 | FY2025 | Change |
|---|---|---|---|
| Net Sales | 1,123.4 | 1,227.6 | 104.2 |
| Operating Profit | 117.6 | 136.6 | 19.0 |
| Operating Profit Ratio | 10.5% | 11.1% | 0.7% |
| Ordinary Profit | 118.8 | 139.3 | 20.6 |
| Extraordinary Profit | 14.9 | 0.8 | -14.1 |
| Profit Before Income Taxes | 133.7 | 140.1 | 6.4 |
| Profit Attributable to Owners of Parent | 92.2 | 98.0 | 5.8 |
| Ratio of Profit Attributable to Owners of Parent | 8.2% | 8.0% | -0.2% |
In the breakdown of the ¥19.0 billion YoY change in operating profit, the company cites an increase in sales and production volumes (+27.5) and an exchange rate effect (+3.4) as positive factors, while an increase in fixed costs (-11.3, comprising labor costs -9.8, R&D -1.1, depreciation and leases paid -1.3, and other expenses +0.9) and added value and others (-0.6, comprising impacts of rising raw material costs -5.9 and differences in model mix, profitability between projects and cost reduction, others +5.3) weighed on profit. Average exchange rates for FY2025 were ¥150.77 to the US dollar (FY2024: ¥152.58), ¥174.79 to the euro (¥163.75), and ¥21.25 to the RMB (¥21.10).
Segment Results
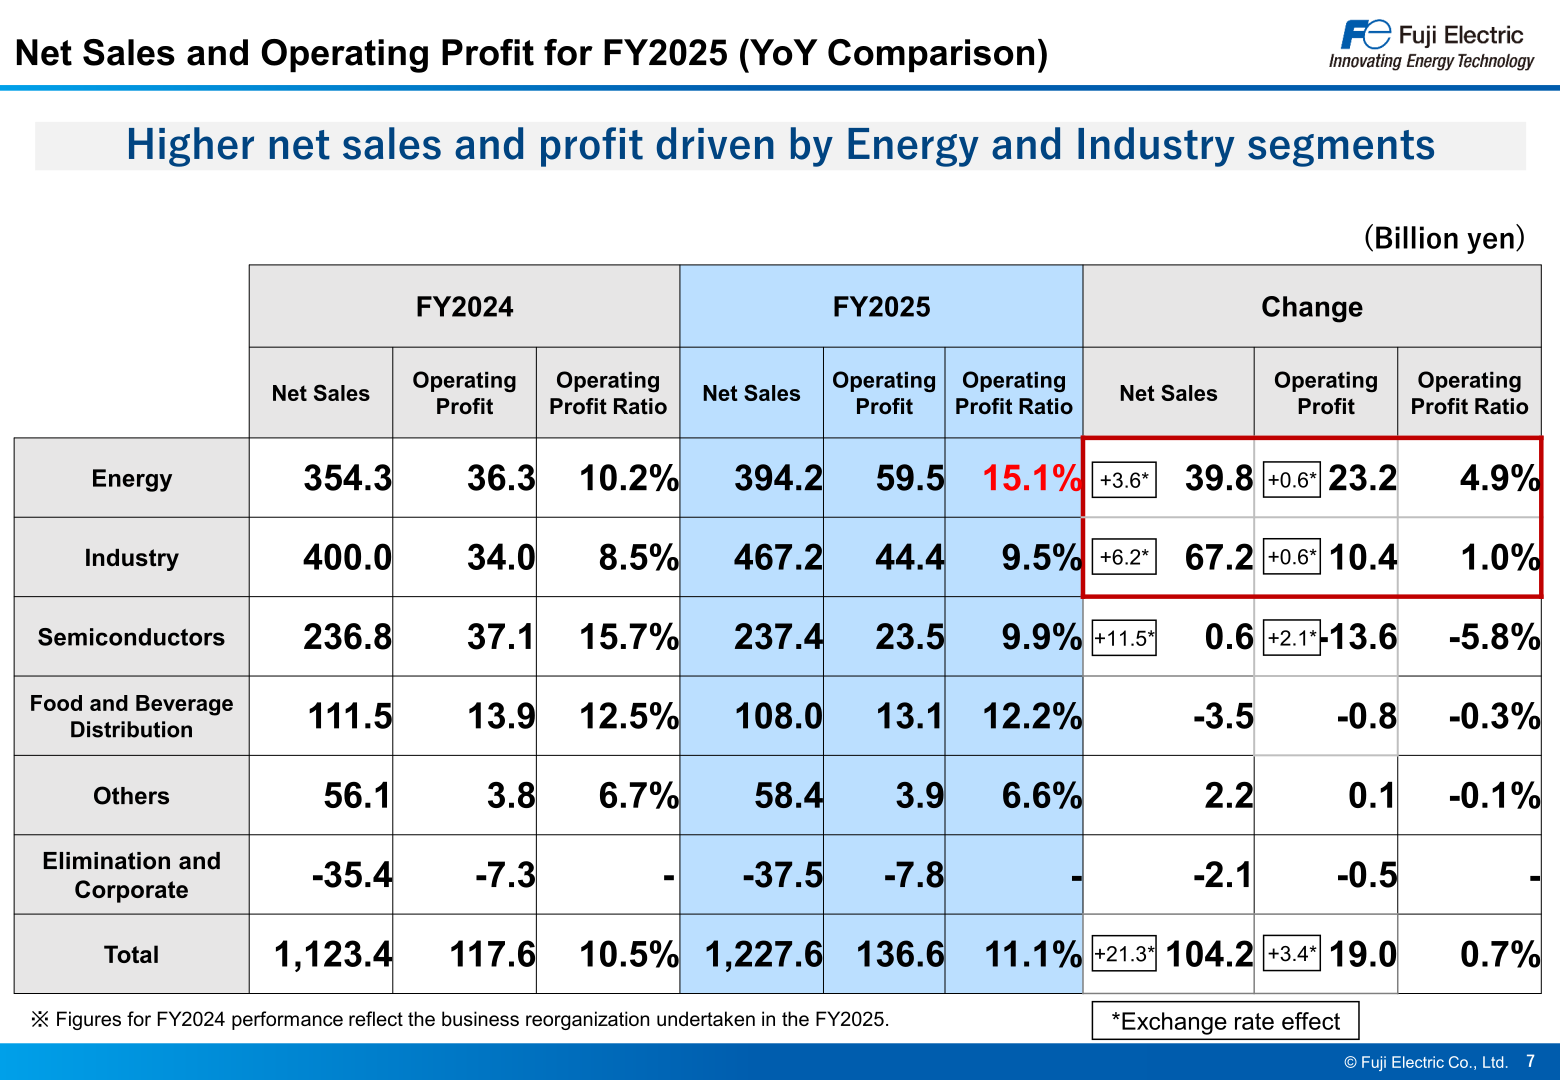
Net sales and operating profit increased in the Energy and Industry segments, which drove the overall results. In Energy, all subsegments posted higher sales and profit and the operating margin surpassed 15%, with net sales +9% in Power Generation, +22% in Energy Management, +10% in Power Supply and Facility Systems, and +6% in Equipment Construction. In Industry, all subsegments also posted higher sales and profit (Factory Automation Components +5%, Automation Systems +4%, Social Solutions +18%, ED&C Components +7%, IT Solutions +55%). In Semiconductors, net sales were largely unchanged while operating results worsened: industrial semiconductor sales rose to 119.7 (from 104.2) on higher demand in China and favorable foreign exchange, while automotive semiconductor sales fell to 117.7 (from 132.6) due to lower demand for power semiconductors for electrified vehicles and the selling price revisions instituted in the previous fiscal year. Food and Beverage Distribution saw lower net sales and operating results, with vending machine sales down 10% on lower domestic demand and store distribution sales up 2%. Figures for FY2024 reflect the business reorganization undertaken in FY2025.
| Segment (Billion yen) | Net Sales FY2024 | Net Sales FY2025 | Operating Profit FY2024 | Operating Profit FY2025 | Operating Profit Ratio FY2025 |
|---|---|---|---|---|---|
| Energy | 354.3 | 394.2 | 36.3 | 59.5 | 15.1% |
| Industry | 400.0 | 467.2 | 34.0 | 44.4 | 9.5% |
| Semiconductors | 236.8 | 237.4 | 37.1 | 23.5 | 9.9% |
| Food and Beverage Distribution | 111.5 | 108.0 | 13.9 | 13.1 | 12.2% |
| Others | 56.1 | 58.4 | 3.8 | 3.9 | 6.6% |
| Elimination and Corporate | -35.4 | -37.5 | -7.3 | -7.8 | – |
| Total | 1,123.4 | 1,227.6 | 117.6 | 136.6 | 11.1% |
Overseas sales rose ¥19.3 billion to 344.8 (of which exchange rate effect +21.3), with Asia excluding China up to 124.5 (from 113.0), China up to 112.1 (from 98.9), Europe up to 42.1 (from 40.2), and the Americas down to 35.0 (from 44.9); the company notes that overseas sales declined excluding foreign exchange impacts, while Asia and others increased, driven by the Energy segment. Orders received for FY2025 totaled 1,350.2, up ¥132.9 billion from 1,217.3, with plant and systems orders rising to 821.5 (from 726.1) on strong performance in the Energy and Industry segments. Capital investment for FY2025 was 56.7 (FY2024: 85.2), with Semiconductors investment falling to 34.9 from 64.4, and R&D expenditure was 38.9 (FY2024: 37.8).
Balance Sheet and Cash Flow
Total assets at March 31, 2026 were 1,406.7, up ¥94.5 billion from 1,312.2, which the company attributes primarily to higher receivables and inventory from the strong plant and system business, as well as the market valuation of investment securities. Total net assets were 842.9 (up 112.3), the equity ratio rose to 56.9% (from 52.7%), and net interest-bearing debt fell to 19.2 (from 42.2), with a net D/E ratio of 0.0 times. ROE was 13.1% (FY2024: 14.3%) and ROIC 12.6% (12.9%). The R&I credit rating moved from A to A+. Cash flows from operating activities were 123.6 (FY2024: 144.9), decreasing due to an increase in accounts receivable-trade; cash flows from investing activities were -72.6 (-63.4); and free cash flow was 51.0 (81.5).
FY2026 Management Plan (Forecast)
For FY2026 (fiscal year ending March 31, 2027), the company’s Management Plan targets net sales of ¥1,275.0 billion (+¥47.4 billion YoY), operating profit of ¥142.5 billion (+¥5.9 billion), an operating profit ratio of 11.2%, ordinary profit of ¥143.0 billion (+3.7), and profit attributable to owners of parent of ¥105.0 billion (+¥7.0 billion), again targeting record-breaking net sales, operating profit, ordinary profit, and profit attributable to owners of parent, and striving to meet all major targets of the Medium-Term Management Plan. Growth in net sales and operating profit is expected to be supported by the Energy segment. Assumed exchange rates are ¥150.00 to the US dollar, ¥175.00 to the euro, and ¥21.90 to the RMB; the exchange rate effect on the plan is -12.3 on net sales and -1.8 on operating profit. Regarding the Middle East situation, the company states that direct impacts currently anticipated are reflected in the 1Q management plan and that the overall impact is minor. Planned financial indicators are ROE 12.8%, ROIC 12.6%, and an equity ratio of 57.8%.
| Item (Billion yen) | FY2025 Results | FY2026 Management Plan | Change |
|---|---|---|---|
| Net Sales | 1,227.6 | 1,275.0 | 47.4 |
| Operating Profit | 136.6 | 142.5 | 5.9 |
| Operating Profit Ratio | 11.1% | 11.2% | 0.0% |
| Ordinary Profit | 139.3 | 143.0 | 3.7 |
| Profit Attributable to Owners of Parent | 98.0 | 105.0 | 7.0 |
| Ratio of Profit Attributable to Owners of Parent to Net Sales | 8.0% | 8.2% | 0.2% |
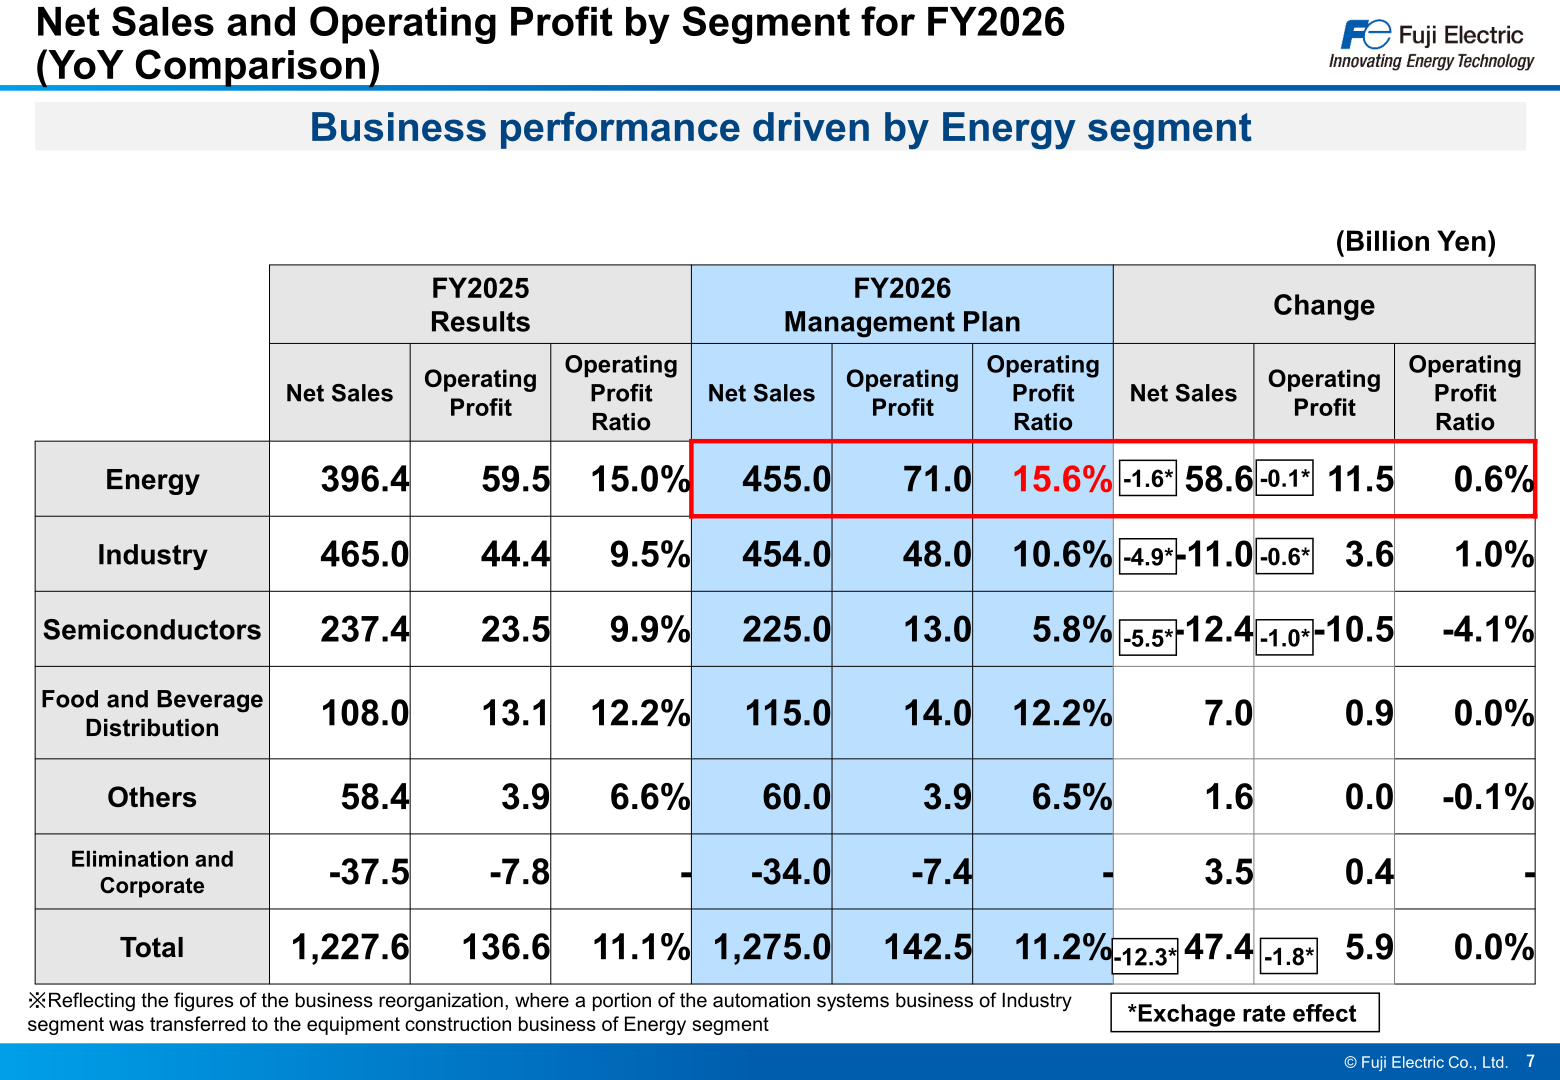
By segment, Energy is planned to post higher sales and profit in all subsegments, driven by increased demand for energy storage systems, industrial substation and power supply equipment in the energy management business, and increased data center demand in the power supply and facility systems business. Industry is expected to see lower sales due to the absence of large-scale IT solutions projects recorded in the previous fiscal year, but higher profit. Semiconductors is expected to see lower sales and profit, mainly due to rising raw material prices and lower sales of automotive semiconductors, partly offset by higher industrial semiconductor sales on demand for data centers and semiconductor manufacturing equipment. Food and Beverage Distribution is planned to see higher sales and profit in both the vending machine and store distribution businesses. Note that the FY2025 segment figures in the Management Plan for Energy (396.4) and Industry (465.0) reflect a business reorganization in which a portion of the automation systems business of the Industry segment was transferred to the equipment construction business of the Energy segment, and therefore differ from the figures in the results presentation (394.2 and 467.2).
| Segment (Billion yen) | Net Sales FY2025 Results | Net Sales FY2026 Plan | Operating Profit FY2025 Results | Operating Profit FY2026 Plan |
|---|---|---|---|---|
| Energy | 396.4 | 455.0 | 59.5 | 71.0 |
| Industry | 465.0 | 454.0 | 44.4 | 48.0 |
| Semiconductors | 237.4 | 225.0 | 23.5 | 13.0 |
| Food and Beverage Distribution | 108.0 | 115.0 | 13.1 | 14.0 |
| Others | 58.4 | 60.0 | 3.9 | 3.9 |
| Elimination and Corporate | -37.5 | -34.0 | -7.8 | -7.4 |
| Total | 1,227.6 | 1,275.0 | 136.6 | 142.5 |
Capital investment for FY2026 is planned at 56.0 (FY2025: 56.7), continuing investment to augment Energy segment production capacity while coordinating the execution of Semiconductors segment investment in light of customer demand, and R&D expenditure is planned at 41.6 (FY2025: 38.9). For the first half of FY2026, the company forecasts net sales of 569.0, operating profit of 44.0, and profit attributable to owners of parent of 33.5.
Shareholder Returns
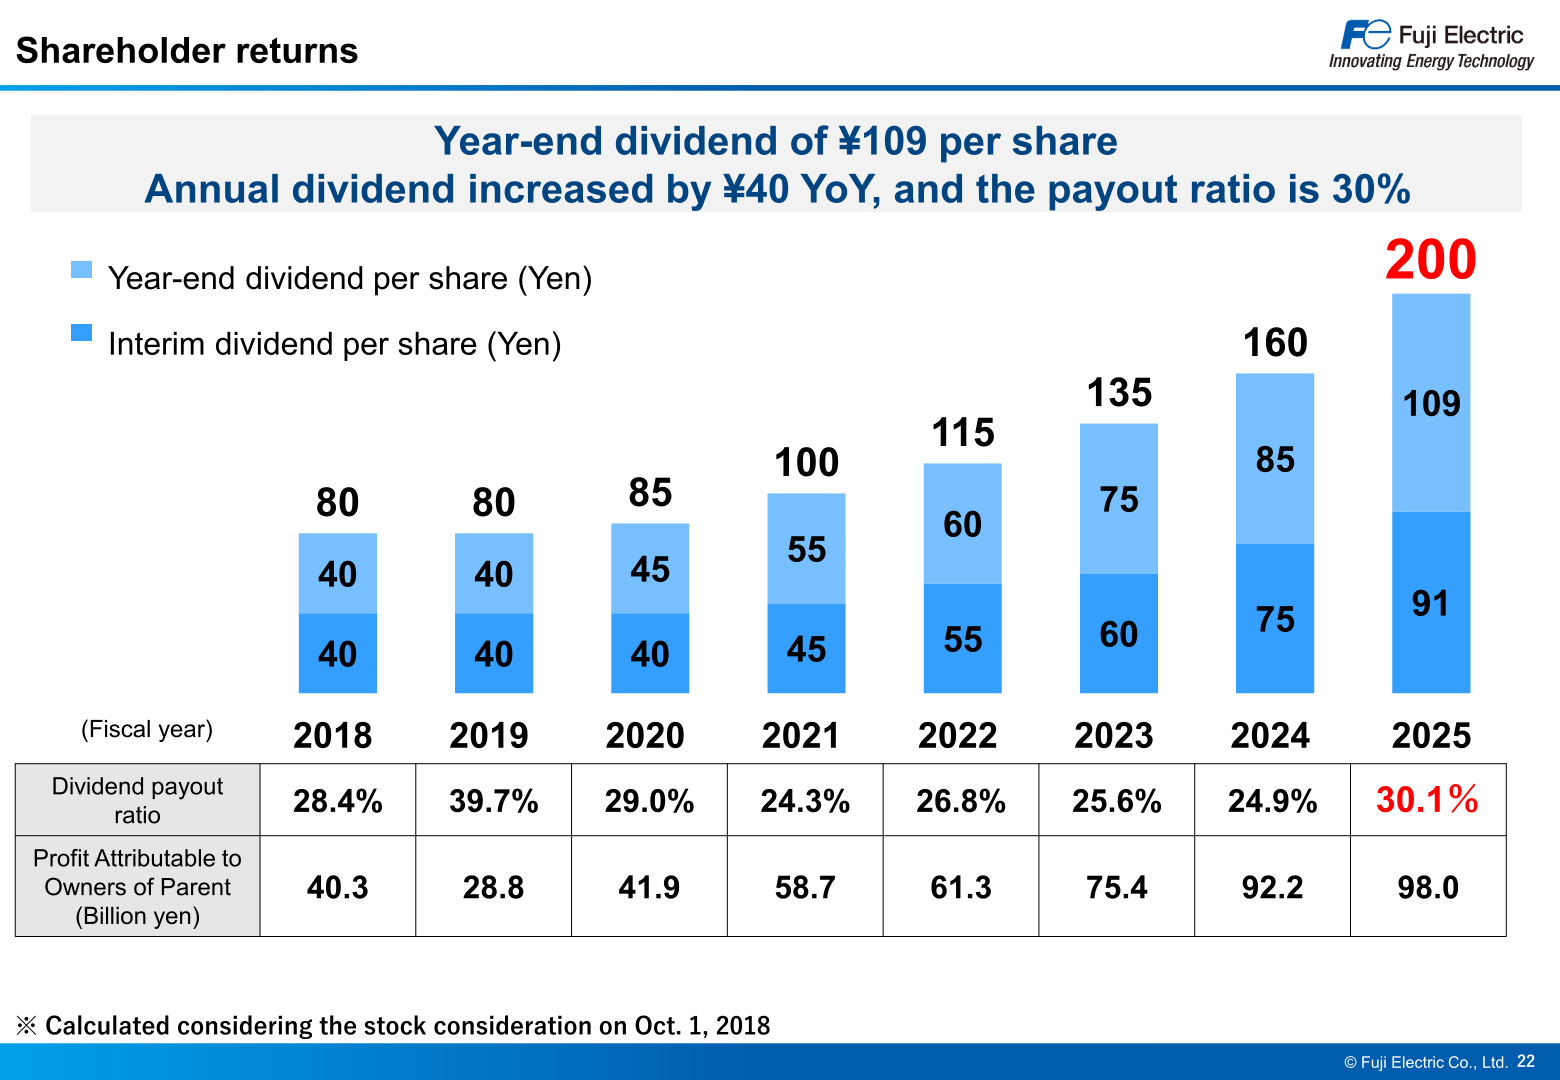
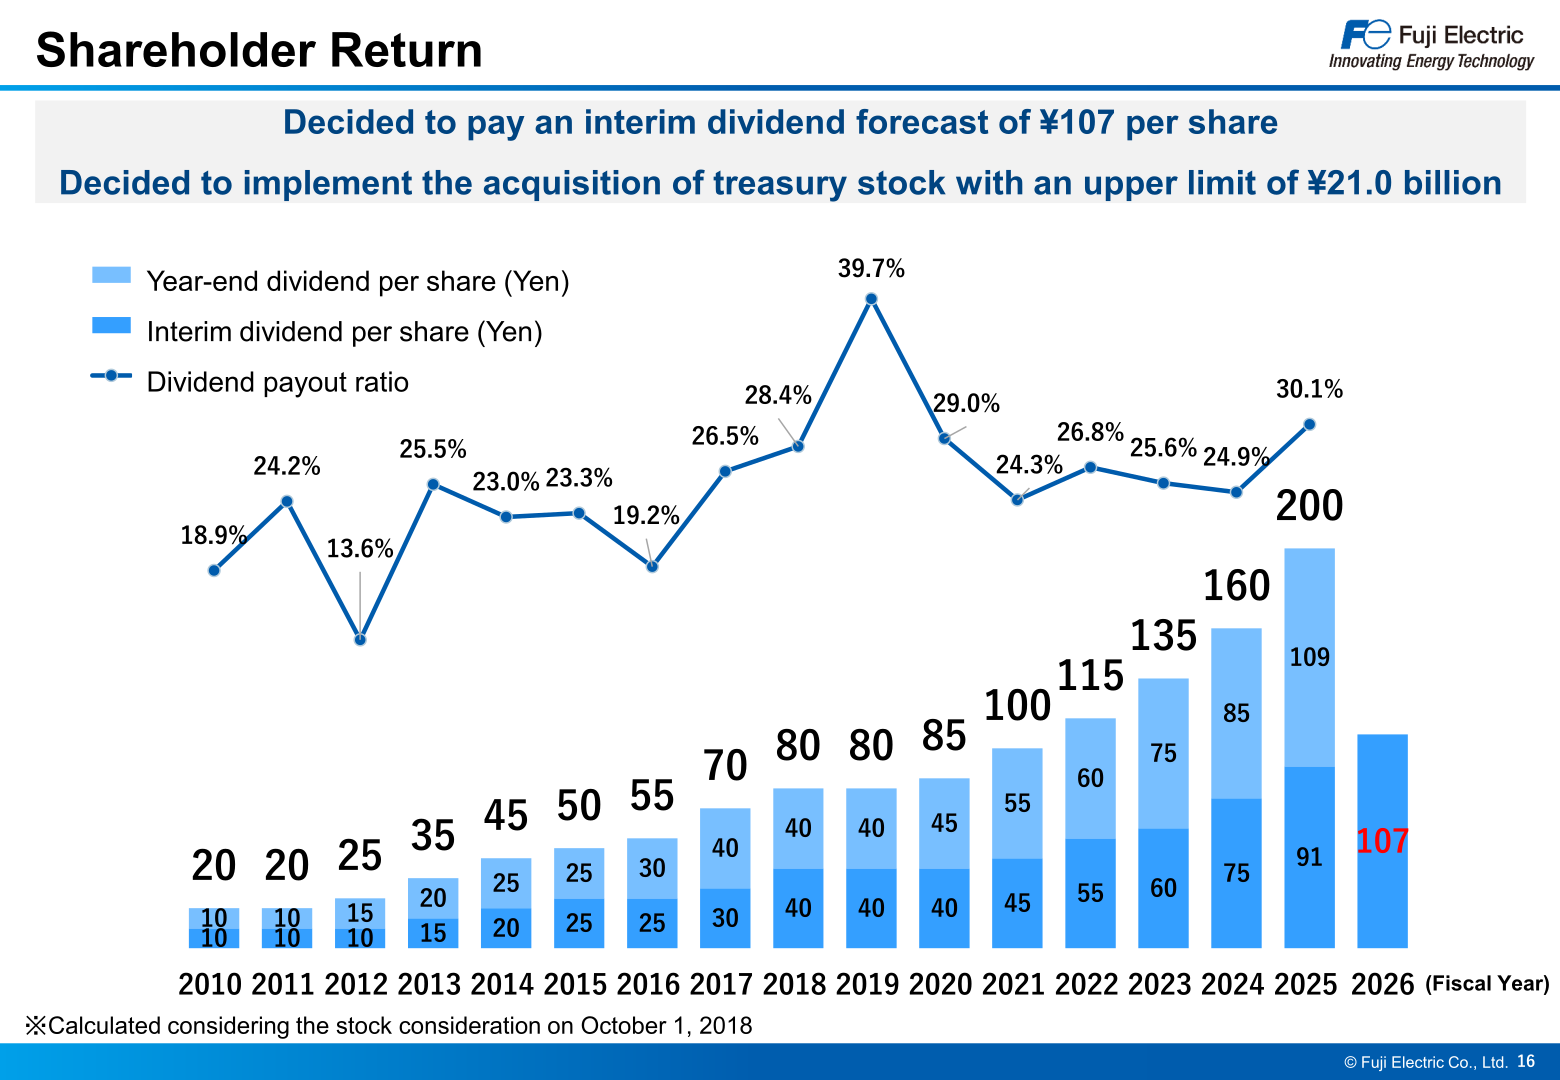
For FY2025, the year-end dividend is ¥109 per share, bringing the annual dividend to ¥200 per share (interim ¥91 plus year-end ¥109), an increase of ¥40 YoY from ¥160, with a dividend payout ratio of 30.1%. For FY2026, the company has decided on an interim dividend forecast of ¥107 per share, pursuing a full-year dividend payout ratio target of 30%, and has decided to implement the acquisition of treasury stock with an upper limit of ¥21.0 billion.
| Item | FY2024 | FY2025 | FY2026 (Forecast) |
|---|---|---|---|
| Interim dividend per share (Yen) | 75 | 91 | 107 |
| Year-end dividend per share (Yen) | 85 | 109 | – |
| Annual dividend per share (Yen) | 160 | 200 | – |
| Dividend payout ratio | 24.9% | 30.1% | 30% (target) |
This article is an analysis based on publicly available information and is not a recommendation to buy or sell any specific securities. Investment decisions are your own responsibility.
![[Obayashi] Investors’ Guide 2026 — The Complete 24-Article Breakdown](https://japan-equity.com/wp-content/uploads/2026/07/hub_cover-1024x1024.png)
![[Obayashi] IR & SR Policy — Feeding Dialogue Back into Management](https://japan-equity.com/wp-content/uploads/2026/07/p32_sq-1024x1024.jpg)
![[Obayashi] Real Estate Development — 18.7% Margin, ¥287.7bn Unrealized Gains](https://japan-equity.com/wp-content/uploads/2026/07/p20_sq-1024x1024.jpg)
![[Obayashi] Domestic Civil Engineering — Resilience Spending Supports 9.6% Margin](https://japan-equity.com/wp-content/uploads/2026/07/p11_sq-1024x1024.jpg)
![[Obayashi] Share Price & External Ratings — vs TOPIX, ESG Index Inclusion](https://japan-equity.com/wp-content/uploads/2026/07/p40_sq-1024x1024.jpg)
![[Construction] ¥75.5tn Investment, Shrinking Workforce — Big-5 Market Share](https://japan-equity.com/wp-content/uploads/2026/07/p12_sq-1024x1024.jpg)



![[Obayashi] Capital Policy & Shareholder Returns — ROE 10%+, DOE ~5%, ¥100bn Buyback](https://japan-equity.com/wp-content/uploads/2026/07/p27_sq-1024x1024.jpg)
![[Obayashi] Reducing Cross-Shareholdings — ¥285.2bn Sold in Five Years](https://japan-equity.com/wp-content/uploads/2026/07/p29_sq-1024x1024.jpg)
![[Obayashi] ¥750bn Investment Plan — ¥300bn to Development, ¥190bn to Tech/DX](https://japan-equity.com/wp-content/uploads/2026/07/p30_sq-1024x1024.jpg)
![[Obayashi] MTP2022 KPIs — Operating Profit ~2x Target, ROE 14.4%](https://japan-equity.com/wp-content/uploads/2026/07/p25_sq-1024x1024.jpg)
![[Obayashi] Cash Allocation — ¥420bn Investment CF Over Five Years](https://japan-equity.com/wp-content/uploads/2026/07/p26_sq-1024x1024.jpg)
![[Obayashi] Green Energy — 44 Plants, 344MW, and the Green Hydrogen Challenge](https://japan-equity.com/wp-content/uploads/2026/07/p21_sq-1024x1024.jpg)
![[Obayashi] Tackling the Labor Shortage — Robotics Construction®](https://japan-equity.com/wp-content/uploads/2026/07/p14_sq-1024x1024.jpg)
