
This article is based on publicly available IR materials and is not a recommendation to buy or sell any specific securities.
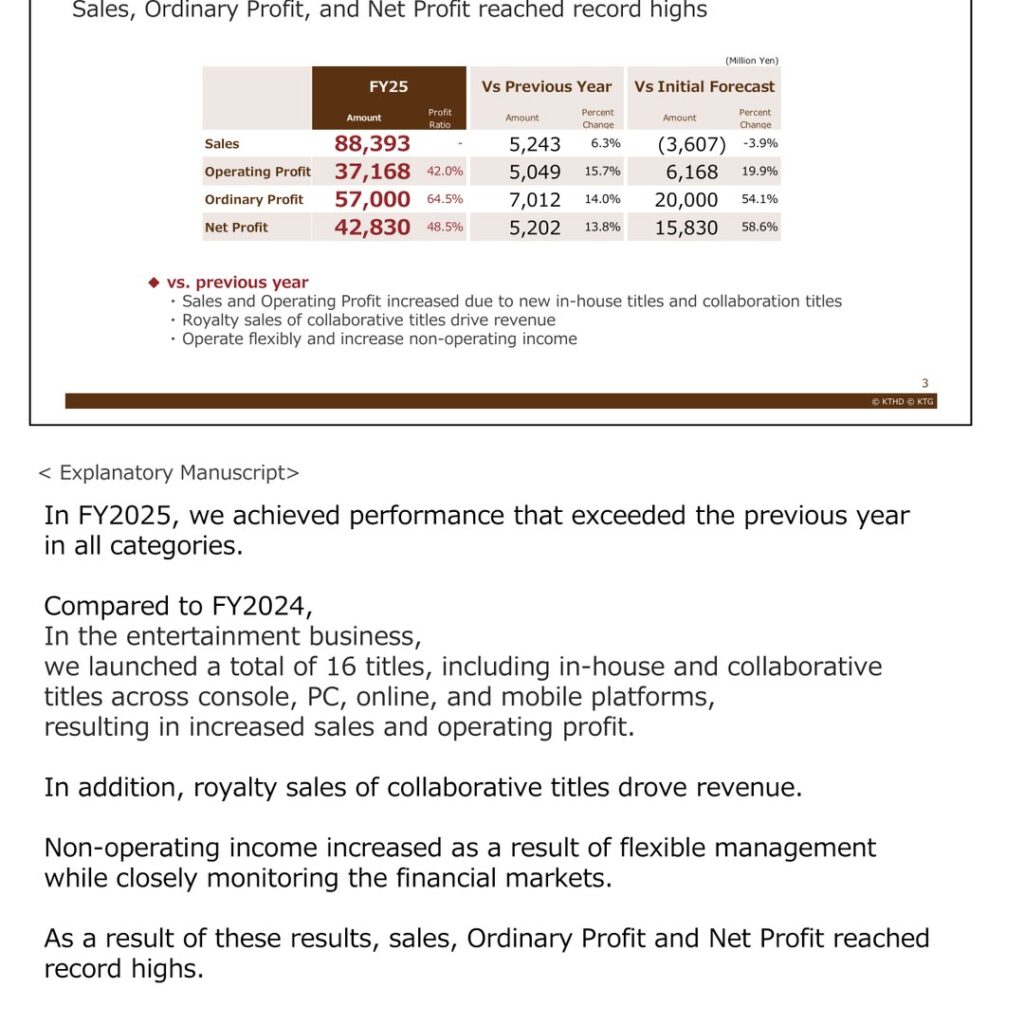
Koei Tecmo Holdings reported consolidated results for the fiscal year ended March 2026 in its English-language results briefing materials. Sales rose 6.3% year on year to 88,393 million yen and operating profit rose 15.7% to 37,168 million yen, and the company states that sales, ordinary profit, and net profit all reached record highs. During the year the group launched a total of 16 titles, including in-house and collaborative titles, across console, PC, online, and mobile platforms, and royalty sales of collaborative titles drove revenue.
Note: The source deck is titled “Financial Results Briefing Materials for the Fiscal Year Ending March 2026”; the company labels this fiscal year FY2025 (FY25) and the following fiscal year FY2026 (FY26), and those labels are retained below.
Consolidated Results (Full-Year Actual)
All profit lines exceeded the prior year. Operating profit corresponded to a profit ratio of 42.0% of sales, with ordinary profit at a 64.5% ratio and net profit at 48.5%, helped by an increase in non-operating income from what the company describes as flexible management while closely monitoring the financial markets. Against the initial forecast, sales finished 3,607 million yen lower (-3.9%), while operating profit exceeded the initial forecast by 6,168 million yen (19.9%), ordinary profit by 20,000 million yen (54.1%), and net profit by 15,830 million yen (58.6%).
| Item (Million Yen) | FY25 | Vs Previous Year | Change % | Vs Initial Forecast | Change % |
|---|---|---|---|---|---|
| Sales | 88,393 | 5,243 | 6.3% | (3,607) | -3.9% |
| Operating Profit | 37,168 | 5,049 | 15.7% | 6,168 | 19.9% |
| Ordinary Profit | 57,000 | 7,012 | 14.0% | 20,000 | 54.1% |
| Net Profit | 42,830 | 5,202 | 13.8% | 15,830 | 58.6% |
Unit sales for the year totaled 14.1 million units (14,100 thousand units), up 84.8% from 7,630 thousand units in FY24, with an overseas ratio of 70.3% and a download ratio of 61.8%. Cumulative global downloads of mobile titles operated in-house or under IP license reached 171.4 million (171,400 thousand), up 3.4% year on year. On costs, employment costs increased to 26,800 million yen in line with the plan, outsourcing costs decreased to 5,470 million yen due to improvements in the operation of mobile titles, advertising costs increased to 3,240 million yen on new product launches, and consolidated headcount (excluding temporary employees) rose by 151 to 2,835.
Segment Results
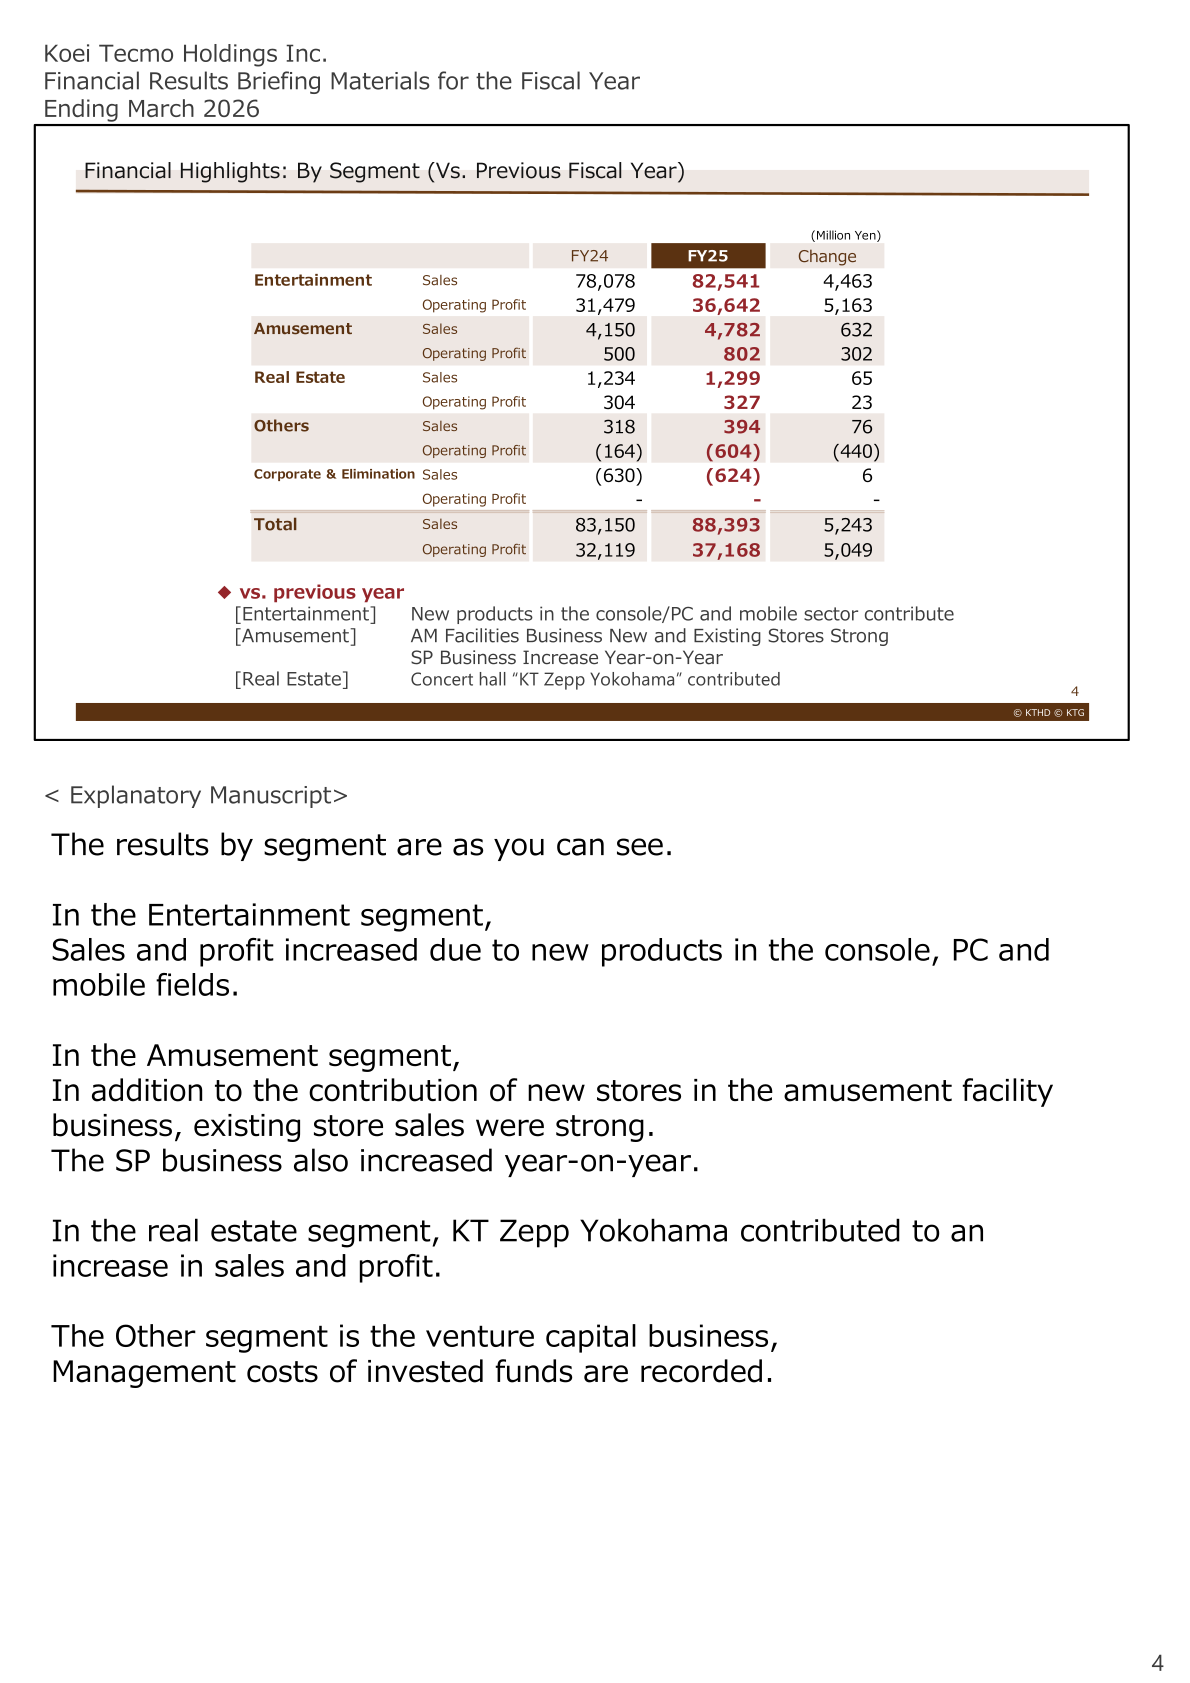
In the Entertainment segment, sales and profit increased on new products in the console, PC, and mobile fields. In the Amusement segment, new stores in the amusement facility business contributed, existing store sales were strong, and the SP business also increased year on year. In the Real Estate segment, the concert hall “KT Zepp Yokohama” contributed to higher sales and profit. The Others segment is the venture capital business, where management costs of invested funds are recorded.
| Segment (Million Yen) | Metric | FY24 | FY25 | Change |
|---|---|---|---|---|
| Entertainment | Sales | 78,078 | 82,541 | 4,463 |
| Entertainment | Operating Profit | 31,479 | 36,642 | 5,163 |
| Amusement | Sales | 4,150 | 4,782 | 632 |
| Amusement | Operating Profit | 500 | 802 | 302 |
| Real Estate | Sales | 1,234 | 1,299 | 65 |
| Real Estate | Operating Profit | 304 | 327 | 23 |
| Others | Sales | 318 | 394 | 76 |
| Others | Operating Profit | (164) | (604) | (440) |
| Corporate & Elimination | Sales | (630) | (624) | 6 |
| Total | Sales | 83,150 | 88,393 | 5,243 |
| Total | Operating Profit | 32,119 | 37,168 | 5,049 |
Within the Entertainment segment, Console/PC sales rose to 46,910 million yen on the release of 14 new titles, including 4 large titles — “NINJA GAIDEN 4”, “Hyrule Warriors: Age of Imprisonment”, “Nioh 3”, and “Pokémon Pokopia” — as well as strong performance of back catalog titles. Online/Mobile sales declined to 34,330 million yen, although new in-house and licensed titles that started distribution in the third quarter contributed and the company says overall sales in the field are stabilizing.
| Entertainment Revenue (Million Yen) | FY24 | FY25 | Change |
|---|---|---|---|
| Console/PC: Package etc. | 15,540 | 19,618 | 4,078 |
| Console/PC: DL | 22,070 | 24,918 | 2,848 |
| Console/PC: DLC | 1,910 | 2,374 | 464 |
| Console/PC subtotal | 39,520 | 46,910 | 7,390 |
| Online/Mobile: Online | 380 | 300 | (80) |
| Online/Mobile: Mobile | 37,180 | 34,030 | (3,150) |
| Online/Mobile subtotal | 37,560 | 34,330 | (3,230) |
| Events & Goods | 1,000 | 1,300 | 300 |
| Entertainment segment sales | 78,078 | 82,541 | 4,463 |
FY2026 Forecast
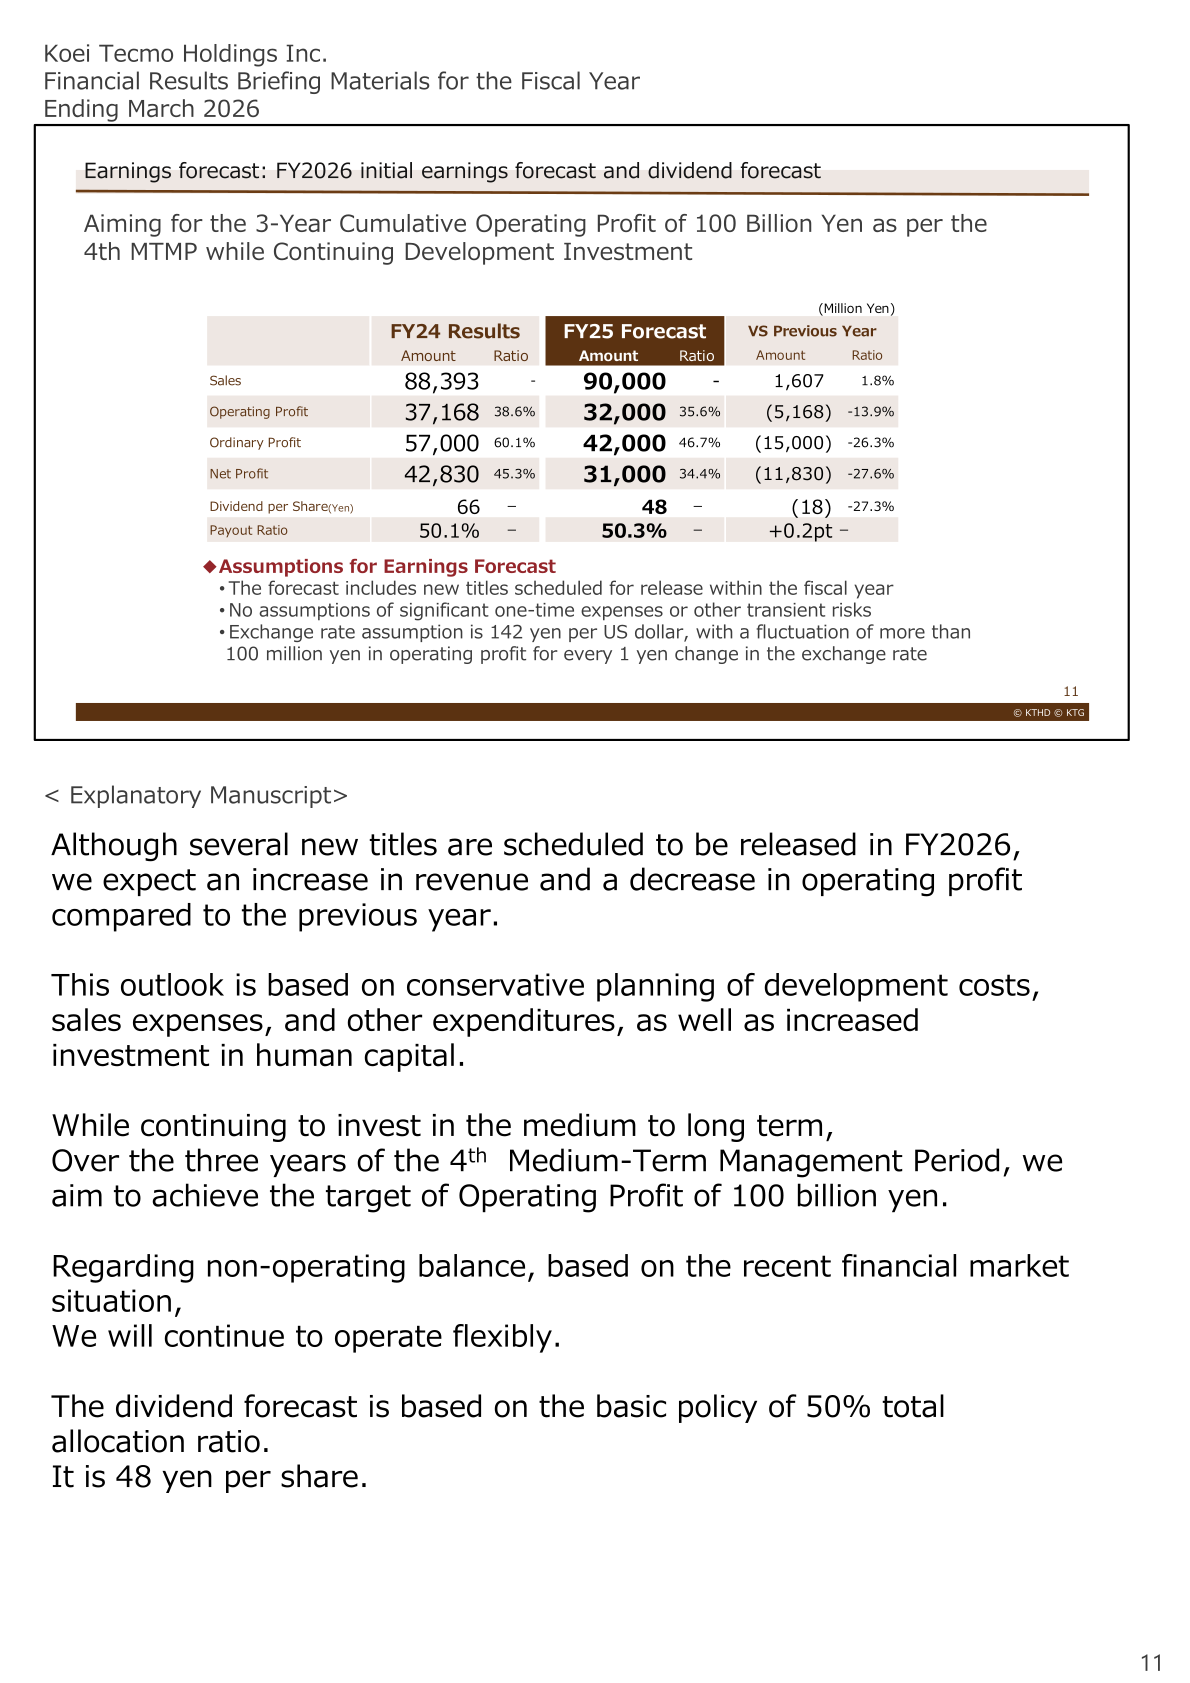
For FY2026, the company forecasts sales of 90,000 million yen (up 1.8%), operating profit of 32,000 million yen (down 13.9%), ordinary profit of 42,000 million yen (down 26.3%), and net profit of 31,000 million yen (down 27.6%). Although several new titles are scheduled for release, the outlook is based on conservative planning of development costs, sales expenses, and other expenditures, as well as increased investment in human capital. The exchange rate assumption is 142 yen per US dollar, with a fluctuation of more than 100 million yen in operating profit for every 1 yen change. In the Entertainment segment, the plan focuses primarily on in-house titles and plans collaboration titles conservatively, so higher revenue and lower profit are anticipated. The console/PC unit sales plan is 10 million units (10,000 thousand units), with an overseas component ratio of 72.0% and a download ratio of 65.0%.
| Item (Million Yen) | FY25 Actual | FY26 Forecast | Change | Change % |
|---|---|---|---|---|
| Sales | 88,393 | 90,000 | 1,607 | 1.8% |
| Operating Profit | 37,168 | 32,000 | (5,168) | -13.9% |
| Ordinary Profit | 57,000 | 42,000 | (15,000) | -26.3% |
| Net Profit | 42,830 | 31,000 | (11,830) | -27.6% |
| Dividend per Share (Yen) | 66 | 48 | (18) | -27.3% |
| Payout Ratio | 50.1% | 50.3% | +0.2pt | – |
Shareholder Returns
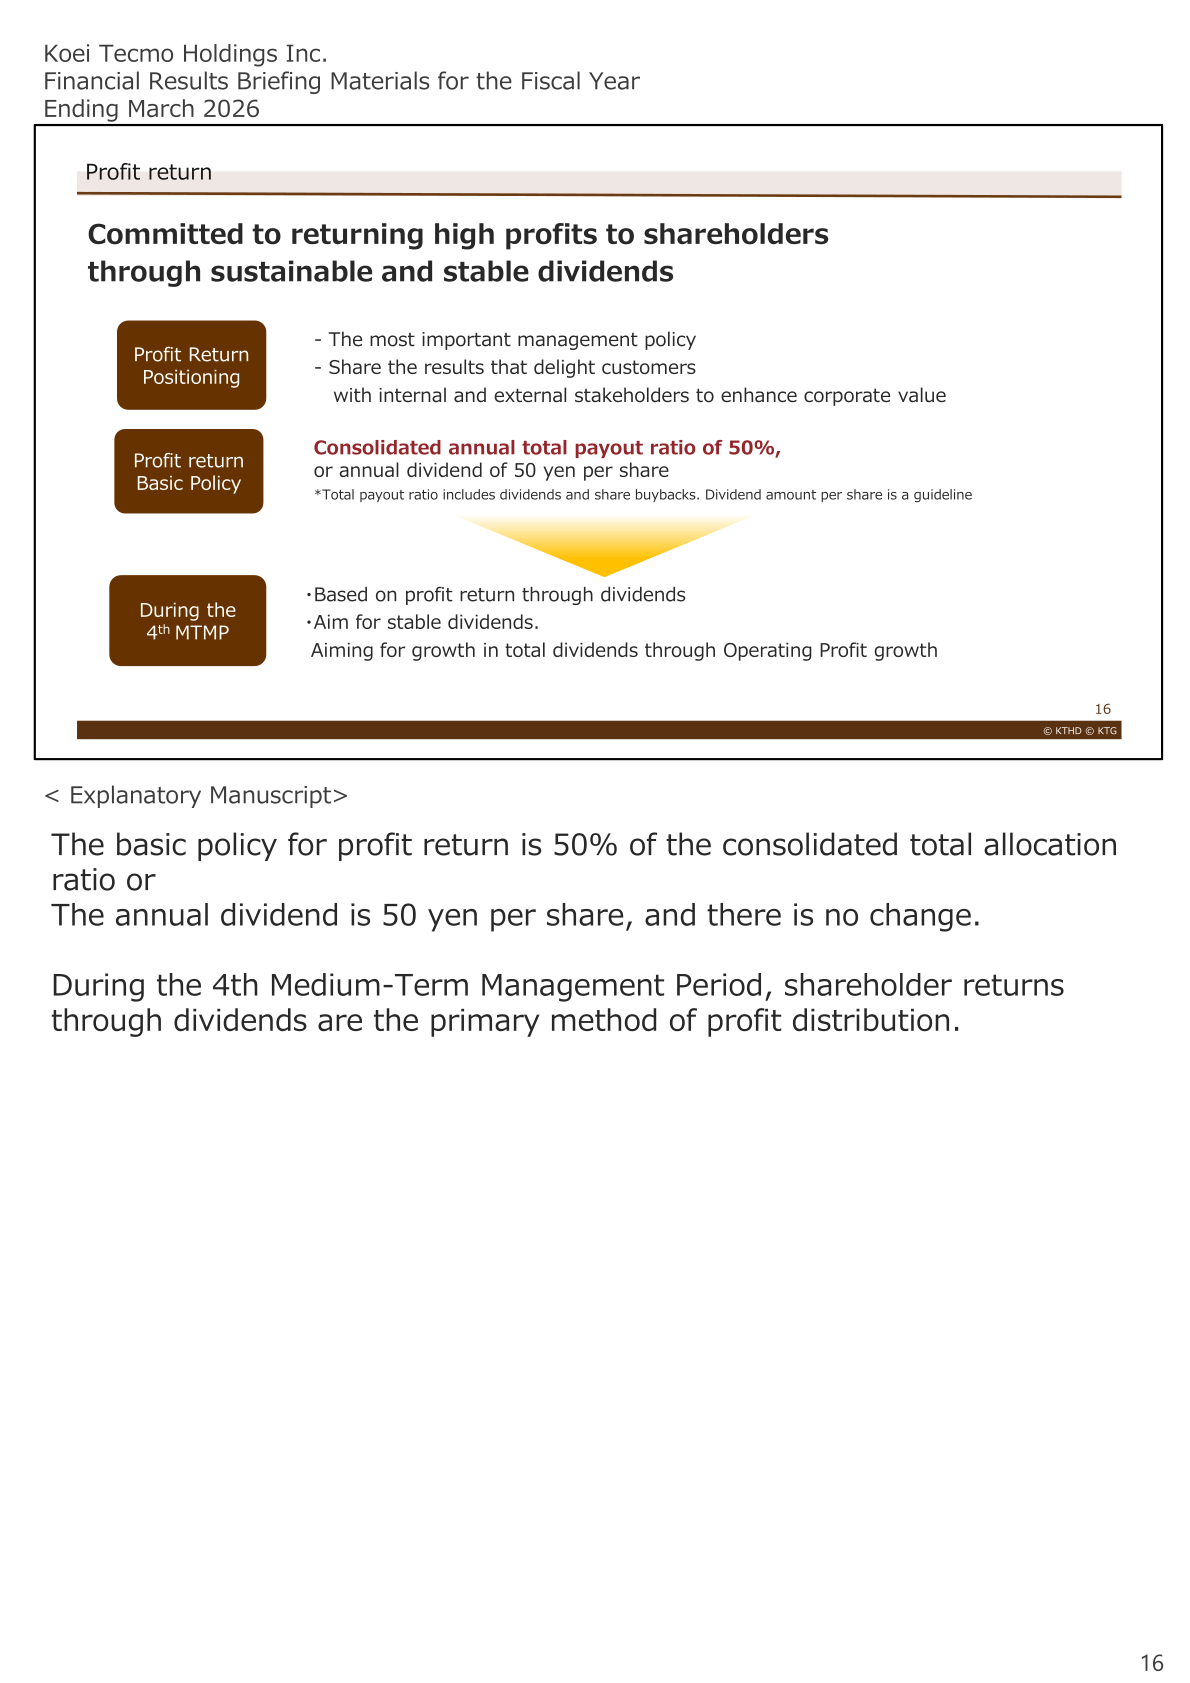
The basic profit return policy is a consolidated annual total payout ratio of 50%, or an annual dividend of 50 yen per share, with the total payout ratio including dividends and share buybacks; the company states this policy is unchanged. During the 4th Medium-Term Management Period, shareholder returns through dividends are the primary method of profit distribution. For FY25 the dividend per share is 66 yen with a payout ratio of 50.1%, and single-year total dividends have grown from 3.4 billion yen in FY13 to 22.0 billion yen in FY25. The FY2026 dividend forecast is 48 yen per share, based on the 50% total allocation ratio policy, with a payout ratio of 50.3%. The company aims for growth in total dividends through operating profit expansion.
Medium-Term Plan / Topics
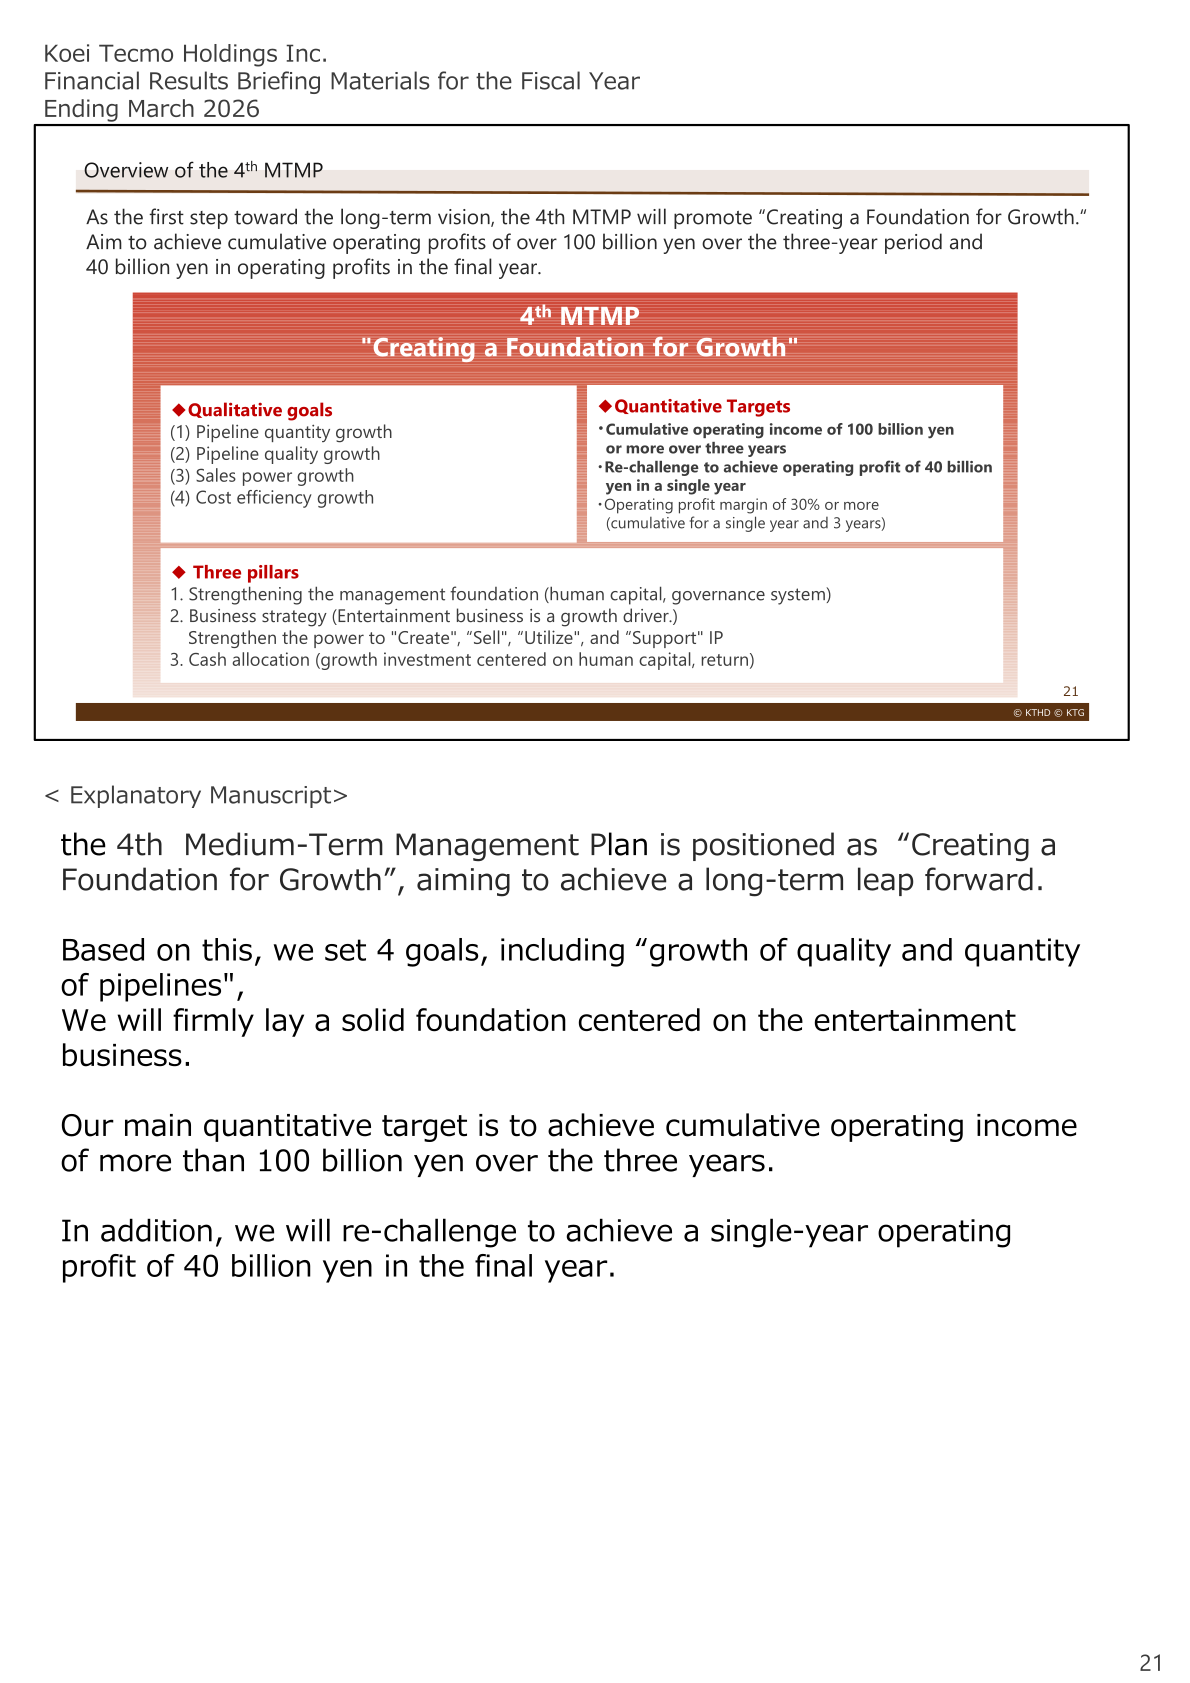
The 4th Medium-Term Management Plan (FY2025-27), positioned as “Creating a Foundation for Growth”, targets cumulative operating profit of 100 billion yen or more over the three years, a re-challenge to achieve operating profit of 40 billion yen in a single year, and an operating profit margin of 30% or more. It is the first step toward the long-term vision of entering the top 10 in the world for operating profit among global digital entertainment companies by FY2035. The company expects more than 110 billion yen of cash allocation for growth investments centered on human capital during the period. In FY2025 it achieved global in-house publishing of “Nioh 3” and reorganized its marketing and IP units into the Global IP Division and the Global Marketing Division from FY2026. Group employees increased to 2,835, 193 new employees joined domestically in FY2026, and the new office “Yokohama Symphostage” became operational in April 2026. In September 2025, through the disposal of treasury shares and a secondary offering of shares, the free float ratio reached 35% and all criteria for maintaining the Prime Market listing were met, with the ratio at 37.1% as of the end of March. The company is also promoting operational efficiency through AI, including reducing man-hours for file translation and meeting minutes creation by more than 50%.
This article is an analysis based on publicly available information and is not a recommendation to buy or sell any specific securities. Investment decisions are your own responsibility.
![[Obayashi] Investors’ Guide 2026 — The Complete 24-Article Breakdown](https://japan-equity.com/wp-content/uploads/2026/07/hub_cover-1024x1024.png)
![[Obayashi] IR & SR Policy — Feeding Dialogue Back into Management](https://japan-equity.com/wp-content/uploads/2026/07/p32_sq-1024x1024.jpg)
![[Obayashi] Real Estate Development — 18.7% Margin, ¥287.7bn Unrealized Gains](https://japan-equity.com/wp-content/uploads/2026/07/p20_sq-1024x1024.jpg)
![[Obayashi] Domestic Civil Engineering — Resilience Spending Supports 9.6% Margin](https://japan-equity.com/wp-content/uploads/2026/07/p11_sq-1024x1024.jpg)
![[Obayashi] Share Price & External Ratings — vs TOPIX, ESG Index Inclusion](https://japan-equity.com/wp-content/uploads/2026/07/p40_sq-1024x1024.jpg)
![[Construction] ¥75.5tn Investment, Shrinking Workforce — Big-5 Market Share](https://japan-equity.com/wp-content/uploads/2026/07/p12_sq-1024x1024.jpg)



![[Obayashi] Capital Policy & Shareholder Returns — ROE 10%+, DOE ~5%, ¥100bn Buyback](https://japan-equity.com/wp-content/uploads/2026/07/p27_sq-1024x1024.jpg)
![[Obayashi] Reducing Cross-Shareholdings — ¥285.2bn Sold in Five Years](https://japan-equity.com/wp-content/uploads/2026/07/p29_sq-1024x1024.jpg)
![[Obayashi] ¥750bn Investment Plan — ¥300bn to Development, ¥190bn to Tech/DX](https://japan-equity.com/wp-content/uploads/2026/07/p30_sq-1024x1024.jpg)
![[Obayashi] MTP2022 KPIs — Operating Profit ~2x Target, ROE 14.4%](https://japan-equity.com/wp-content/uploads/2026/07/p25_sq-1024x1024.jpg)
![[Obayashi] Cash Allocation — ¥420bn Investment CF Over Five Years](https://japan-equity.com/wp-content/uploads/2026/07/p26_sq-1024x1024.jpg)
![[Obayashi] Green Energy — 44 Plants, 344MW, and the Green Hydrogen Challenge](https://japan-equity.com/wp-content/uploads/2026/07/p21_sq-1024x1024.jpg)
![[Obayashi] Tackling the Labor Shortage — Robotics Construction®](https://japan-equity.com/wp-content/uploads/2026/07/p14_sq-1024x1024.jpg)
