
This article is based on publicly available IR materials and is not a recommendation to buy or sell any specific securities.
Note: Tsuruha Holdings does not publish an English results presentation; this article is based on the company’s Japanese-language results presentation, with figures transcribed as reported. Note also that while this site classifies the company’s latest completed fiscal year as FY2025, the source materials label the period as the fiscal year ended February 2026 (March 1, 2025 to February 28, 2026), and that labeling is retained below.
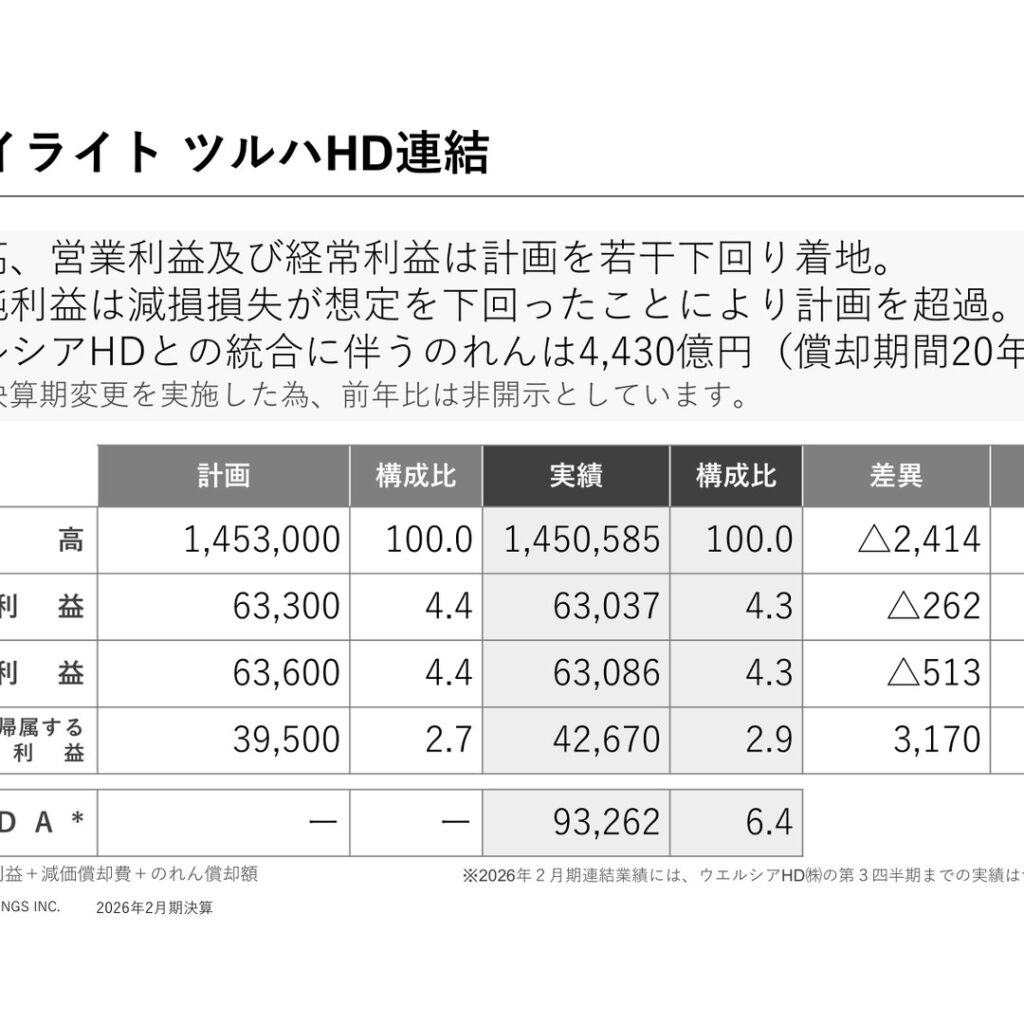
Tsuruha Holdings, a Prime Market-listed drugstore group (securities code 3391), announced results for the fiscal year ended February 28, 2026 on April 9, 2026. Consolidated net sales were 1,450,585 million yen (99.8% of plan), operating income was 63,037 million yen (99.6% of plan), and net income attributable to owners of the parent was 42,670 million yen (108.0% of plan). This was the first fiscal year to reflect the business integration with Welcia Holdings: Welcia became a consolidated subsidiary, and the Welcia Group’s fourth quarter (three months) is included in the consolidated results, while its first through third quarters are not. Because the company changed its fiscal year-end in the previous period (the fiscal year ended February 2025 was a transitional period from May 16, 2024 to February 28, 2025), year-on-year comparisons are not disclosed.
Consolidated Results (Fiscal Year Ended February 28, 2026)
Net sales, operating income and ordinary income landed slightly below plan, while net income exceeded plan because impairment losses came in lower than assumed. EBITDA (defined by the company as operating income plus depreciation plus goodwill amortization) was 93,262 million yen. Goodwill arising from the integration with Welcia Holdings amounted to 443.0 billion yen, to be amortized over 20 years.
| Item (million yen) | FY2/26 Actual | Plan | vs. Plan (%) |
|---|---|---|---|
| Net sales | 1,450,585 | 1,453,000 | 99.8 |
| Operating income | 63,037 | 63,300 | 99.6 |
| Ordinary income | 63,086 | 63,600 | 99.2 |
| Net income attributable to owners of the parent | 42,670 | 39,500 | 108.0 |
| EBITDA | 93,262 | — | — |
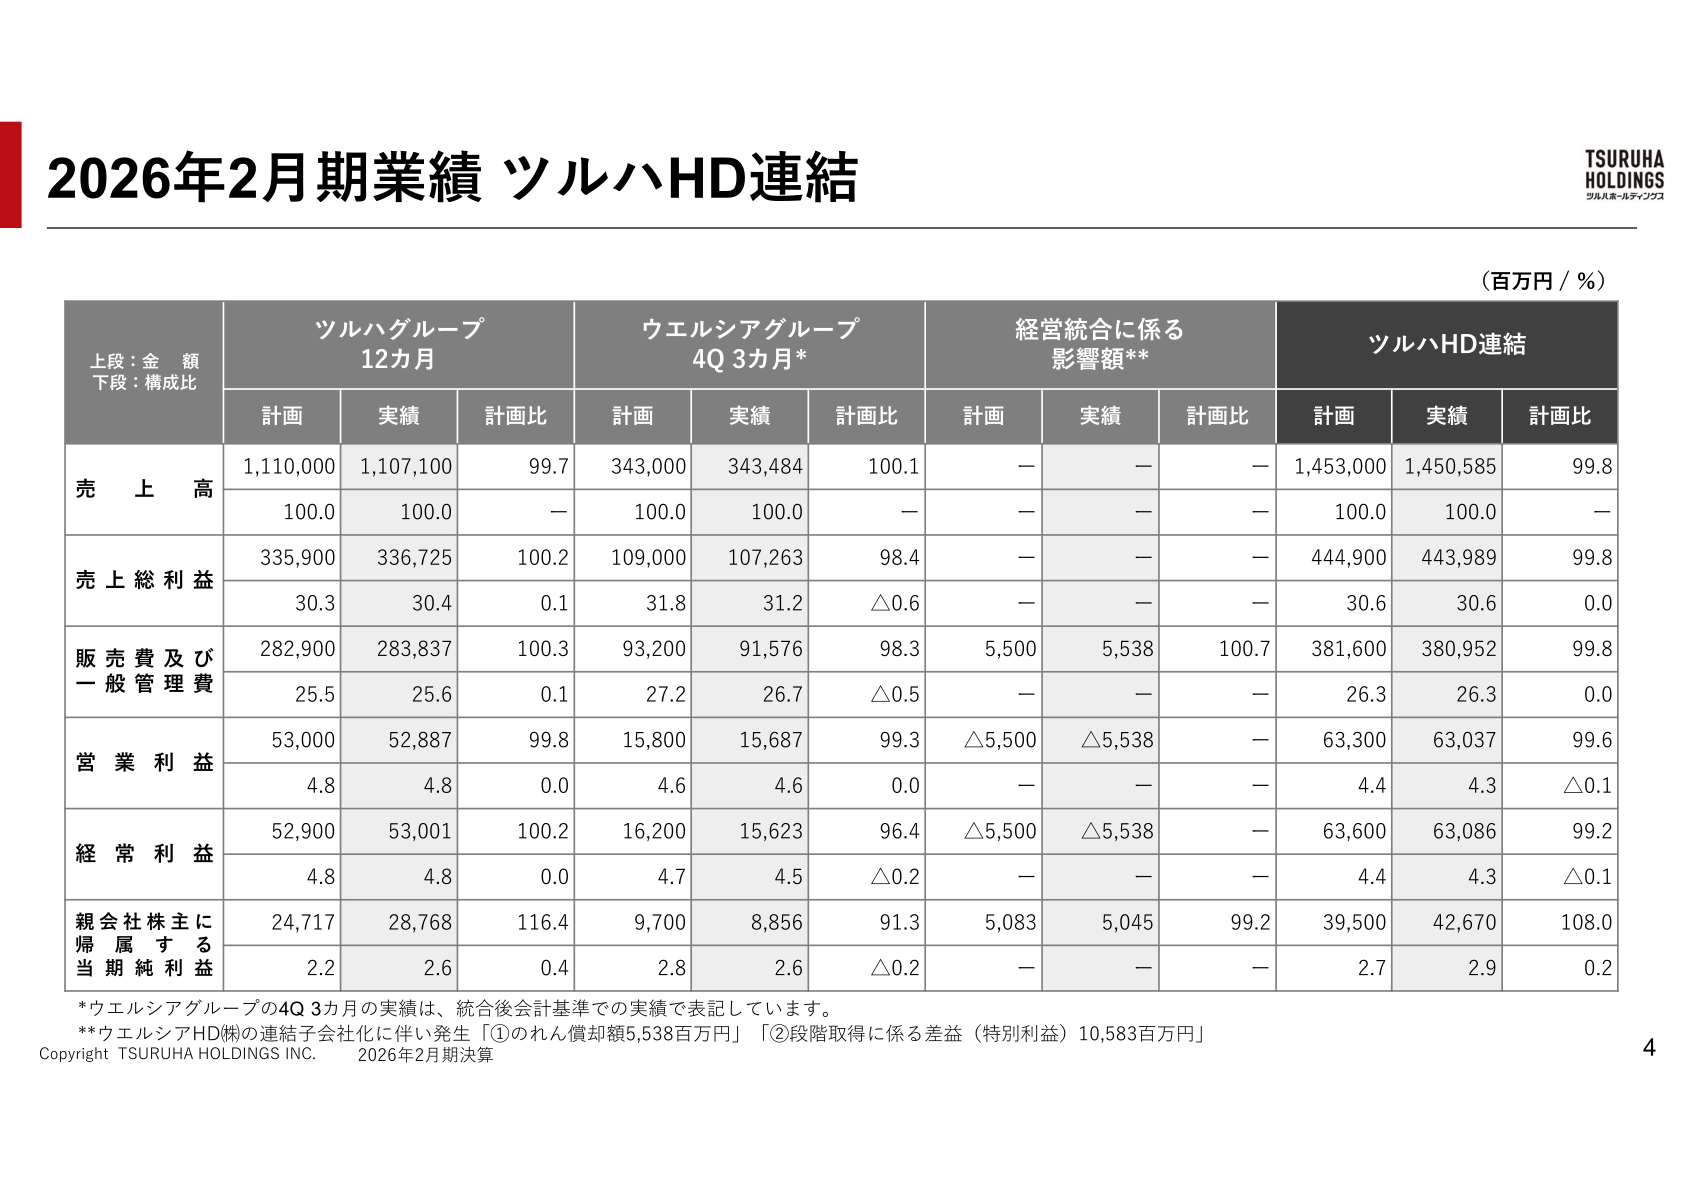
By group, the Tsuruha Group (12 months) posted net sales of 1,107,100 million yen and operating income of 52,887 million yen, and the Welcia Group (fourth quarter, three months, presented on the post-integration accounting basis) contributed net sales of 343,484 million yen and operating income of 15,687 million yen. Integration-related items comprised goodwill amortization of 5,538 million yen (recorded in SG&A) and a gain on step acquisition of 10,583 million yen (recorded as extraordinary income). The minus sign in the source materials is shown as “△” below.
| Group (million yen) | Net sales | Operating income | Net income attributable to owners of the parent |
|---|---|---|---|
| Tsuruha Group (12 months) | 1,107,100 | 52,887 | 28,768 |
| Welcia Group (Q4, 3 months) | 343,484 | 15,687 | 8,856 |
| Integration-related impact | — | △5,538 | 5,045 |
| Tsuruha HD consolidated | 1,450,585 | 63,037 | 42,670 |
Same-Store Sales, Product Mix and Dispensing
Consolidated same-store sales for the full year rose 2.3% year on year (Q1 +2.6%, Q2 +1.6%, Q3 +3.2%, Q4 +2.1%). In the Tsuruha Group’s product mix, food’s share of sales continued to rise, reaching 26.6% of sales, partly reflecting higher unit prices, and dispensing rose to a 14.1% share as new pharmacy openings lifted prescription volume and unit prices. On a 12-month combined basis, dispensing sales for Tsuruha HD consolidated were 467,725 million yen, with 42,712 thousand prescriptions handled, and 58.5% of consolidated stores handling dispensing. Group private-brand sales on a 12-month combined basis were 224,409 million yen, an 11.5% share of sales. The consolidated domestic store network at fiscal year-end totaled 5,676 stores (Tsuruha Group 2,702, Welcia Group 2,974, excluding franchise stores).
| Dispensing (12-month combined) | Tsuruha Group | Welcia Group | Tsuruha HD consolidated |
|---|---|---|---|
| Dispensing sales (million yen) | 156,169 | 311,555 | 467,725 |
| Prescriptions handled (thousands) | 13,657 | 29,055 | 42,712 |
| Share of sales (%) | 14.1 | 23.0 | 19.0 |
| Gross profit margin (%) | 36.1 | 37.8 | 37.2 |
| Stores handling dispensing | 1,017 | 2,302 | 3,319 |
As a reference, the materials also present the Welcia Group’s full 12-month results on the pre-integration accounting basis: net sales of 1,353,310 million yen (105.3% of the prior year), operating income of 42,037 million yen (115.5%), ordinary income of 46,593 million yen (114.1%) and net income attributable to owners of the parent of 16,065 million yen (107.4%), driven by M&A, growth in existing-store sales led by dispensing, and continued SG&A control centered on personnel costs.
Plan for the Fiscal Year Ending February 2027
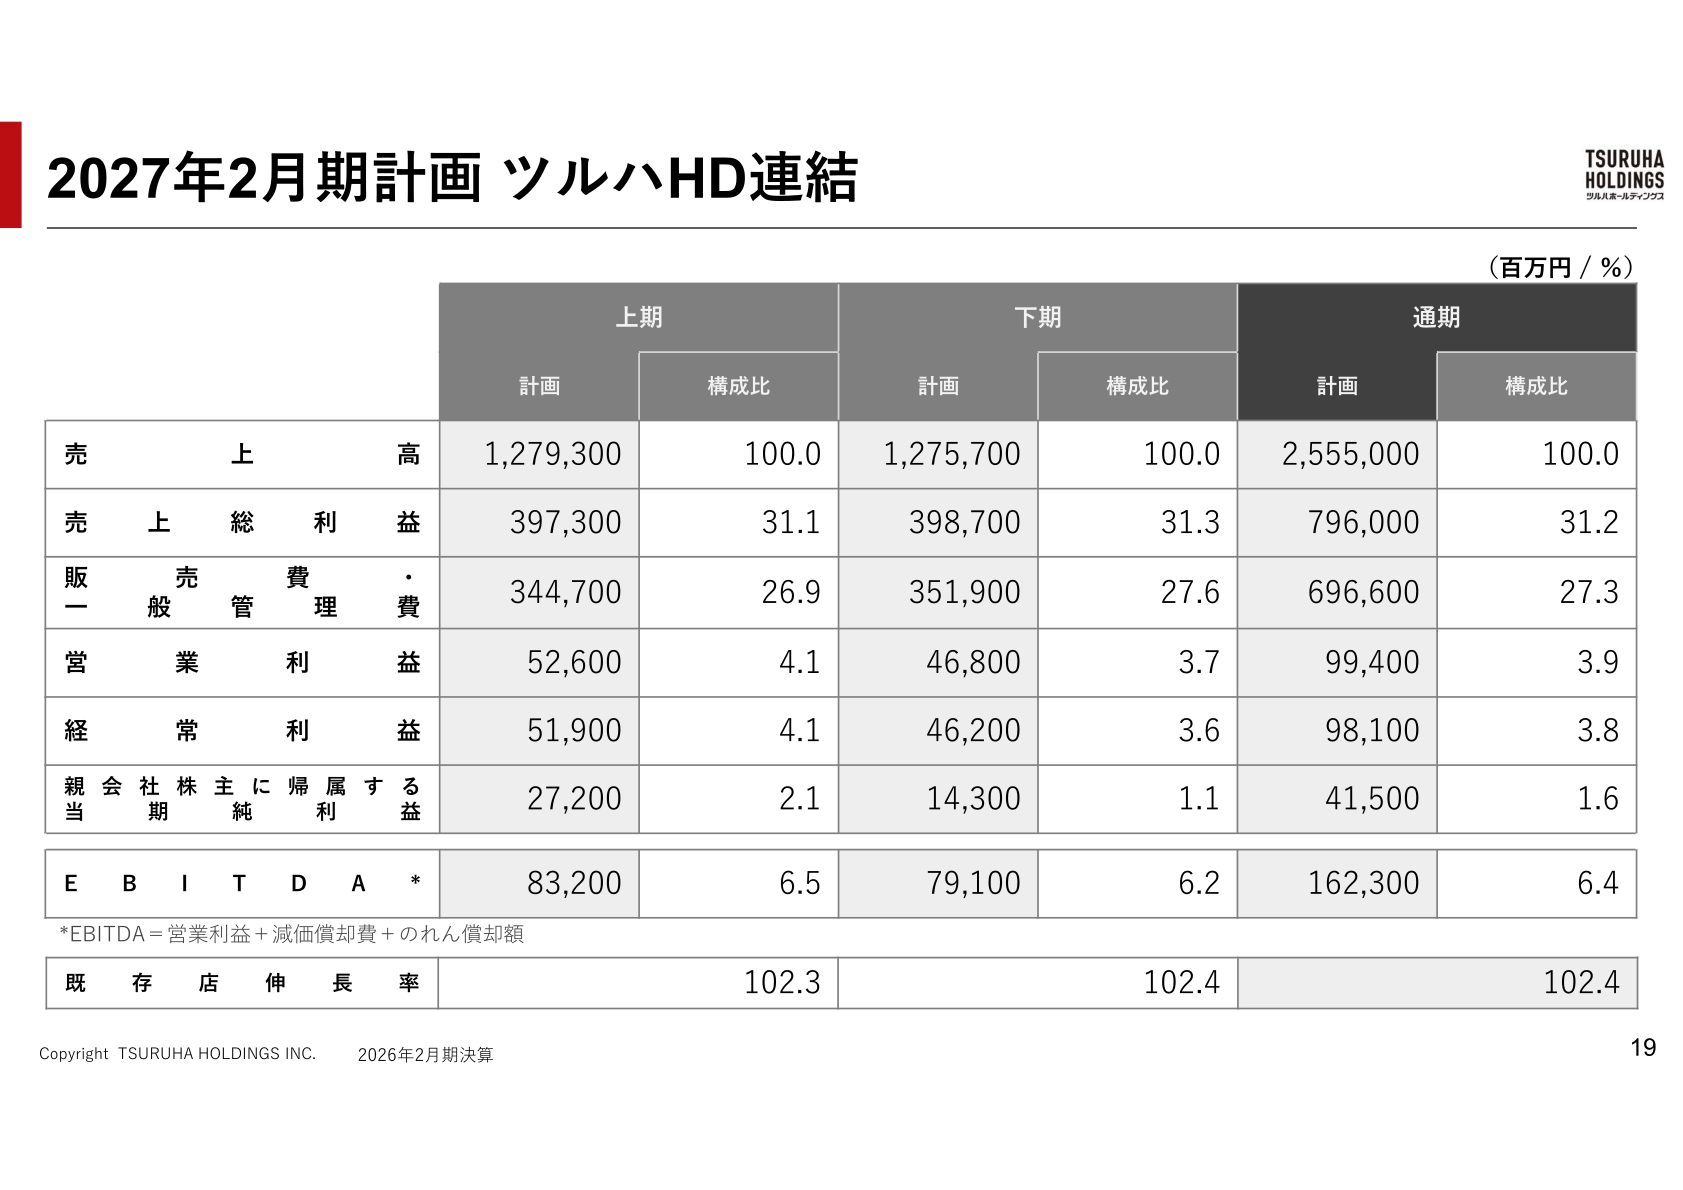
For the fiscal year ending February 28, 2027, the company plans consolidated net sales of 2,555,000 million yen, operating income of 99,400 million yen, ordinary income of 98,100 million yen, net income attributable to owners of the parent of 41,500 million yen and EBITDA of 162,300 million yen, with a full-year same-store sales index of 102.4 versus the prior year. By group, the plan comprises the Tsuruha Group with net sales of 1,147,600 million yen and operating income of 62,200 million yen, and the Welcia Group with net sales of 1,407,400 million yen and operating income of 59,350 million yen, with an integration-related impact of △22,150 million yen on operating income (SG&A of 22,150 million yen).
| Item (million yen) | FY2/27 Plan | FY2/26 Actual |
|---|---|---|
| Net sales | 2,555,000 | 1,450,585 |
| Operating income | 99,400 | 63,037 |
| Ordinary income | 98,100 | 63,086 |
| Net income attributable to owners of the parent | 41,500 | 42,670 |
| EBITDA | 162,300 | 93,262 |
Shareholder Returns
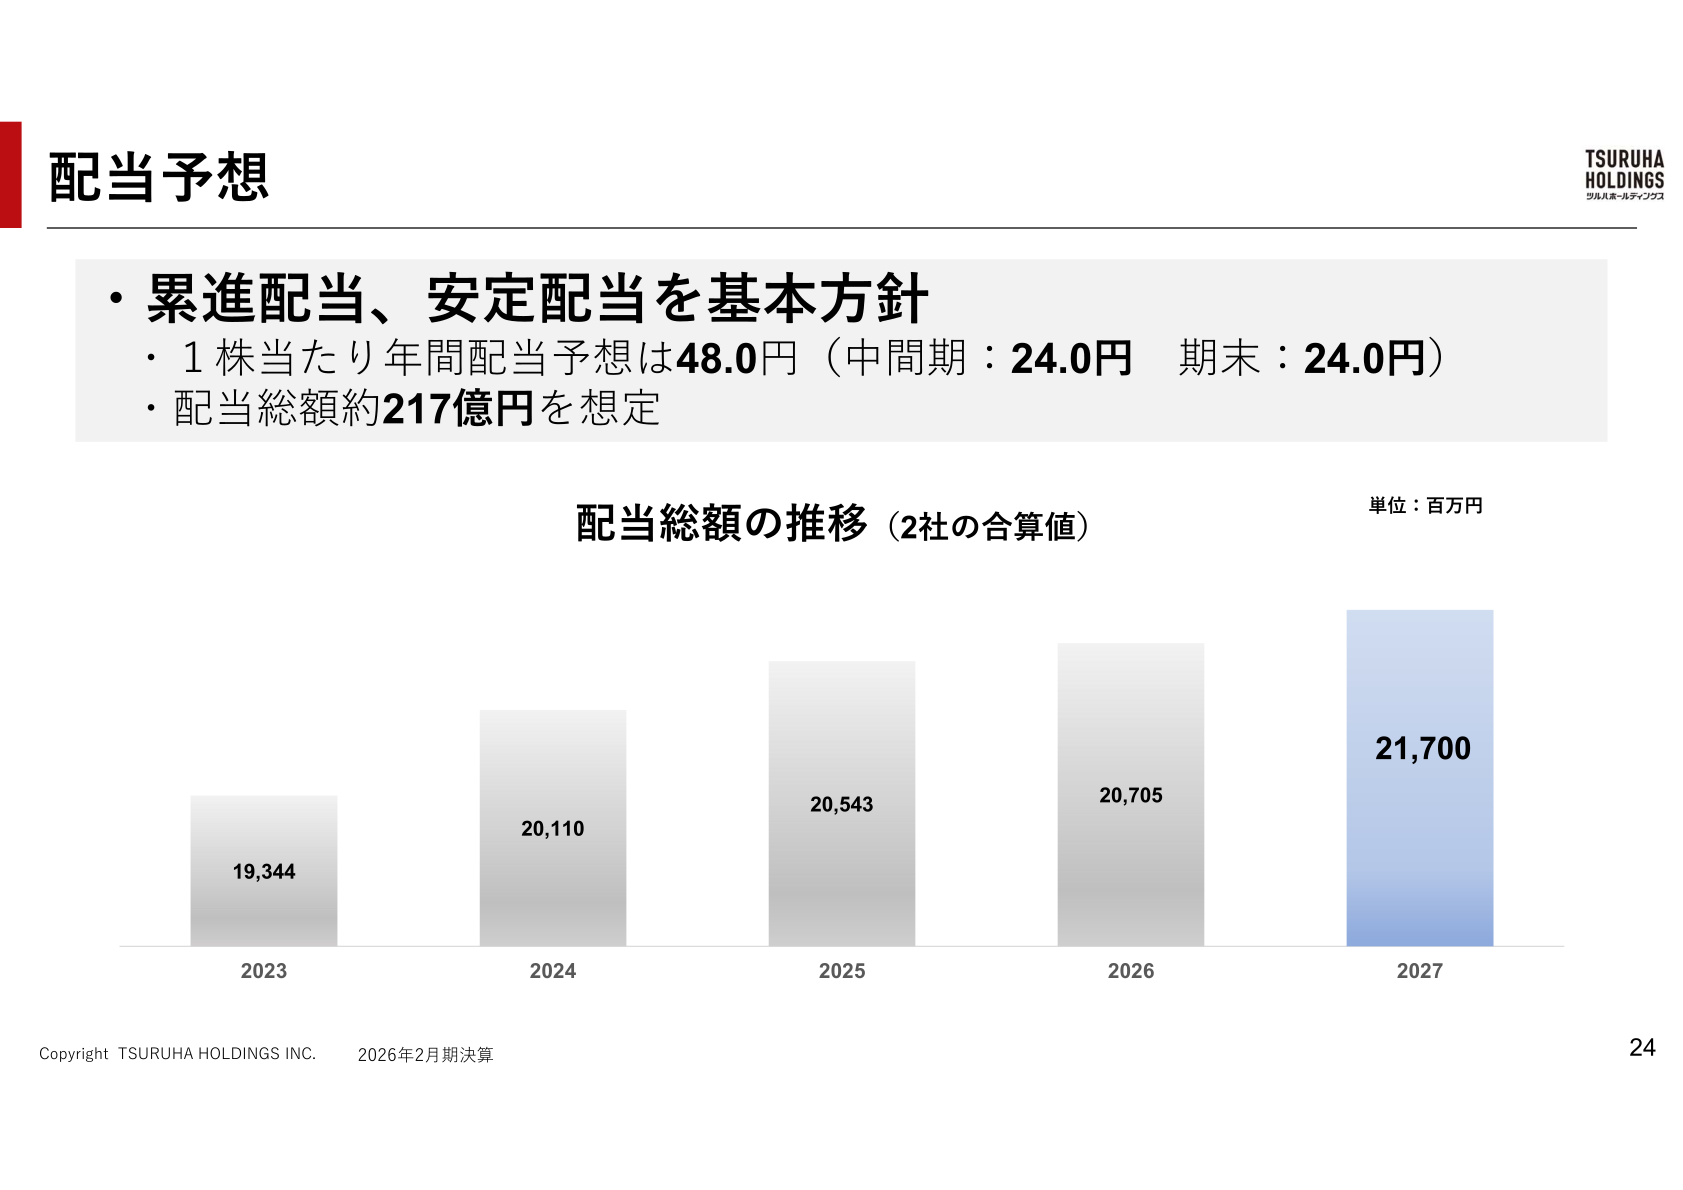
The company’s basic policy is progressive and stable dividends. The annual dividend forecast for the fiscal year ending February 2027 is 48.0 yen per share (interim 24.0 yen, year-end 24.0 yen), with total dividends of approximately 21.7 billion yen assumed. The materials show total dividends (combined value of the two companies) rising from 19,344 million yen in 2023 to 20,705 million yen in 2026 and 21,700 million yen planned for 2027.
Topics
The Tsuruha Group opened 107 stores and closed 63 during the year, ending the period with 2,702 stores. Consolidated capital expenditure for the fiscal year ended February 2026 was 33,377 million yen (excluding the Welcia Group’s first three quarters) with depreciation of 22,416 million yen, and the plan for the fiscal year ending February 2027 calls for capital expenditure of 62,427 million yen and depreciation of 37,800 million yen. The materials also note that cash and deposits at fiscal year-end increased by approximately 68.0 billion yen because the fiscal year-end date fell on a non-business day.
This article is an analysis based on publicly available information and is not a recommendation to buy or sell any specific securities. Investment decisions are your own responsibility.
![[Obayashi] Investors’ Guide 2026 — The Complete 24-Article Breakdown](https://japan-equity.com/wp-content/uploads/2026/07/hub_cover-1024x1024.png)
![[Obayashi] IR & SR Policy — Feeding Dialogue Back into Management](https://japan-equity.com/wp-content/uploads/2026/07/p32_sq-1024x1024.jpg)
![[Obayashi] Real Estate Development — 18.7% Margin, ¥287.7bn Unrealized Gains](https://japan-equity.com/wp-content/uploads/2026/07/p20_sq-1024x1024.jpg)
![[Obayashi] Domestic Civil Engineering — Resilience Spending Supports 9.6% Margin](https://japan-equity.com/wp-content/uploads/2026/07/p11_sq-1024x1024.jpg)
![[Obayashi] Share Price & External Ratings — vs TOPIX, ESG Index Inclusion](https://japan-equity.com/wp-content/uploads/2026/07/p40_sq-1024x1024.jpg)
![[Construction] ¥75.5tn Investment, Shrinking Workforce — Big-5 Market Share](https://japan-equity.com/wp-content/uploads/2026/07/p12_sq-1024x1024.jpg)



![[Obayashi] Capital Policy & Shareholder Returns — ROE 10%+, DOE ~5%, ¥100bn Buyback](https://japan-equity.com/wp-content/uploads/2026/07/p27_sq-1024x1024.jpg)
![[Obayashi] Reducing Cross-Shareholdings — ¥285.2bn Sold in Five Years](https://japan-equity.com/wp-content/uploads/2026/07/p29_sq-1024x1024.jpg)
![[Obayashi] ¥750bn Investment Plan — ¥300bn to Development, ¥190bn to Tech/DX](https://japan-equity.com/wp-content/uploads/2026/07/p30_sq-1024x1024.jpg)
![[Obayashi] MTP2022 KPIs — Operating Profit ~2x Target, ROE 14.4%](https://japan-equity.com/wp-content/uploads/2026/07/p25_sq-1024x1024.jpg)
![[Obayashi] Cash Allocation — ¥420bn Investment CF Over Five Years](https://japan-equity.com/wp-content/uploads/2026/07/p26_sq-1024x1024.jpg)
![[Obayashi] Green Energy — 44 Plants, 344MW, and the Green Hydrogen Challenge](https://japan-equity.com/wp-content/uploads/2026/07/p21_sq-1024x1024.jpg)
![[Obayashi] Tackling the Labor Shortage — Robotics Construction®](https://japan-equity.com/wp-content/uploads/2026/07/p14_sq-1024x1024.jpg)
