
This article is based on publicly available IR materials and is not a recommendation to buy or sell any specific securities.
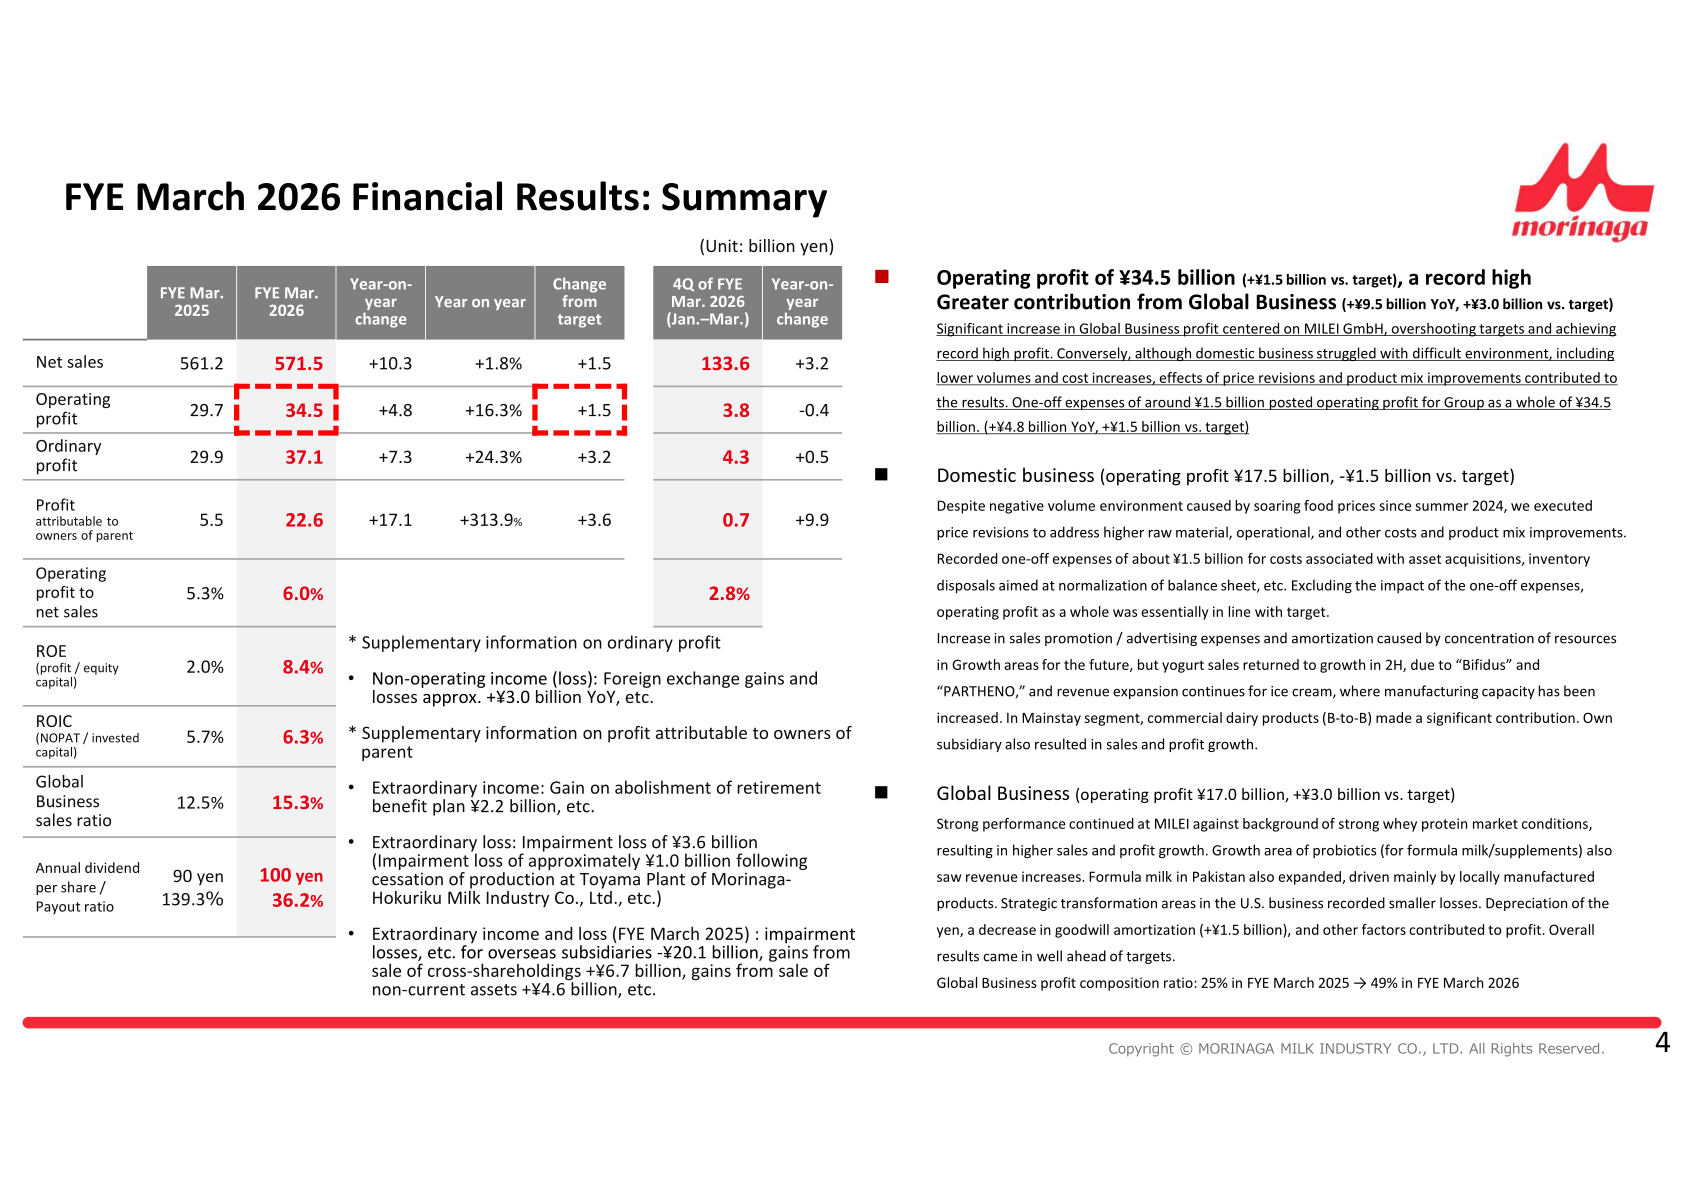
Morinaga Milk Industry reported net sales of ¥571.5 billion (+1.8% year on year) and operating profit of ¥34.5 billion (+¥4.8 billion, +16.3%) for the fiscal year ended March 31, 2026, a record high and ¥1.5 billion above target. Profit attributable to owners of parent rose to ¥22.6 billion from ¥5.5 billion, a year in which the prior period had absorbed impairment losses on overseas subsidiaries. Global Business operating profit climbed ¥9.5 billion to ¥17.0 billion, lifting its share of group profit composition from 25% to 49%. For the fiscal year ending March 31, 2027 the company guides to net sales of ¥580.0 billion but operating profit of ¥32.0 billion, after factoring in a ¥4.0 billion negative impact from the situation in the Middle East.
Note: Morinaga Milk labels this fiscal year “FYE March 2026”; japan-equity.com classifies the most recently completed fiscal year as FY2025. The labels used in the text and tables below follow the company’s own materials.
Consolidated Results (Full-Year Actual)
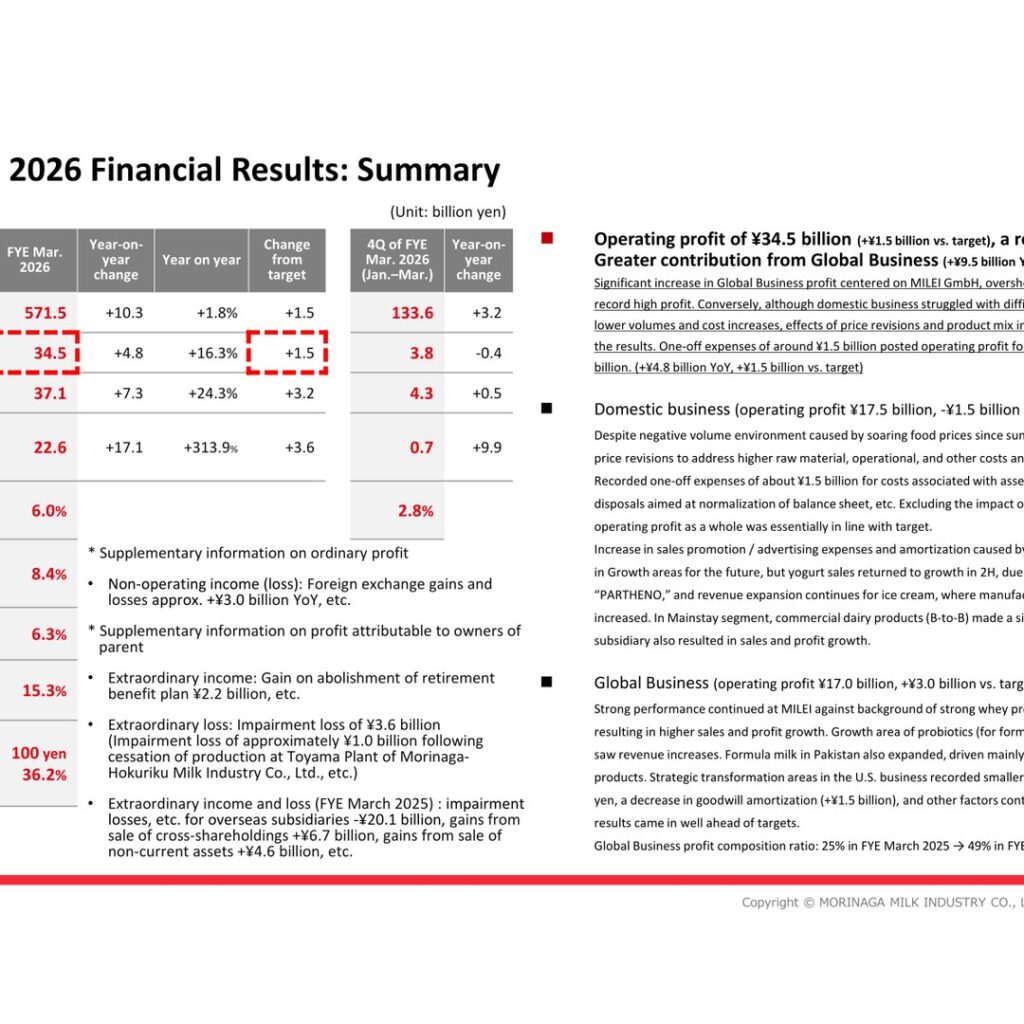
Operating profit reached a record ¥34.5 billion, ¥1.5 billion above the company’s target. Ordinary profit rose ¥7.3 billion to ¥37.1 billion, helped by foreign exchange gains and losses of approximately +¥3.0 billion year on year in non-operating income. Profit attributable to owners of parent of ¥22.6 billion included extraordinary income from a ¥2.2 billion gain on abolishment of a retirement benefit plan and an extraordinary impairment loss of ¥3.6 billion, which included approximately ¥1.0 billion following cessation of production at the Toyama Plant of Morinaga-Hokuriku Milk Industry Co., Ltd. In the prior fiscal year, extraordinary items included -¥20.1 billion of impairment losses for overseas subsidiaries, +¥6.7 billion of gains from the sale of cross-shareholdings and +¥4.6 billion of gains from the sale of non-current assets.
| Item | FYE Mar. 2026 | FYE Mar. 2025 | Change | Year on year |
|---|---|---|---|---|
| Net sales (billion yen) | 571.5 | 561.2 | +10.3 | +1.8% |
| Operating profit (billion yen) | 34.5 | 29.7 | +4.8 | +16.3% |
| Ordinary profit (billion yen) | 37.1 | 29.9 | +7.3 | +24.3% |
| Profit attributable to owners of parent (billion yen) | 22.6 | 5.5 | +17.1 | +313.9% |
| Operating profit to net sales | 6.0% | 5.3% | — | — |
| ROE (profit / equity capital) | 8.4% | 2.0% | — | — |
| ROIC (NOPAT / invested capital) | 6.3% | 5.7% | — | — |
| Global Business sales ratio | 15.3% | 12.5% | — | — |
| Annual dividend per share | 100 yen | 90 yen | — | — |
| Payout ratio | 36.2% | 139.3% | — | — |
Segment Results
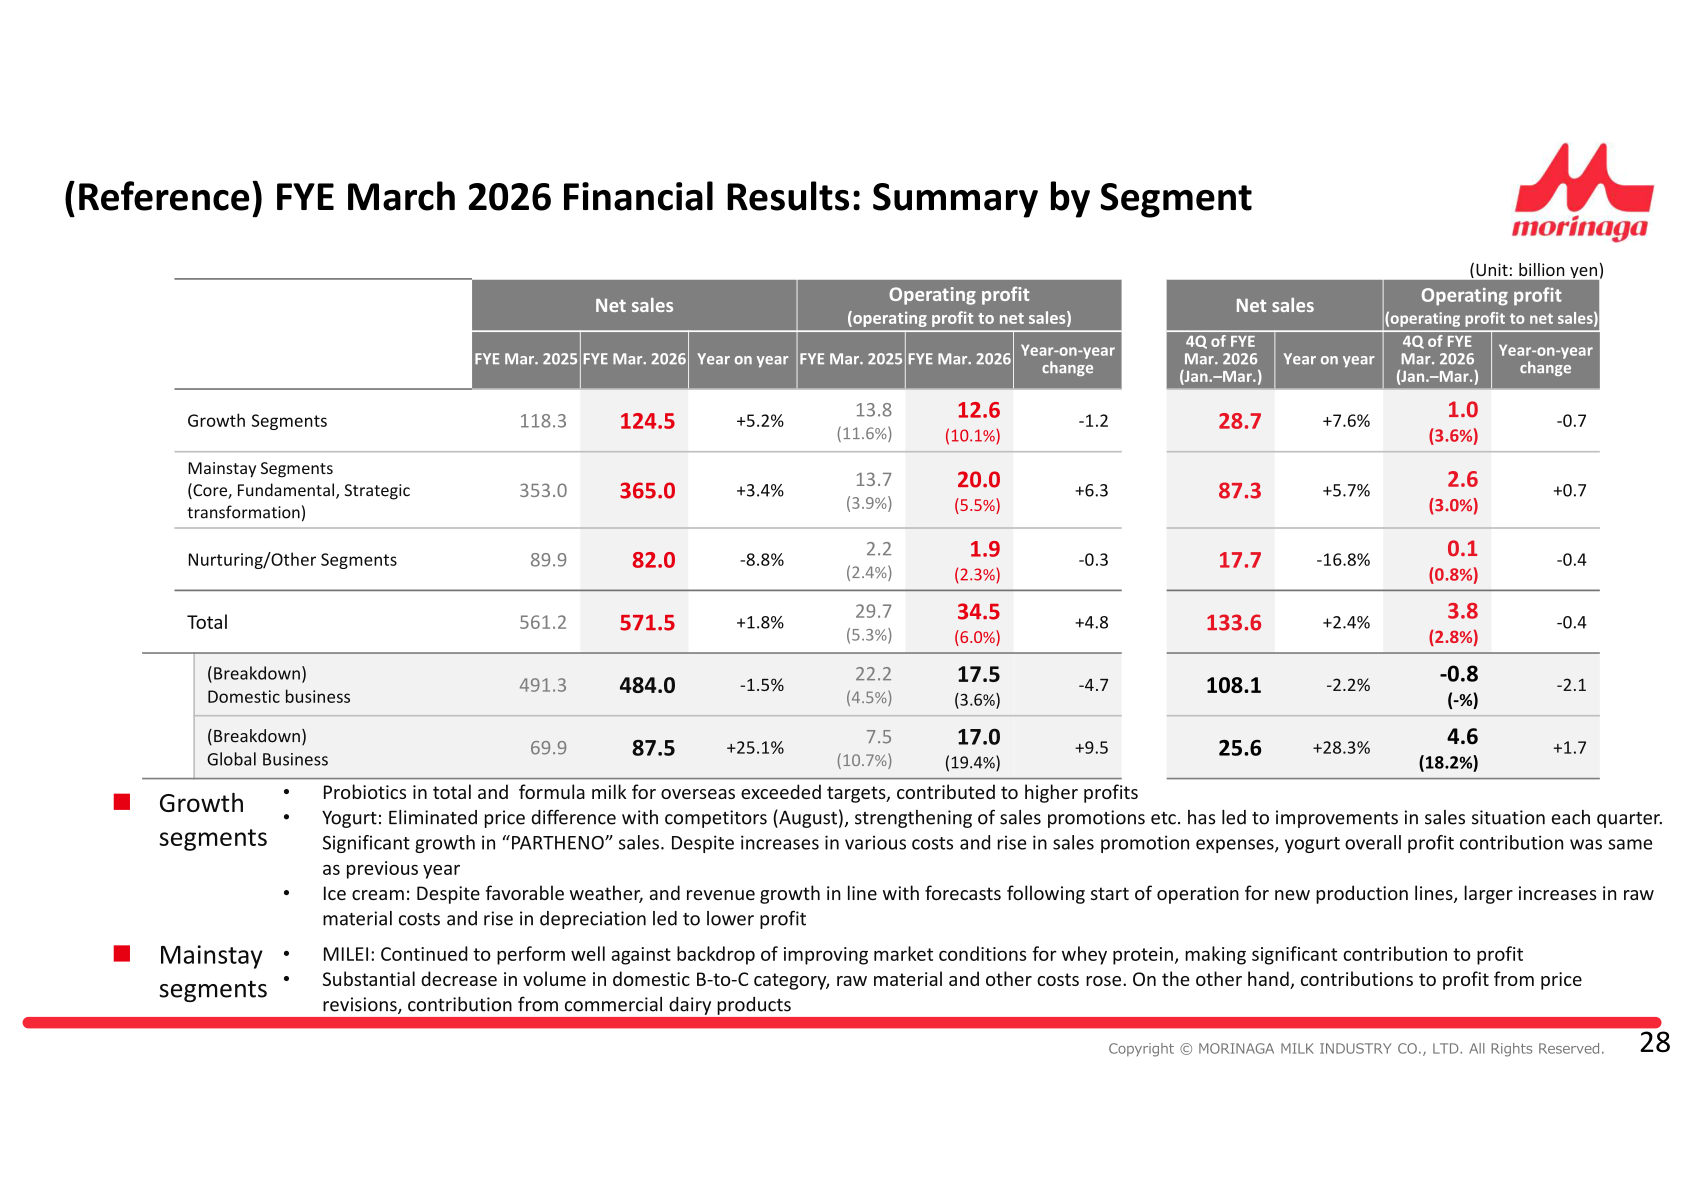
By segment, Growth Segments net sales grew 5.2% to ¥124.5 billion but operating profit fell ¥1.2 billion to ¥12.6 billion, as ice cream saw larger increases in raw material costs and a rise in depreciation. Mainstay Segments (Core, Fundamental, Strategic transformation) lifted operating profit ¥6.3 billion to ¥20.0 billion on net sales of ¥365.0 billion. On the domestic/global split, the domestic business posted operating profit of ¥17.5 billion, down ¥4.7 billion and ¥1.5 billion below target, after around ¥1.5 billion of one-off expenses for costs associated with asset acquisitions and inventory disposals aimed at normalization of the balance sheet. Global Business operating profit rose ¥9.5 billion to ¥17.0 billion, ¥3.0 billion above target, led by MILEI GmbH against a backdrop of strong whey protein market conditions, alongside a ¥1.5 billion decrease in goodwill amortization and yen depreciation.
| Segment | Metric | FYE Mar. 2026 | FYE Mar. 2025 | Change |
|---|---|---|---|---|
| Growth Segments | Net sales | 124.5 | 118.3 | +5.2% |
| Growth Segments | Operating profit (margin) | 12.6 (10.1%) | 13.8 (11.6%) | -1.2 |
| Mainstay Segments (Core, Fundamental, Strategic transformation) | Net sales | 365.0 | 353.0 | +3.4% |
| Mainstay Segments (Core, Fundamental, Strategic transformation) | Operating profit (margin) | 20.0 (5.5%) | 13.7 (3.9%) | +6.3 |
| Nurturing/Other Segments | Net sales | 82.0 | 89.9 | -8.8% |
| Nurturing/Other Segments | Operating profit (margin) | 1.9 (2.3%) | 2.2 (2.4%) | -0.3 |
| Total | Net sales | 571.5 | 561.2 | +1.8% |
| Total | Operating profit (margin) | 34.5 (6.0%) | 29.7 (5.3%) | +4.8 |
| (Breakdown) Domestic business | Net sales | 484.0 | 491.3 | -1.5% |
| (Breakdown) Domestic business | Operating profit (margin) | 17.5 (3.6%) | 22.2 (4.5%) | -4.7 |
| (Breakdown) Global Business | Net sales | 87.5 | 69.9 | +25.1% |
| (Breakdown) Global Business | Operating profit (margin) | 17.0 (19.4%) | 7.5 (10.7%) | +9.5 |
Net Sales by Category
MILEI (Germany) was the largest single driver, with net sales of ¥56.1 billion (+38%), or EUR 305 million (+23%) in local currency, against ¥40.7 billion and EUR 248 million a year earlier. Yogurt rose 2% to ¥57.8 billion, with the company noting significant growth in “PARTHENO” sales and improvements in the sales situation each quarter after eliminating the price difference with competitors in August. Ice cream grew 3% to ¥47.9 billion following the start of operation of new production lines at the Kobe Plant. Milk declined 7% to ¥41.0 billion, while B-to-B (excluding domestic probiotics) rose 4% to ¥85.9 billion.
| Category | FYE Mar. 2026 | FYE Mar. 2025 | Year on year |
|---|---|---|---|
| Yogurt | 57.8 | 56.9 | +2% |
| Ice cream | 47.9 | 46.4 | +3% |
| NutriCo Morinaga (Pakistan) (Global) | 8.8 | 7.9 | +11% |
| NutriCo Morinaga (Pakistan), local currency | PKR 15.8 billion | PKR 14.2 billion | +11% |
| Beverages | 53.6 | 54.4 | -1% |
| Cheese | 26.2 | 26.7 | -2% |
| Nutritional food | 13.7 | 13.7 | ±0% |
| CLINICO Co., Ltd. | 26.9 | 27.2 | -1% |
| MILEI (Germany) (Global) | 56.1 | 40.7 | +38% |
| MILEI (Germany), local currency | EUR 305 million | EUR 248 million | +23% |
| Milk | 41.0 | 44.3 | -7% |
| B-to-B (excluding domestic probiotics) | 85.9 | 82.2 | +4% |
| Chilled desserts | 7.6 | 8.0 | -4% |
| Commercial milk (Home deliveries, etc.) | 15.9 | 16.1 | -1% |
| Morinaga Nutritional Foods (U.S., including TIF) (Global) | 9.3 | 9.8 | -5% |
| Morinaga Nutritional Foods Vietnam (Vietnam) (Global) | 4.5 | 4.3 | +5% |
FYE March 2027 Forecast
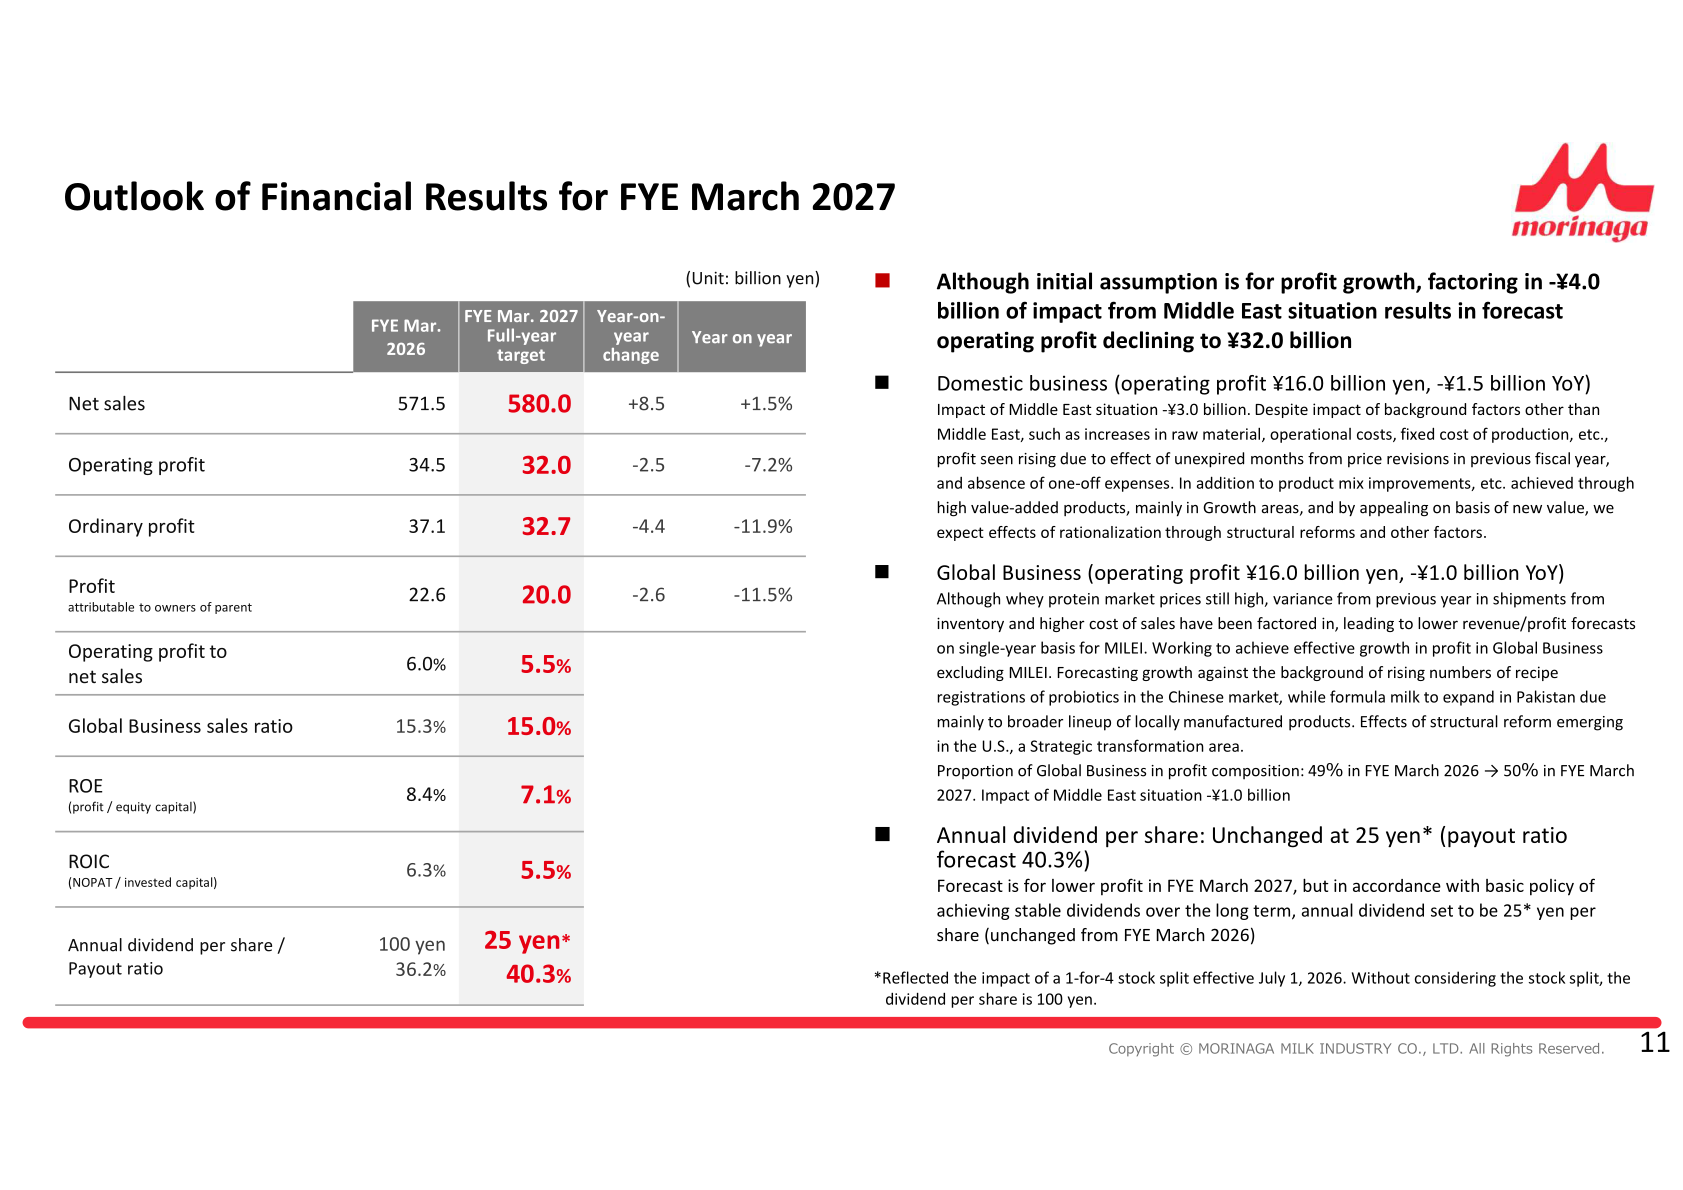
The company’s initial assumption was for operating profit to grow to ¥36.0 billion in FYE March 2027, but the forecast is set at ¥32.0 billion after factoring in a ¥4.0 billion decline attributed to the situation in the Middle East, split between ¥3.0 billion in the domestic business and ¥1.0 billion in the Global Business. The impact is based on assumptions as of early April and is provisionally calculated out to September 2026, with no impact factored in beyond September; the company cites packaging materials such as plastic cups, aluminum and film, and energy costs, as the main areas affected. Domestic business operating profit is guided to ¥16.0 billion (-¥1.5 billion year on year) and Global Business to ¥16.0 billion (-¥1.0 billion), with the Global Business share of profit composition moving from 49% in FYE March 2026 to 50% in FYE March 2027. MILEI net sales are forecast at ¥51.7 billion (-8% year on year), or EUR 287 million (-6%), reflecting the prior year’s higher shipment volumes from inventory and higher cost of sales.
| Item | FYE Mar. 2027 Full-year target | FYE Mar. 2026 (Actual) | Change | Year on year |
|---|---|---|---|---|
| Net sales (billion yen) | 580.0 | 571.5 | +8.5 | +1.5% |
| Operating profit (billion yen) | 32.0 | 34.5 | -2.5 | -7.2% |
| Ordinary profit (billion yen) | 32.7 | 37.1 | -4.4 | -11.9% |
| Profit attributable to owners of parent (billion yen) | 20.0 | 22.6 | -2.6 | -11.5% |
| Operating profit to net sales | 5.5% | 6.0% | — | — |
| Global Business sales ratio | 15.0% | 15.3% | — | — |
| ROE (profit / equity capital) | 7.1% | 8.4% | — | — |
| ROIC (NOPAT / invested capital) | 5.5% | 6.3% | — | — |
| Annual dividend per share | 25 yen | 100 yen | — | — |
| Payout ratio | 40.3% | 36.2% | — | — |
Shareholder Returns
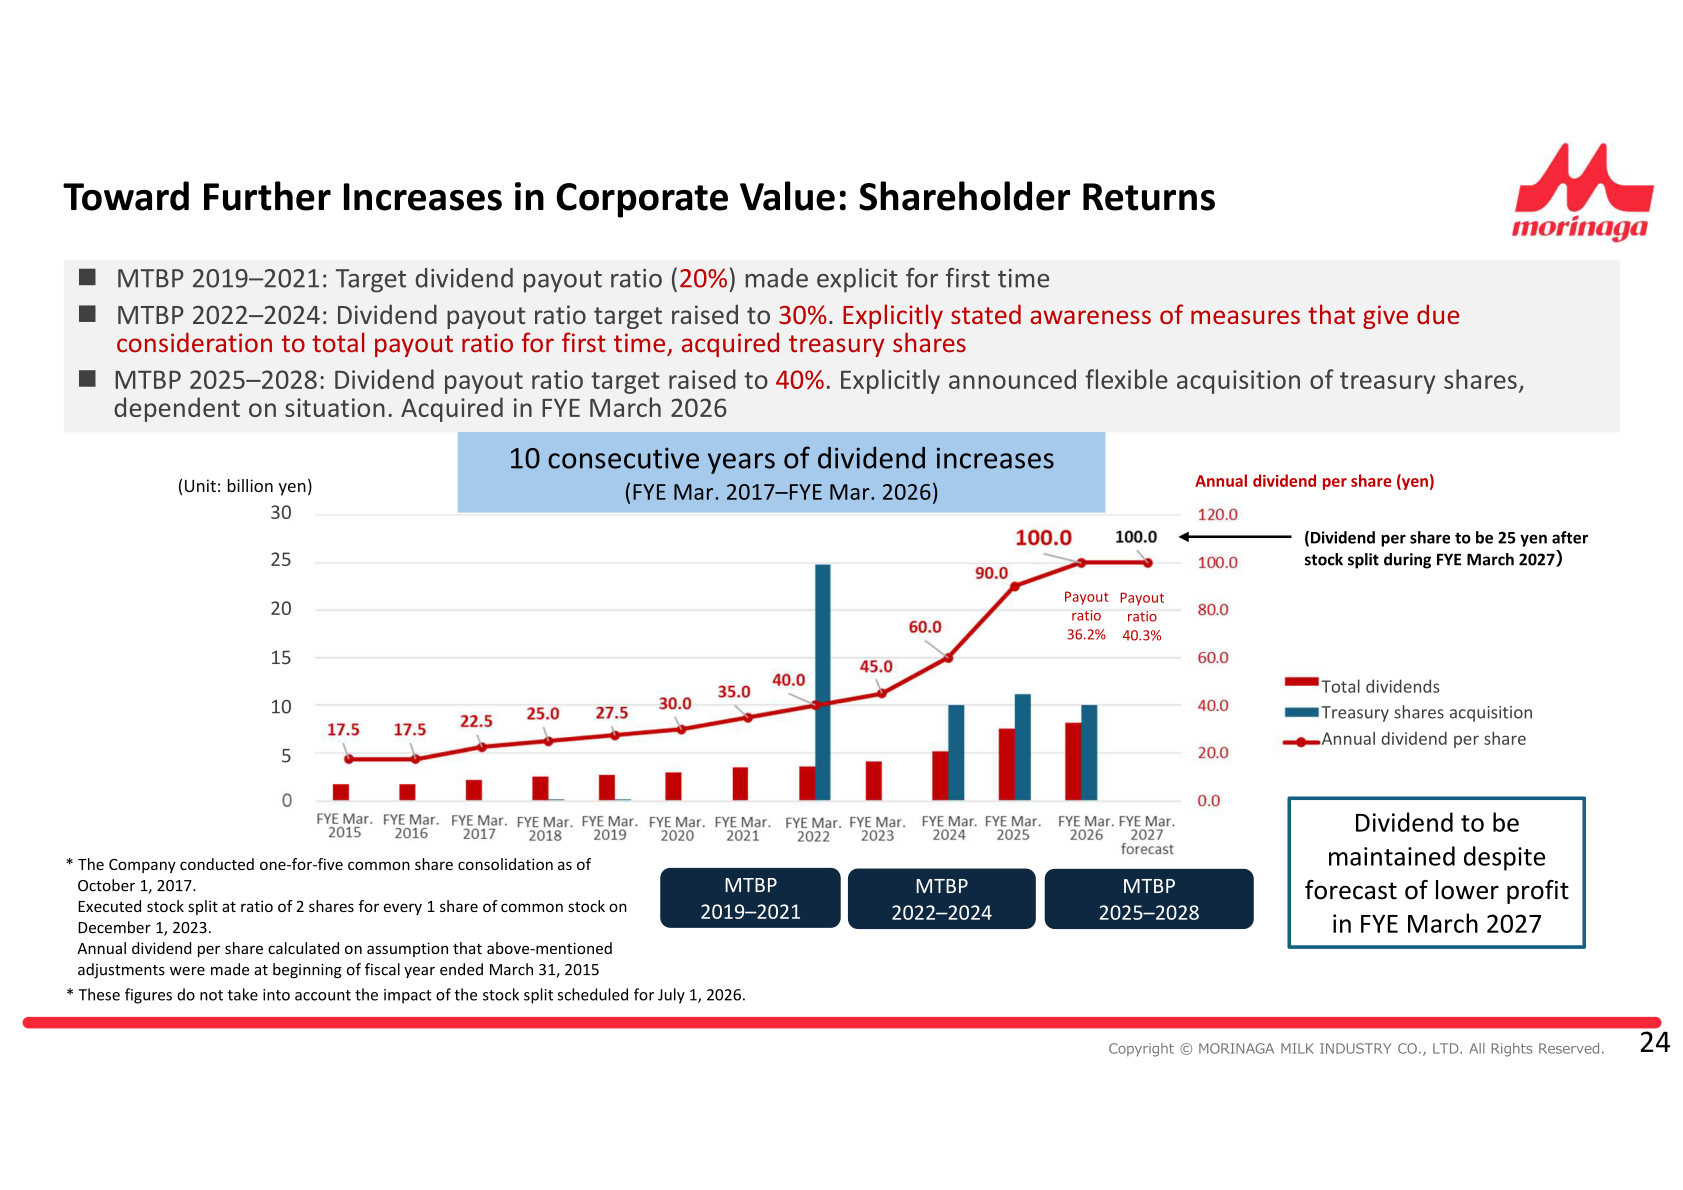
The annual dividend per share for FYE March 2026 was raised to 100 yen from the previous forecast of 93 yen, an upward revision of 7 yen, for a payout ratio of 36.2%. This marked 10 consecutive years of dividend increases from FYE March 2017 to FYE March 2026. For FYE March 2027 the annual dividend per share is set at 25 yen, reflecting the impact of a 1-for-4 stock split effective July 1, 2026; without considering the stock split the dividend per share is 100 yen, unchanged from FYE March 2026, in accordance with the basic policy of achieving stable dividends over the long term despite the forecast of lower profit. The forecast payout ratio is 40.3%. Under Medium-term Business Plan 2025–2028 the dividend payout ratio target was raised to 40%, and the company explicitly announced flexible acquisition of treasury shares depending on the situation, with an acquisition made in FYE March 2026. The stock split of 4 shares for 1 share is intended to establish an environment in which it is easy for investors to make investments and to expand the investor base; the company plans to continue the shareholder incentive program while considering details.
Medium-Term Plan / Topics
Morinaga Milk made no revisions to the numerical targets of Medium-term Business Plan 2025–2028. The Global Business operating profit target for FYE March 2029 of ¥15.0 billion was already surpassed in the first year of the plan with ¥17.0 billion in FYE March 2026, and the second-year forecast is ¥16.0 billion. Against FYE March 2029 targets set versus FYE March 2025, first-year progress in the Growth areas was +2% for yogurt (target +20%), +3% for ice cream (target +20%), +25% for probiotics (target +100%) and +7% for formula milk for overseas (target +70%). On structural reforms, the company has decided to close 2 production locations as announced as of May 13, 2026, and has suspended production at around 25% of domestic paper pack lines, half of the plan’s target; it assumes contributions to earnings from structural reforms and reorganization of production and sales will emerge in FYE March 2028 and beyond.
On capital allocation, planned business investment was revised down from around ¥180 billion to around ¥160 billion, with the ¥20 billion difference to be reconsidered. Within that, Growth segments remain at ¥50 billion, Mainstay segments are cut from ¥50 billion to ¥35 billion, and shared infrastructure and other investment from ¥80 billion to ¥75 billion; the strategic investment framework is unchanged at ¥70 billion, taking total investments from ¥250 billion to ¥230 billion. Cash inflow of about ¥300 billion comprises operating cash flow of about ¥200 billion and about ¥100 billion from interest-bearing liabilities and asset sales, against outflows of about ¥160 billion for business investment, about ¥70 billion for the strategic investment framework and about ¥50 billion for shareholder returns. The company also stated it aims to control asset turnover to 1x in order to achieve its return on capital targets.
In IR activity, the company held 432 meetings with institutional investors and securities analysts during the year, the most ever and about 5 times the level of 2010–2015, against 374 in the prior year. External recognition included the Japan Investor Relations Association “Best IR Award 2025” and the “‘Most Liked!’ IR Award” for a second consecutive year, selection as No.3 of 20 in the Food category in the “FY2025 Awards for Excellence in Corporate Disclosure” by the Securities Analysts Association of Japan, and an “Award for Excellence” at the 5th Nikkei Integrated Report Award.
This article is an analysis based on publicly available information and is not a recommendation to buy or sell any specific securities. Investment decisions are your own responsibility.
![[Obayashi] Investors’ Guide 2026 — The Complete 24-Article Breakdown](https://japan-equity.com/wp-content/uploads/2026/07/hub_cover-1024x1024.png)
![[Obayashi] IR & SR Policy — Feeding Dialogue Back into Management](https://japan-equity.com/wp-content/uploads/2026/07/p32_sq-1024x1024.jpg)
![[Obayashi] Real Estate Development — 18.7% Margin, ¥287.7bn Unrealized Gains](https://japan-equity.com/wp-content/uploads/2026/07/p20_sq-1024x1024.jpg)
![[Obayashi] Domestic Civil Engineering — Resilience Spending Supports 9.6% Margin](https://japan-equity.com/wp-content/uploads/2026/07/p11_sq-1024x1024.jpg)
![[Obayashi] Share Price & External Ratings — vs TOPIX, ESG Index Inclusion](https://japan-equity.com/wp-content/uploads/2026/07/p40_sq-1024x1024.jpg)
![[Construction] ¥75.5tn Investment, Shrinking Workforce — Big-5 Market Share](https://japan-equity.com/wp-content/uploads/2026/07/p12_sq-1024x1024.jpg)



![[Obayashi] Capital Policy & Shareholder Returns — ROE 10%+, DOE ~5%, ¥100bn Buyback](https://japan-equity.com/wp-content/uploads/2026/07/p27_sq-1024x1024.jpg)
![[Obayashi] Reducing Cross-Shareholdings — ¥285.2bn Sold in Five Years](https://japan-equity.com/wp-content/uploads/2026/07/p29_sq-1024x1024.jpg)
![[Obayashi] ¥750bn Investment Plan — ¥300bn to Development, ¥190bn to Tech/DX](https://japan-equity.com/wp-content/uploads/2026/07/p30_sq-1024x1024.jpg)
![[Obayashi] MTP2022 KPIs — Operating Profit ~2x Target, ROE 14.4%](https://japan-equity.com/wp-content/uploads/2026/07/p25_sq-1024x1024.jpg)
![[Obayashi] Cash Allocation — ¥420bn Investment CF Over Five Years](https://japan-equity.com/wp-content/uploads/2026/07/p26_sq-1024x1024.jpg)
![[Obayashi] Green Energy — 44 Plants, 344MW, and the Green Hydrogen Challenge](https://japan-equity.com/wp-content/uploads/2026/07/p21_sq-1024x1024.jpg)
![[Obayashi] Tackling the Labor Shortage — Robotics Construction®](https://japan-equity.com/wp-content/uploads/2026/07/p14_sq-1024x1024.jpg)
