
This article is based on publicly available IR materials and is not a recommendation to buy or sell any specific securities.
Nihon M&A Center Holdings Inc. closed FY2025, the fiscal year to March 2026, with increases in both revenue and profit: sales of 50,257 ¥mn (+14.0% YoY) and ordinary profit of 19,154 ¥mn (+13.2% YoY). Both figures exceeded the company’s original full-year earnings forecasts, which the materials describe as the first simultaneous achievement in five fiscal years, and the next fiscal year’s targets set under the Mid-term Management Plan were achieved one year ahead of schedule. The company states that, after moving through a recovery phase following the misconduct, it is transitioning to a renewed growth phase, and it has defined FY2026 as the start of its second founding.
Consolidated Results (Full-Year Actual)
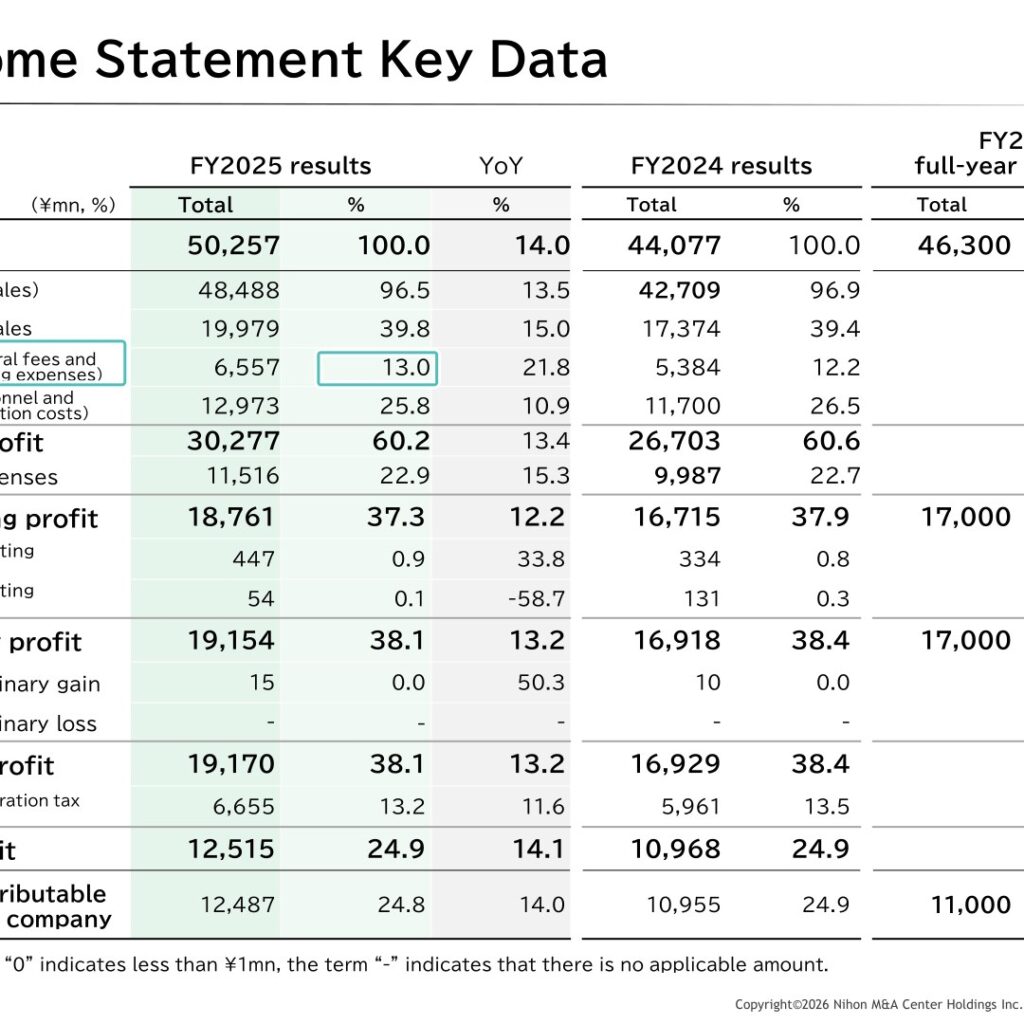
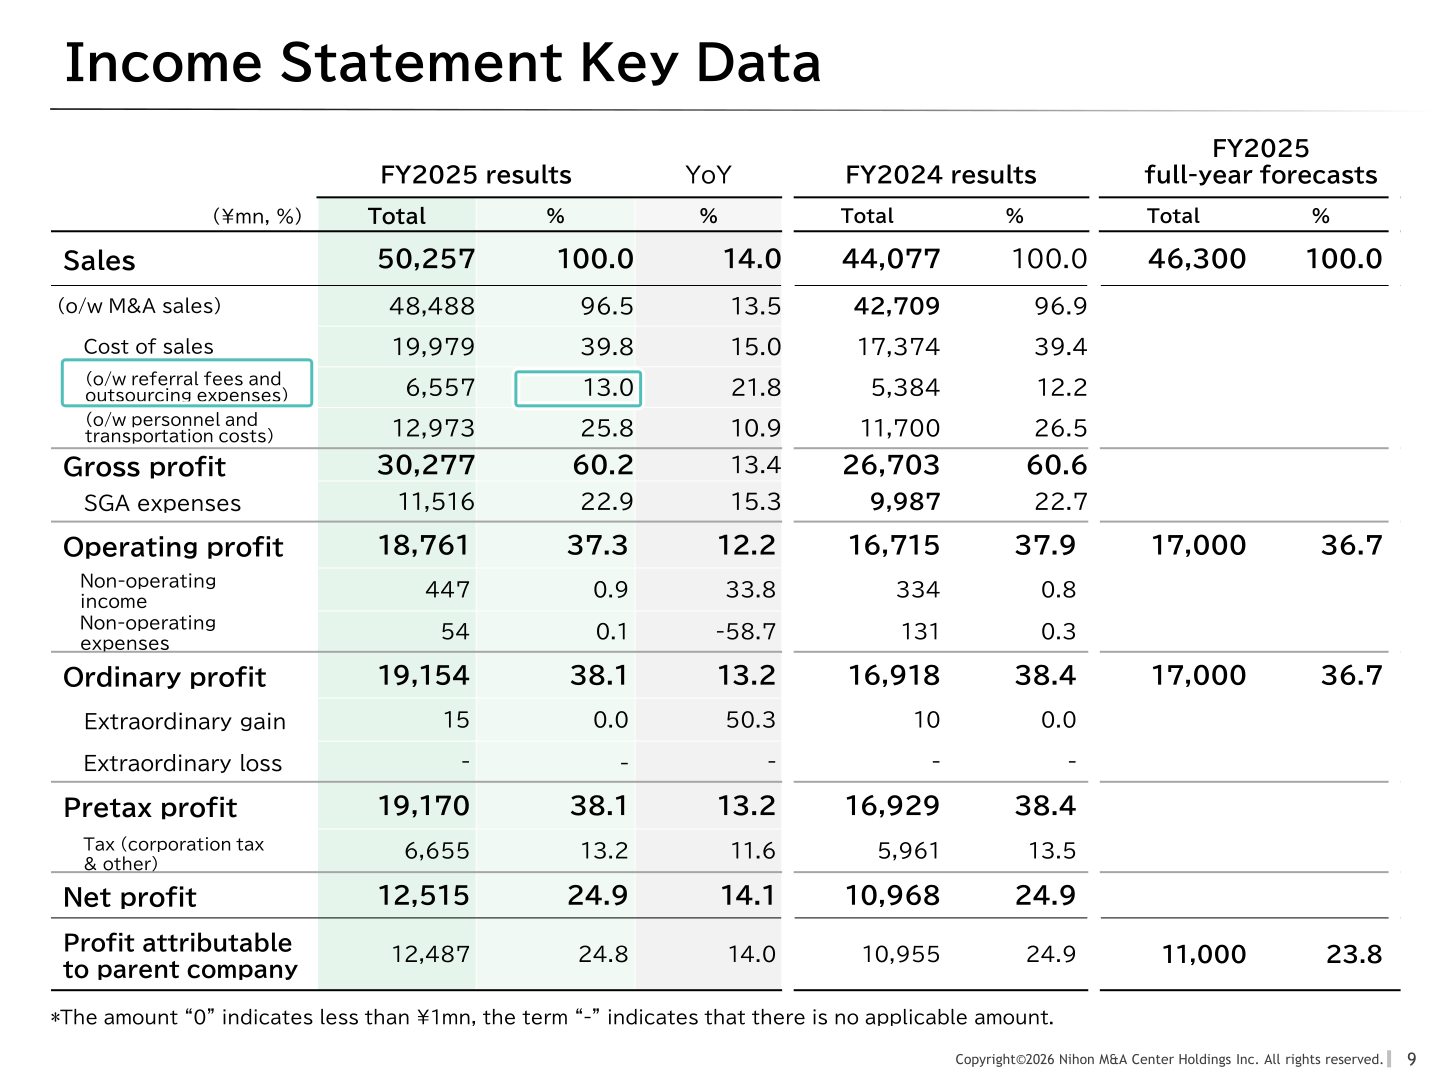
Sales rose 14.0% to 50,257 ¥mn against a full-year forecast of 46,300 ¥mn, an achievement rate of 108.5%. Ordinary profit rose 13.2% to 19,154 ¥mn against a forecast of 17,000 ¥mn, an achievement rate of 112.7%. The ordinary profit margin was 38.1%, a 0.3 percentage point decrease versus the prior year. Cost of sales increased 15.0% and SGA expenses increased 15.3%; within cost of sales, referral fees were 6,557 ¥mn, up 1,173 ¥mn versus the prior year, with the referral fee ratio at 13.0%, a 0.8 percentage point increase versus the prior year. IT costs within SGA expenses were 1,091 ¥mn.
In the financial year to March 2026 the company reclassified its employees in order to make categorization more explicit. As a result of the change, the prior year’s cost of sales reduces by 1,924 ¥mn and SGA expenses increase by 1,924 ¥mn (as reported 19,298 ¥mn versus 17,374 ¥mn reclassified), while total employee costs of 27,361 ¥mn are unchanged. Prior-year comparatives in the income statement below are shown on the reclassified basis used in the materials.
| Item (¥mn) | FY2025 | FY2024 | YoY | FY2025 full-year forecast |
|---|---|---|---|---|
| Sales | 50,257 | 44,077 | 14.0 | 46,300 |
| (o/w M&A sales) | 48,488 | 42,709 | 13.5 | — |
| Cost of sales | 19,979 | 17,374 | 15.0 | — |
| Gross profit | 30,277 | 26,703 | 13.4 | — |
| SGA expenses | 11,516 | 9,987 | 15.3 | — |
| Operating profit | 18,761 | 16,715 | 12.2 | 17,000 |
| Ordinary profit | 19,154 | 16,918 | 13.2 | 17,000 |
| Net profit | 12,515 | 10,968 | 14.1 | — |
| Profit attributable to parent company | 12,487 | 10,955 | 14.0 | 11,000 |
Key Operating Indicators
The full-year number of transactions closed declined year on year, from 1,078 to 1,061, while M&A sales per transaction rose to 45.7 ¥mn. The company attributes the higher revenue per transaction to further benefits from policies for mid-cap companies, an increasing share of mid-sized deals and a significant decline in the share of small-sized deals. The number of new sell-side mandates, a leading indicator, also declined, which the company explains as a deliberate shift from a high-volume mandate acquisition policy to a mandate acceptance policy that emphasizes deal quality; the median preparatory period was shortened to about 60 days and remained stable.
| Indicator | FY2025 | FY2024 | YoY change |
|---|---|---|---|
| Total number of transactions closed (by no. of companies) | 1,061 | 1,078 | -1.6% (-17) |
| Number of sell-side transactions closed | 528 | 539 | — |
| Number of buy-side transactions closed | 533 | 539 | — |
| Total number of deals | 542 | 554 | — |
| M&A sales (¥mn) | 48,488 | 42,709 | 13.5 |
| M&A sales per transaction (¥mn) | 45.7 | 39.6 | +15.4% (+6.1) |
| Large transactions closed (total success fees in excess of 100 ¥mn, no. of deals) | 115 | — | +45.6% (+36) |
| Number of new sell-side mandates | 1,283 | 1,432 | — |
| Budget achiever ratio | 62.5% | 50.0% | +12.5pt |
| Budget-achieving department ratio | 67.4% | 29.7% | +37.7pt |
| M&A consultants (period end) | 626 | 630 | -4 |
| Total employees, consolidated (period end) | 1,062 | 1,086 | — |
On the balance sheet, total assets were 66,223 ¥mn at end-March 2026, a change of 4,436 ¥mn, including cash and deposits of 40,447 ¥mn. Net assets were 50,643 ¥mn, or 76.5% of total liabilities and net assets, and interest bearing liabilities were 4,000 ¥mn. The company describes this as maintaining a healthy balance sheet.
Business Breakdown: M&A and Other Activities
The materials disclose a split between M&A sales and other sales. M&A sales were 48,488 ¥mn (113.5% YoY) and other sales were 1,768 ¥mn (129.2% YoY), with the company noting that growth in the PMI business and other related activities drove the 29.2% YoY increase in other sales. The company notes that the prior-year gross profit shown in this breakdown does not take into account the change in personnel classification and therefore differs from the figures presented on other pages of the materials.
| Item (¥mn) | FY2025 | Ratio | YoY | FY2024 |
|---|---|---|---|---|
| M&A sales | 48,488 | 100.0% | 113.5% | 42,709 |
| M&A cost of sales (referral fees and outsourcing expenses) | 6,557 | 13.5% | 121.8% | 5,384 |
| M&A gross profit | 41,931 | 86.5% | 112.3% | 37,325 |
| Other sales | 1,768 | 100.0% | 129.2% | 1,368 |
| Other cost of sales | 447 | 25.3% | 154.5% | 289 |
| Other gross profit | 1,320 | 74.7% | 122.5% | 1,078 |
| Unallocated cost of sales (personnel, transportation, other) | 12,973 | 25.8% | 95.2% | 13,624 |
| Gross profit | 30,277 | 60.2% | 122.2% | 24,779 |
FY2026 Forecast
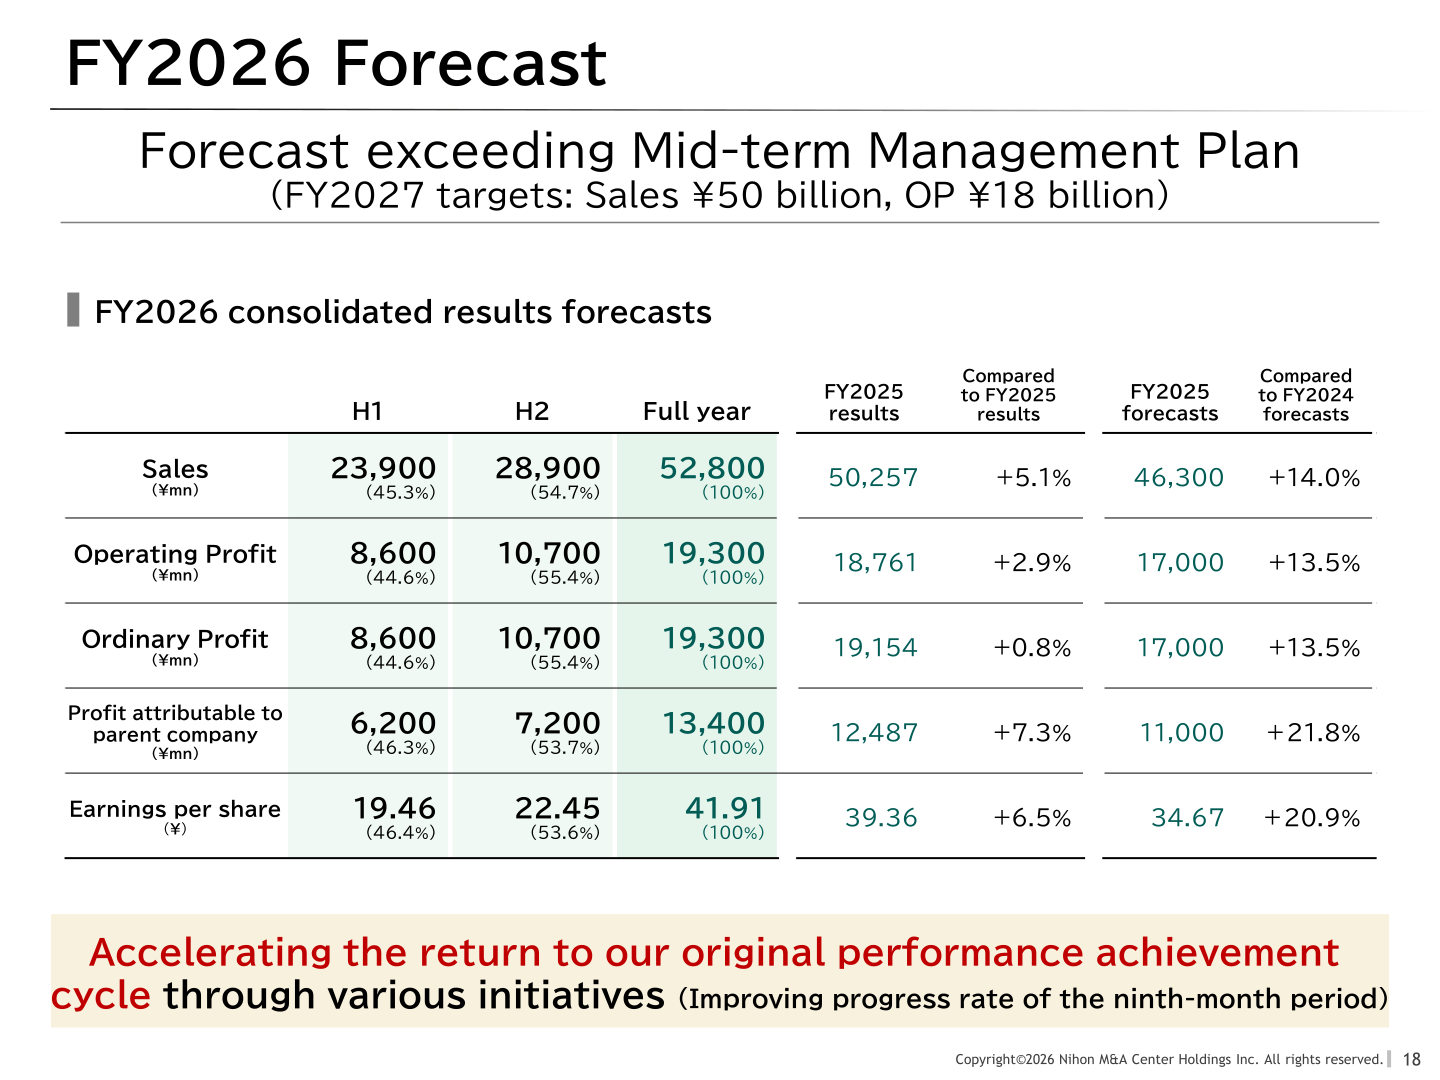
For FY2026 the company forecasts sales of 52,800 ¥mn (+5.1% versus the FY2025 result) and ordinary profit of 19,300 ¥mn (+0.8%), with profit attributable to parent company of 13,400 ¥mn (+7.3%) and earnings per share of 41.91 yen (+6.5%). The company positions the forecast as exceeding the Mid-term Management Plan and says it is accelerating the return to its original performance achievement cycle through various initiatives, including improving the progress rate of the ninth-month period.
| Item | H1 | H2 | Full year | FY2025 (Actual) | Compared to FY2025 results |
|---|---|---|---|---|---|
| Sales (¥mn) | 23,900 | 28,900 | 52,800 | 50,257 | +5.1% |
| Operating profit (¥mn) | 8,600 | 10,700 | 19,300 | 18,761 | +2.9% |
| Ordinary profit (¥mn) | 8,600 | 10,700 | 19,300 | 19,154 | +0.8% |
| Profit attributable to parent company (¥mn) | 6,200 | 7,200 | 13,400 | 12,487 | +7.3% |
| Earnings per share (¥) | 19.46 | 22.45 | 41.91 | 39.36 | +6.5% |
Shareholder Returns
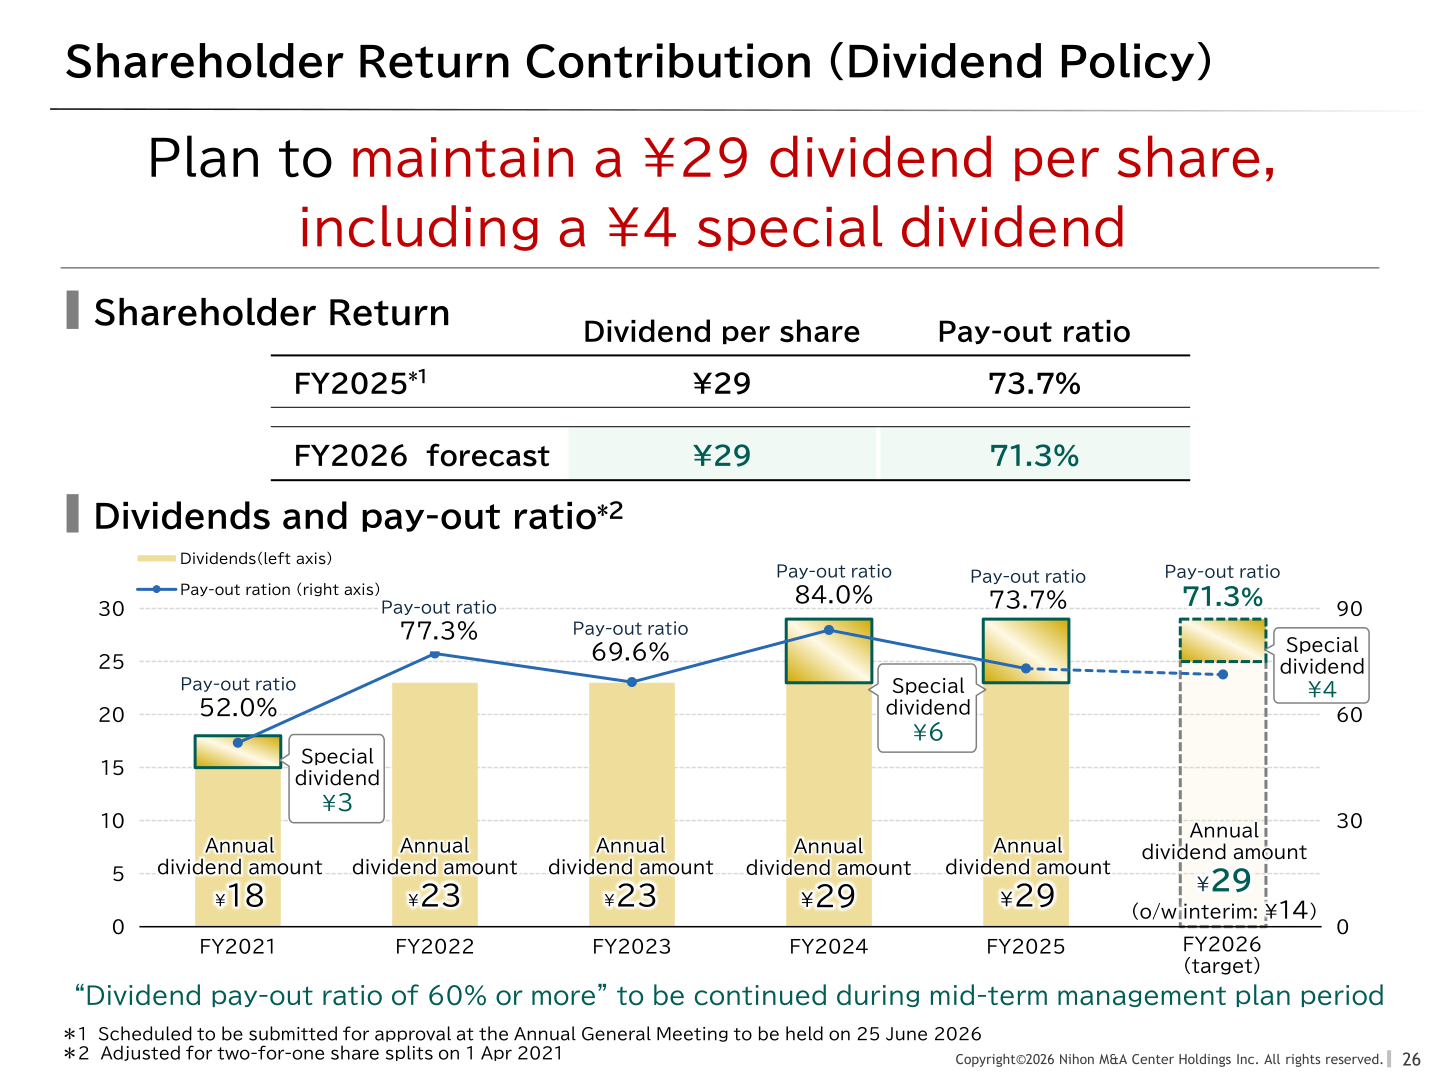
The dividend per share for FY2025 is ¥29, giving a pay-out ratio of 73.7%; this is scheduled to be submitted for approval at the Annual General Meeting to be held on 25 June 2026. For FY2026 the company forecasts an annual dividend of ¥29 per share, a pay-out ratio of 71.3%, and states that it plans to maintain a ¥29 dividend per share including a ¥4 special dividend. The policy of a dividend pay-out ratio of 60% or more is to be continued during the mid-term management plan period. ROE was 25.7% in FY2025 and is shown at 24.4% for the FY2026 forecast, with the company stating that ROE is to progress over 20%.
Mid-Term Management Plan and Next Genesis (Vision 300)
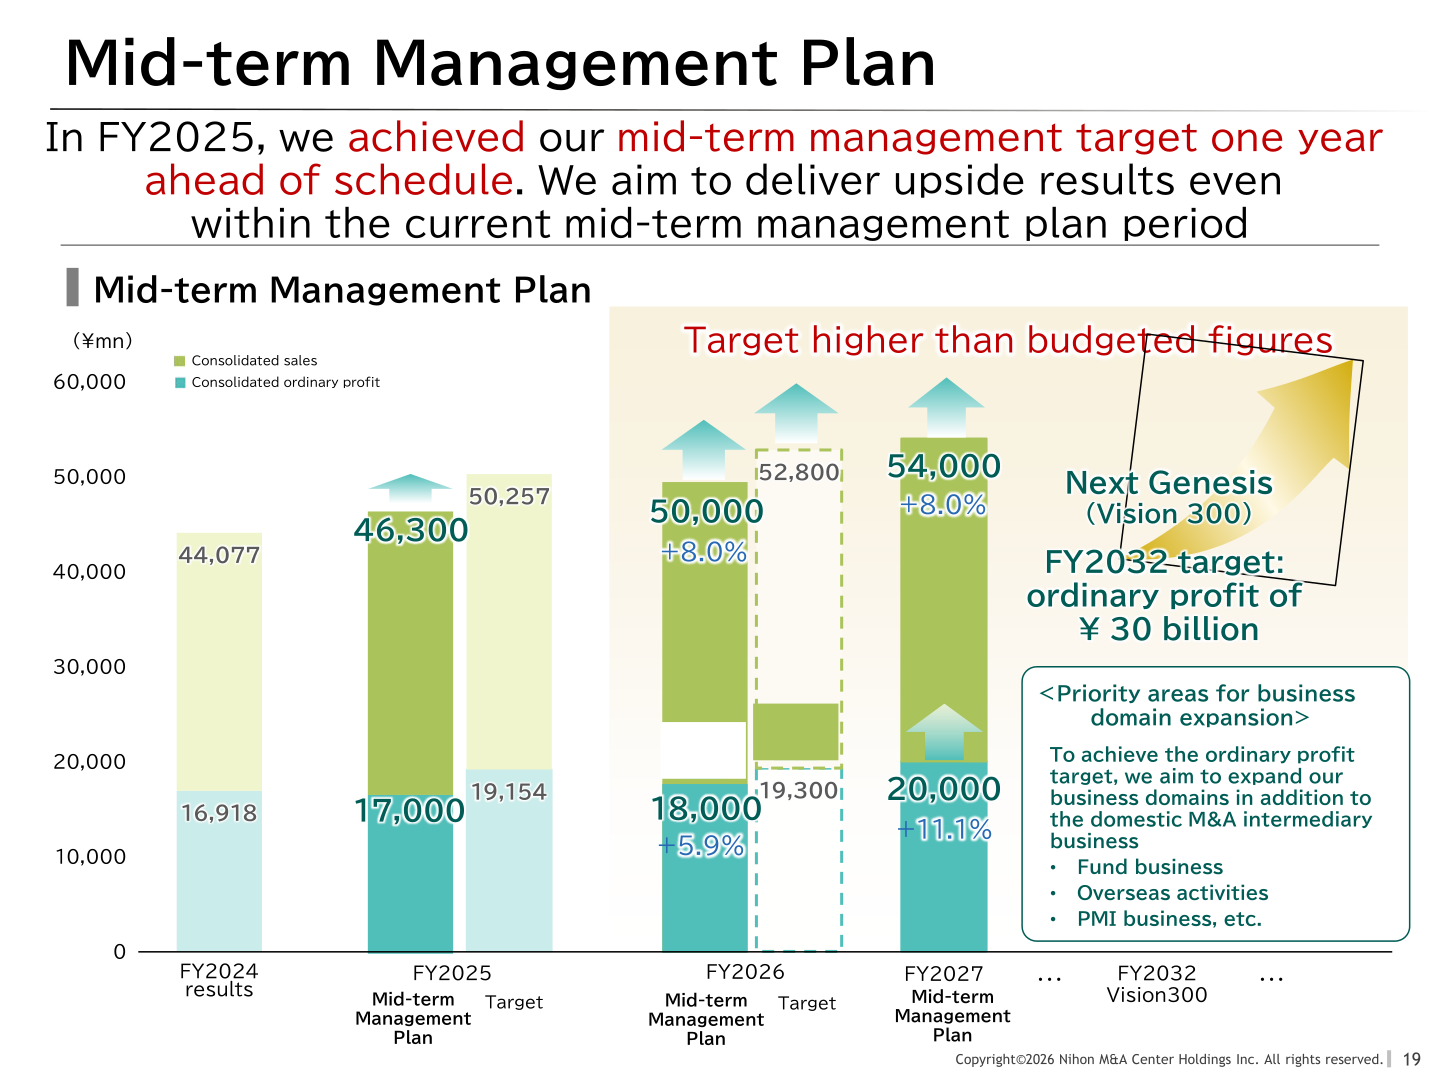
In FY2025 the company achieved its mid-term management target one year ahead of schedule. Under the Mid-term Management Plan the FY2026 targets are consolidated sales of 50,000 ¥mn and consolidated ordinary profit of 18,000 ¥mn, and the FY2027 targets are consolidated sales of 54,000 ¥mn and consolidated ordinary profit of 20,000 ¥mn; the FY2026 forecast of 52,800 ¥mn in sales and 19,300 ¥mn in ordinary profit stands above the plan figure for that year. To mark the 35th anniversary of its founding, the company formulated “Next Genesis (Vision 300),” which sets the year ending March 2033 as its target year with an FY2032 target of ordinary profit of ¥30 billion. To achieve that target the company aims to expand its business domains in addition to the domestic M&A intermediary business, citing the fund business, overseas activities and the PMI business as priority areas.
Alongside the plan, the company announced the introduction of trust-type stock compensation plans for directors and employees, scheduled to be finalized upon resolution at the Annual General Meeting to be held on June 25, 2026, and an expansion and relocation of the Tokyo head office planned for spring 2029, consolidating four non-contiguous floors into two floors. It also redefined the Group’s Vision and renewed the existing Philosophy as Core Values, and restructured the sales organization into divisions covering listed companies, mid-sized companies and SMEs.
Topics
Equity-method affiliate Batonz. Co., Ltd. <554A> was newly listed on the Tokyo Stock Exchange Growth Market on April 21, at an offering price of ¥660 and an opening price of ¥1,674 (+¥1,014, +153.6%); Batonz had closed 3,315 transactions to date as at February 28, 2026. In the PMI consulting business the group received 132 orders in FY2025, up from 93 in FY2024 and exceeding 40% YoY growth. In TOKYO PRO Market IPO support, the cumulative number of companies sponsored by Nihon M&A Center reached 49 out of 176 firms listed in total as at end-March 2026, with five new listings supported in the fourth quarter. Overseas, 17 M&A deals involving overseas companies were closed during FY2025, described as a record high for the full year, with five ASEAN locations now entering a full-fledged profit generation phase.
Share ownership as of 31 Mar 2026 comprised individuals 32.7%, financial institutions 29.1%, foreign investors 27.5%, treasury stock 5.8%, other corporations 2.4% and securities companies 2.4%, with 103,995 shareholders and 336,934,800 shares issued.
This article is an analysis based on publicly available information and is not a recommendation to buy or sell any specific securities. Investment decisions are your own responsibility.
![[Obayashi] Investors’ Guide 2026 — The Complete 24-Article Breakdown](https://japan-equity.com/wp-content/uploads/2026/07/hub_cover-1024x1024.png)
![[Obayashi] IR & SR Policy — Feeding Dialogue Back into Management](https://japan-equity.com/wp-content/uploads/2026/07/p32_sq-1024x1024.jpg)
![[Obayashi] Real Estate Development — 18.7% Margin, ¥287.7bn Unrealized Gains](https://japan-equity.com/wp-content/uploads/2026/07/p20_sq-1024x1024.jpg)
![[Obayashi] Domestic Civil Engineering — Resilience Spending Supports 9.6% Margin](https://japan-equity.com/wp-content/uploads/2026/07/p11_sq-1024x1024.jpg)
![[Obayashi] Share Price & External Ratings — vs TOPIX, ESG Index Inclusion](https://japan-equity.com/wp-content/uploads/2026/07/p40_sq-1024x1024.jpg)
![[Construction] ¥75.5tn Investment, Shrinking Workforce — Big-5 Market Share](https://japan-equity.com/wp-content/uploads/2026/07/p12_sq-1024x1024.jpg)



![[Obayashi] Capital Policy & Shareholder Returns — ROE 10%+, DOE ~5%, ¥100bn Buyback](https://japan-equity.com/wp-content/uploads/2026/07/p27_sq-1024x1024.jpg)
![[Obayashi] Reducing Cross-Shareholdings — ¥285.2bn Sold in Five Years](https://japan-equity.com/wp-content/uploads/2026/07/p29_sq-1024x1024.jpg)
![[Obayashi] ¥750bn Investment Plan — ¥300bn to Development, ¥190bn to Tech/DX](https://japan-equity.com/wp-content/uploads/2026/07/p30_sq-1024x1024.jpg)
![[Obayashi] MTP2022 KPIs — Operating Profit ~2x Target, ROE 14.4%](https://japan-equity.com/wp-content/uploads/2026/07/p25_sq-1024x1024.jpg)
![[Obayashi] Cash Allocation — ¥420bn Investment CF Over Five Years](https://japan-equity.com/wp-content/uploads/2026/07/p26_sq-1024x1024.jpg)
![[Obayashi] Green Energy — 44 Plants, 344MW, and the Green Hydrogen Challenge](https://japan-equity.com/wp-content/uploads/2026/07/p21_sq-1024x1024.jpg)
![[Obayashi] Tackling the Labor Shortage — Robotics Construction®](https://japan-equity.com/wp-content/uploads/2026/07/p14_sq-1024x1024.jpg)
