
This article is based on publicly available IR materials and is not a recommendation to buy or sell any specific securities.
Note: This article is based on Takasago Thermal Engineering’s English-language “Financial Results Briefing Materials for the fiscal year ended on 31st Mar 2026”, released on 12 May 2026 (revised version dated 12 June 2026). The company labels the year ended 31 March 2026 as FY2025.
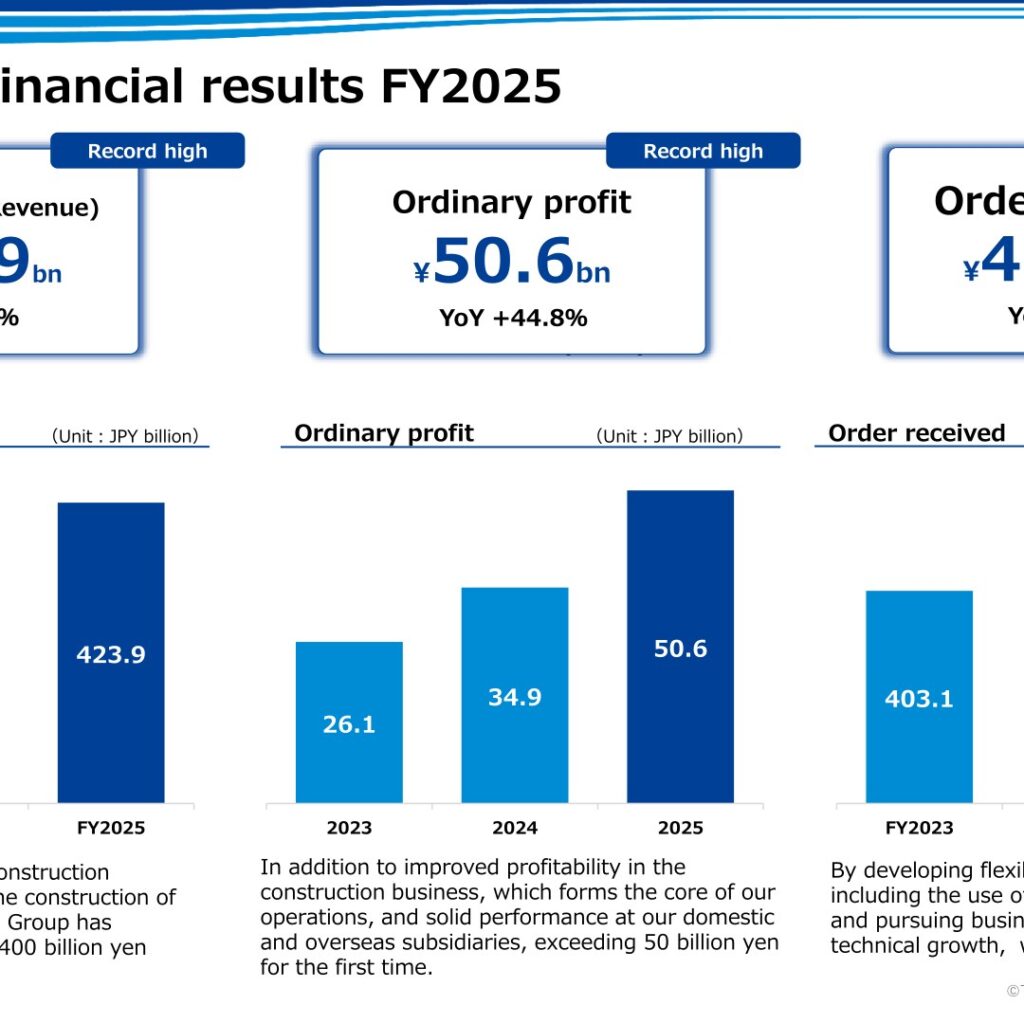
Takasago Thermal Engineering Co., Ltd. closed the fiscal year ended 31 March 2026 (FY2025) with record highs in revenue, profit at each stage, profit margins, order intake and carry-forward work in progress. Consolidated net sales rose 11.1% year on year to 423,923 million yen, taking group turnover above 400 billion yen for the first time, while ordinary profit advanced 44.8% to 50,642 million yen and exceeded 50 billion yen for the first time. Order intake climbed 10.6% to 460,057 million yen. For FY2026 the company plans a further record for both revenue and profit, and has set an order target above 500 billion yen for the first time.
Consolidated Results (Full-Year Actual)
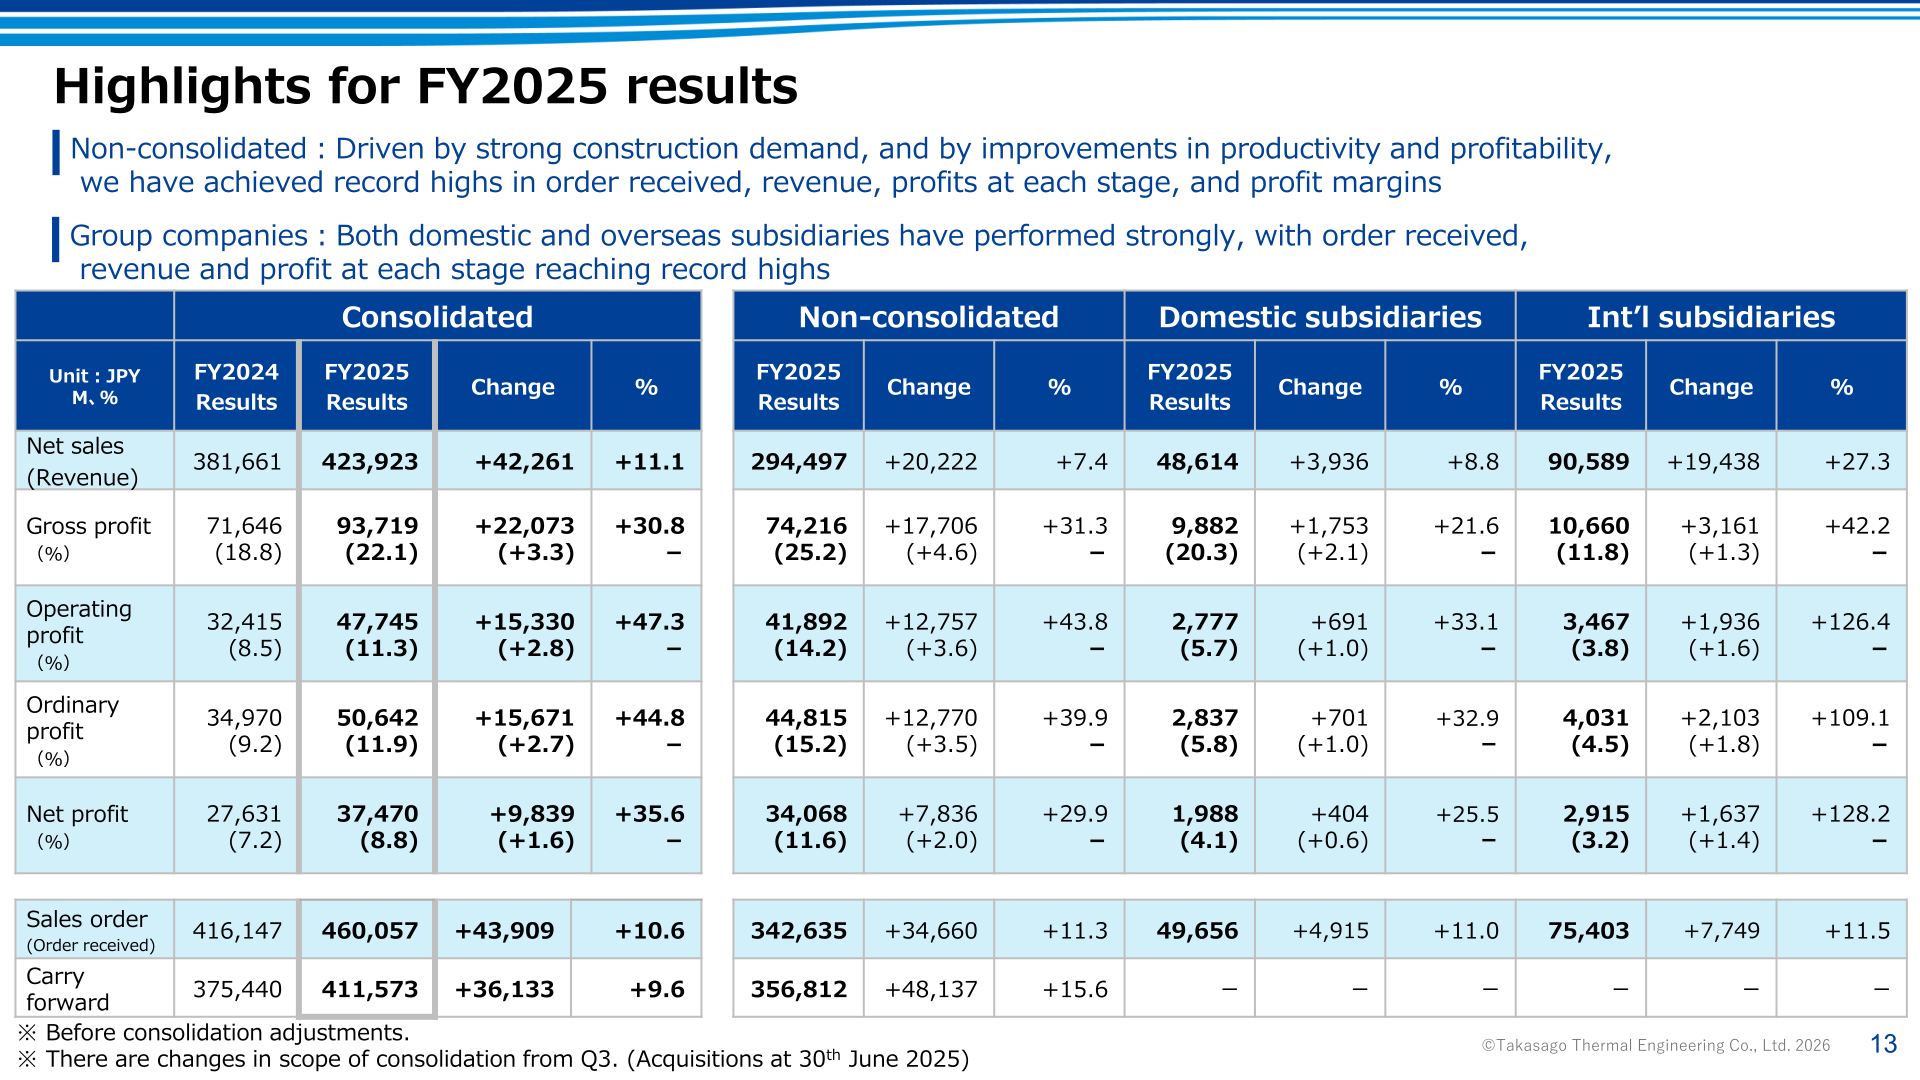
On a consolidated basis, gross profit rose 30.8% to 93,719 million yen and the gross profit margin improved 3.3 percentage points to 22.1%. Operating profit increased 47.3% to 47,745 million yen (margin 11.3%), ordinary profit rose 44.8% to 50,642 million yen (margin 11.9%) and net profit rose 35.6% to 37,470 million yen (margin 8.8%). ROE improved to 19.2% from 16.0%. Order intake reached 460,057 million yen and the carry-forward balance grew 9.6% to 411,573 million yen. Presenting the headline figures on a billion-yen basis, the company reported net sales of 423.9 billion yen (YoY +11.1%), ordinary profit of 50.6 billion yen (YoY +44.8%) and order intake of 460.0 billion yen (YoY +10.6%), each described as a record high. Fourth-quarter revenue reached a record 117.8 billion yen, and revenue in every quarter of FY2025 set a new record high.
| Item (Unit: JPY M, %) | FY2025 | FY2024 | Change | % Change |
|---|---|---|---|---|
| Net sales (Revenue) | 423,923 | 381,661 | +42,261 | +11.1 |
| Gross profit (margin) | 93,719 (22.1) | 71,646 (18.8) | +22,073 (+3.3) | +30.8 |
| Operating profit (margin) | 47,745 (11.3) | 32,415 (8.5) | +15,330 (+2.8) | +47.3 |
| Ordinary profit (margin) | 50,642 (11.9) | 34,970 (9.2) | +15,671 (+2.7) | +44.8 |
| Net profit (margin) | 37,470 (8.8) | 27,631 (7.2) | +9,839 (+1.6) | +35.6 |
| Sales order (Order received) | 460,057 | 416,147 | +43,909 | +10.6 |
| Carry forward | 411,573 | 375,440 | +36,133 | +9.6 |
| ROE | 19.2 | 16.0 | – | – |
Parent Company and Group Companies
On a non-consolidated basis, the company stated that strong construction demand together with improvements in productivity and profitability produced record highs in order received, revenue, profits at each stage and profit margins. Non-consolidated net sales rose 7.4% to 294,497 million yen, gross profit rose 31.3% to 74,216 million yen (margin 25.2%), operating profit rose 43.8% to 41,892 million yen (margin 14.2%), ordinary profit rose 39.9% to 44,815 million yen (margin 15.2%) and profit rose 29.9% to 34,068 million yen. Non-consolidated order intake rose 11.3% to 342,635 million yen and carry forward rose 15.6% to 356,812 million yen. Domestic subsidiaries recorded net sales of 48,614 million yen (+8.8%) and ordinary profit of 2,837 million yen (+32.9%), while international subsidiaries recorded net sales of 90,589 million yen (+27.3%) and ordinary profit of 4,031 million yen (+109.1%). Figures for the parent company and subsidiaries are stated before consolidation adjustments, and the scope of consolidation changed from the third quarter following acquisitions on 30 June 2025.
Within the non-consolidated order intake, the General segment rose 34.4% to 211,819 million yen while the Industrial segment fell 13.0% to 130,815 million yen. The company attributed the growth in general air conditioning to company-wide optimised order-taking activities. In the international business, revenue exceeded 90 billion yen for the first time as construction progressed mainly at semiconductor and electronics-related plants in Thailand, Singapore and Malaysia and at battery and pharmaceutical-related plants in India; the international gross profit margin improved 1.3 percentage points to 11.8%.
Segment Results
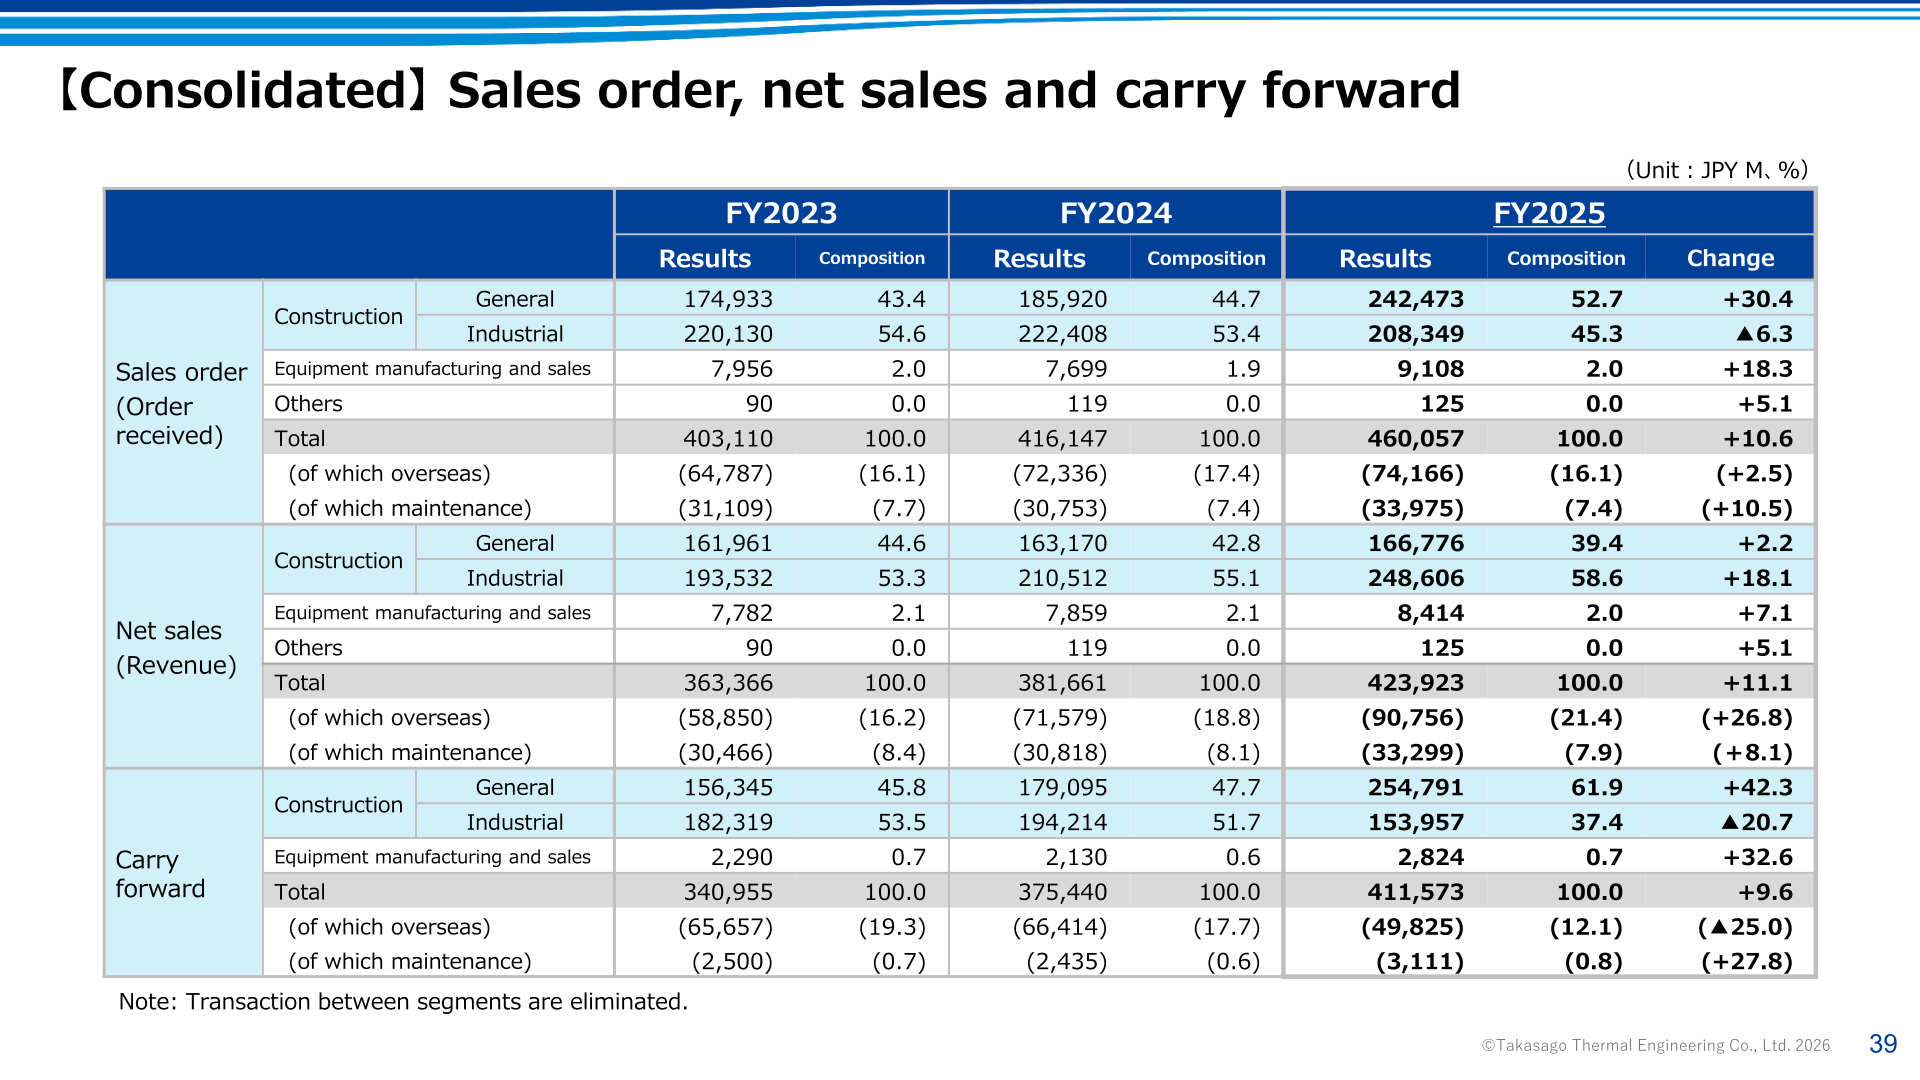
On a consolidated basis, construction order intake in the General segment rose 30.4% to 242,473 million yen (52.7% of the total), while the Industrial segment declined 6.3% to 208,349 million yen (45.3%). Revenue moved in the opposite direction, with Industrial construction up 18.1% to 248,606 million yen (58.6% of the total) against General construction up 2.2% to 166,776 million yen (39.4%). Carry forward in the General segment rose 42.3% to 254,791 million yen, whereas Industrial carry forward fell 20.7% to 153,957 million yen. Overseas revenue reached 90,756 million yen, or 21.4% of consolidated revenue.
| Item (Unit: JPY M, %) | Segment | FY2025 | FY2024 | Change % |
|---|---|---|---|---|
| Sales order (Order received) | Construction – General | 242,473 | 185,920 | +30.4 |
| Sales order (Order received) | Construction – Industrial | 208,349 | 222,408 | ▲6.3 |
| Sales order (Order received) | Equipment manufacturing and sales | 9,108 | 7,699 | +18.3 |
| Sales order (Order received) | Others | 125 | 119 | +5.1 |
| Sales order (Order received) | Total | 460,057 | 416,147 | +10.6 |
| Net sales (Revenue) | Construction – General | 166,776 | 163,170 | +2.2 |
| Net sales (Revenue) | Construction – Industrial | 248,606 | 210,512 | +18.1 |
| Net sales (Revenue) | Equipment manufacturing and sales | 8,414 | 7,859 | +7.1 |
| Net sales (Revenue) | Others | 125 | 119 | +5.1 |
| Net sales (Revenue) | Total | 423,923 | 381,661 | +11.1 |
| Carry forward | Construction – General | 254,791 | 179,095 | +42.3 |
| Carry forward | Construction – Industrial | 153,957 | 194,214 | ▲20.7 |
| Carry forward | Equipment manufacturing and sales | 2,824 | 2,130 | +32.6 |
| Carry forward | Total | 411,573 | 375,440 | +9.6 |
Balance Sheet and Cash Flow
Total assets increased 46,874 million yen to 381,823 million yen at 31 March 2026, driven mainly by higher accounts receivable for completed works as construction progressed. Net assets rose 30,773 million yen to 215,056 million yen and the equity ratio improved 1.1 points to 55.0%. On a cash flow basis (figures rounded, excluding the effect of exchange rates), operating cash flow was +29.7 billion yen, investing cash flow was ▲11.8 billion yen and financing cash flow was ▲16.9 billion yen, leaving cash and cash equivalents at 42.5 billion yen at the end of March 2026 against 41.3 billion yen a year earlier. Investing cash outflows reflected the acquisition of investment securities (green real estate), the acquisition of shares in a facilities-related company in Thailand and capital contributions for the formation of partnerships.
FY2026 Forecast
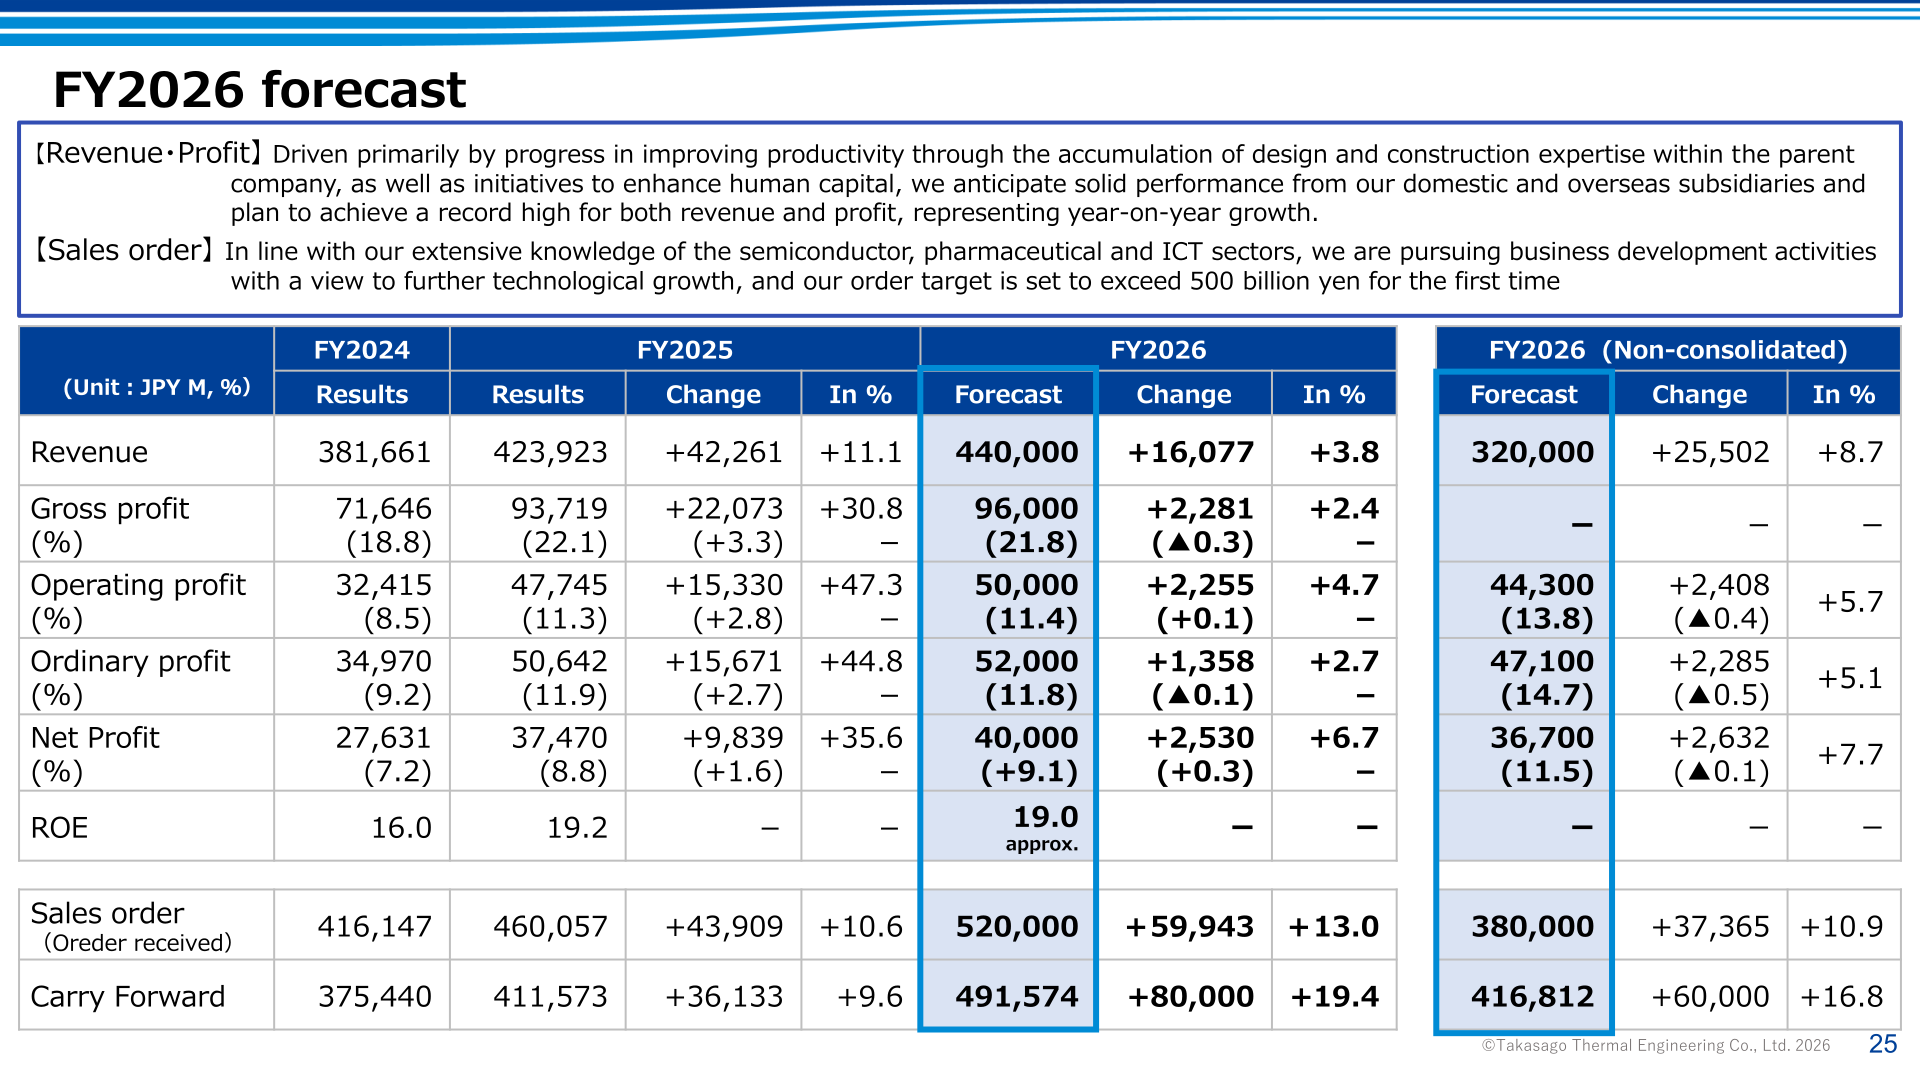
For FY2026 the company forecasts consolidated revenue of 440,000 million yen (+3.8%), gross profit of 96,000 million yen (margin 21.8%), operating profit of 50,000 million yen (margin 11.4%), ordinary profit of 52,000 million yen (margin 11.8%) and net profit of 40,000 million yen, with ROE of approximately 19.0%. Order intake is targeted at 520,000 million yen (+13.0%), which the company describes as exceeding 500 billion yen for the first time, and carry forward is projected at 491,574 million yen. On a non-consolidated basis the company forecasts revenue of 320,000 million yen and ordinary profit of 47,100 million yen. Regarding the situation in the Middle East, the company estimates that even assuming a 20-30% decline in construction progress on potentially affected carry-over projects, the impact on non-consolidated operating profit would be approximately 2-3%, and this has been reflected in the plan.
| Item (Unit: JPY M, %) | FY2026 Forecast (Consolidated) | FY2025 (Actual) | Change | % Change | FY2026 Forecast (Non-consolidated) |
|---|---|---|---|---|---|
| Revenue | 440,000 | 423,923 | +16,077 | +3.8 | 320,000 |
| Gross profit (margin) | 96,000 (21.8) | 93,719 (22.1) | +2,281 (▲0.3) | +2.4 | – |
| Operating profit (margin) | 50,000 (11.4) | 47,745 (11.3) | +2,255 (+0.1) | +4.7 | 44,300 (13.8) |
| Ordinary profit (margin) | 52,000 (11.8) | 50,642 (11.9) | +1,358 (▲0.1) | +2.7 | 47,100 (14.7) |
| Net profit (margin) | 40,000 (+9.1) | 37,470 (8.8) | +2,530 (+0.3) | +6.7 | 36,700 (11.5) |
| ROE | 19.0 approx. | 19.2 | – | – | – |
| Sales order (Order received) | 520,000 | 460,057 | +59,943 | +13.0 | 380,000 |
| Carry forward | 491,574 | 411,573 | +80,000 | +19.4 | 416,812 |
Shareholder Returns
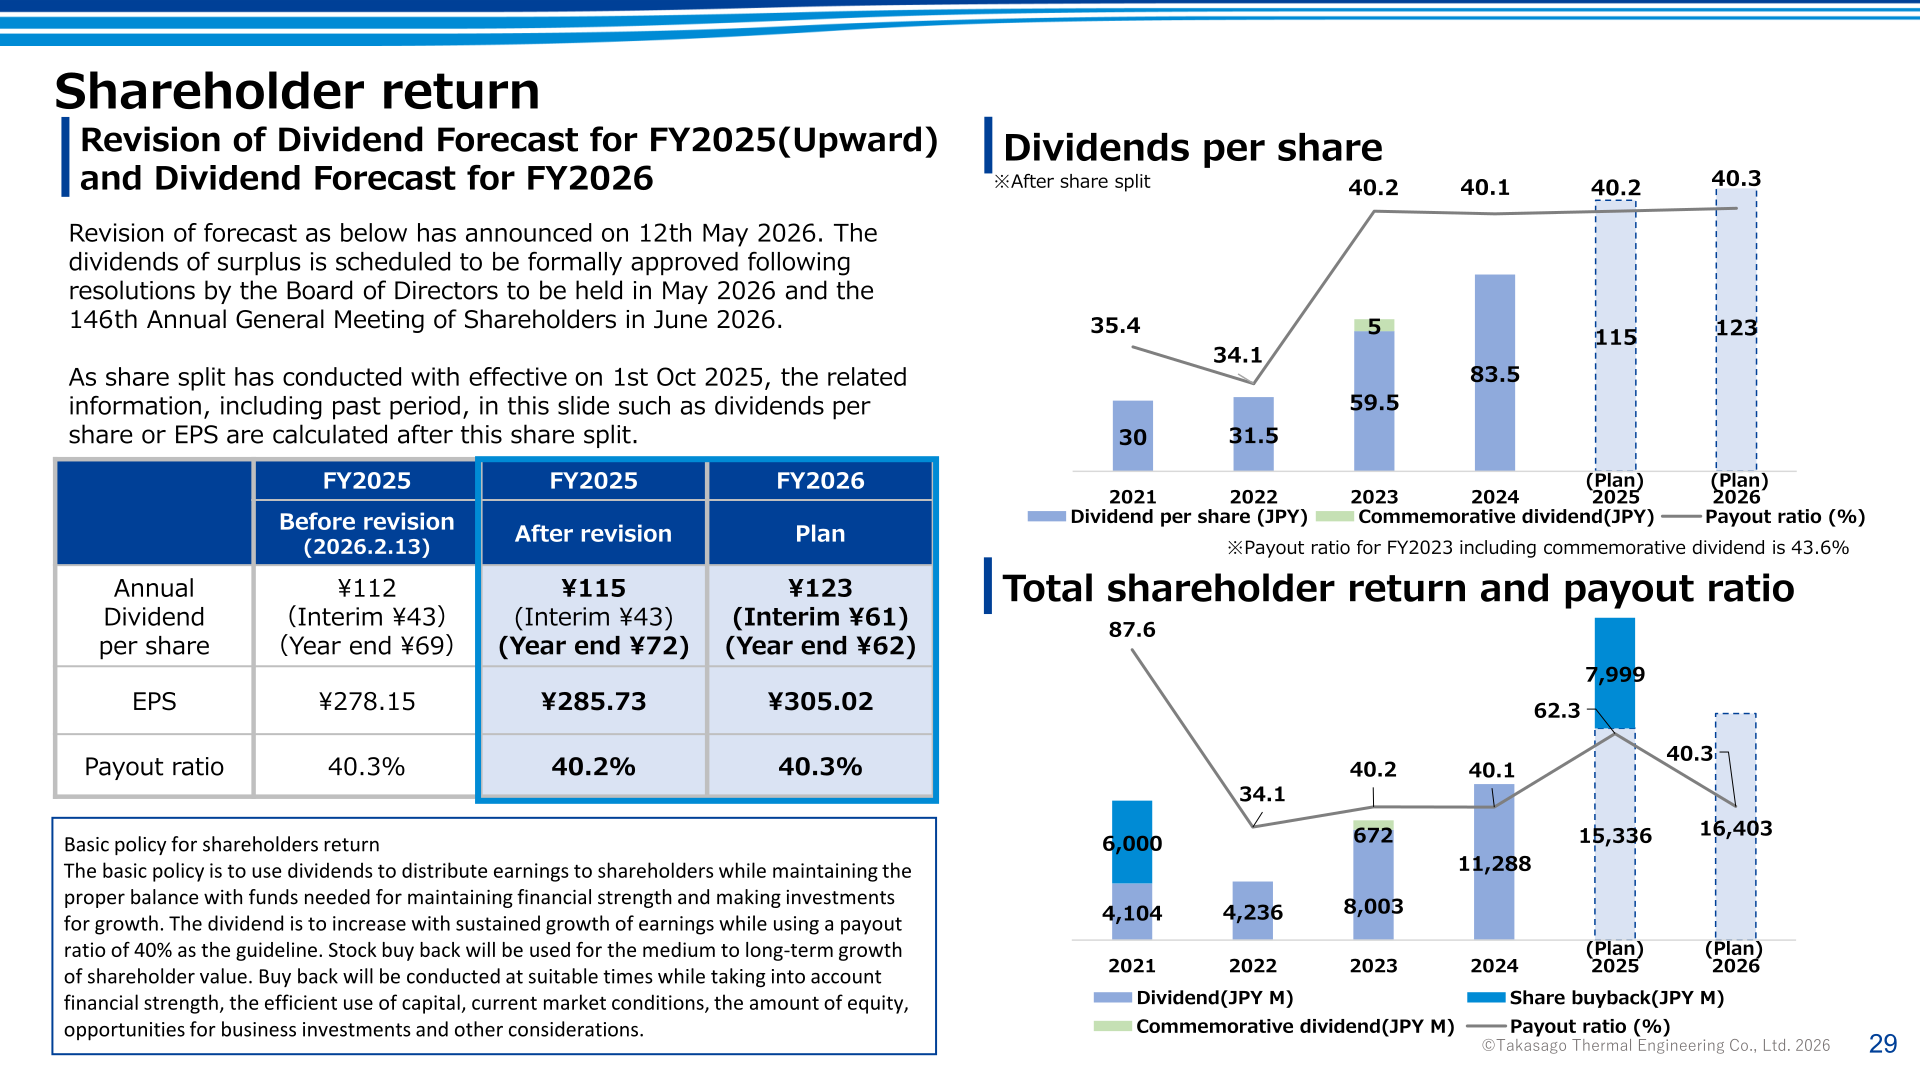
The company’s basic policy is to use dividends to distribute earnings to shareholders while maintaining a proper balance with funds needed for financial strength and growth investment, increasing the dividend in line with sustained earnings growth using a payout ratio of 40% as the guideline, with share buybacks conducted at suitable times for medium- to long-term growth in shareholder value. On 12 May 2026 the company revised its FY2025 dividend forecast upward to an annual 115 yen per share (interim 43 yen, year-end 72 yen) from the 112 yen announced on 13 February 2026, giving a payout ratio of 40.2% on EPS of 285.73 yen. For FY2026 it plans an annual dividend of 123 yen per share (interim 61 yen, year-end 62 yen) on EPS of 305.02 yen, a payout ratio of 40.3%. Per-share figures, including prior periods, are calculated after the 1:2 share split effective 1 October 2025. The year-end dividend is scheduled to be formally approved by the Board of Directors in May 2026 and at the 146th Annual General Meeting of Shareholders in June 2026. Total dividends for FY2025 amount to 15,336 million yen alongside share buybacks of 7,999 million yen, and the FY2026 dividend plan is 16,403 million yen.
| Item | FY2025 (Before revision, 13 Feb 2026) | FY2025 (After revision) | FY2026 (Plan) |
|---|---|---|---|
| Annual dividend per share | 112 yen (Interim 43 yen / Year-end 69 yen) | 115 yen (Interim 43 yen / Year-end 72 yen) | 123 yen (Interim 61 yen / Year-end 62 yen) |
| EPS | 278.15 yen | 285.73 yen | 305.02 yen |
| Payout ratio | 40.3% | 40.2% | 40.3% |
Medium-Term Management Plan 2026 and Topics
Measured against the KGIs of the 2026 Mid-term Business Plan (2023-2026), FY2025 results are already ahead of the FY2026 targets: consolidated ordinary profit of 50.6 billion yen against a target of 40 billion yen, consolidated ROE of 19.2% against a target of approximately 15%, and a consolidated gross profit margin of 22.1% against a target of 19.0% or more. In the capital allocation plan, the outlook for cash created by business has been raised to 163 billion yen from the 137 billion yen disclosed in May 2025, and proceeds from the sale of strategically held shares to 20 billion yen from 10 billion yen. Growth investment remains at 90 billion yen or more, while planned shareholder returns have been raised to 58 billion yen or more. The company states that ROE of 19.2% exceeds its cost of capital, assumed at around 8%, and that PBR stood at 2.8 times at the end of March 2026.
The T-Base construction-process transformation project contributed a 10.6 billion yen increase in completed project value in FY2025. Against plan, the number of projects reached 130 versus a plan of 120 (108% achievement) and labour-hour savings reached 109,900 hours versus a plan of 100,000 hours (110%), while unit production reached 6,181 sets versus a plan of 8,000 sets (77.3%), which the company attributes to expanded production of industrial-use products. FY2026 targets are 150 projects, 140,000 hours saved and 10,000 units. Non-consolidated employee numbers rose to 2,469 at the end of FY2025 from 2,365 a year earlier, and consolidated employees numbered 7,287. In April 2026 Japan Credit Rating Agency raised the long-term issuer rating to A+ from A and changed the outlook to Stable from Positive, with the domestic CP rating unchanged at J-1.
This article is an analysis based on publicly available information and is not a recommendation to buy or sell any specific securities. Investment decisions are your own responsibility.
![[Obayashi] Investors’ Guide 2026 — The Complete 24-Article Breakdown](https://japan-equity.com/wp-content/uploads/2026/07/hub_cover-1024x1024.png)
![[Obayashi] IR & SR Policy — Feeding Dialogue Back into Management](https://japan-equity.com/wp-content/uploads/2026/07/p32_sq-1024x1024.jpg)
![[Obayashi] Real Estate Development — 18.7% Margin, ¥287.7bn Unrealized Gains](https://japan-equity.com/wp-content/uploads/2026/07/p20_sq-1024x1024.jpg)
![[Obayashi] Domestic Civil Engineering — Resilience Spending Supports 9.6% Margin](https://japan-equity.com/wp-content/uploads/2026/07/p11_sq-1024x1024.jpg)
![[Obayashi] Share Price & External Ratings — vs TOPIX, ESG Index Inclusion](https://japan-equity.com/wp-content/uploads/2026/07/p40_sq-1024x1024.jpg)
![[Construction] ¥75.5tn Investment, Shrinking Workforce — Big-5 Market Share](https://japan-equity.com/wp-content/uploads/2026/07/p12_sq-1024x1024.jpg)



![[Obayashi] Capital Policy & Shareholder Returns — ROE 10%+, DOE ~5%, ¥100bn Buyback](https://japan-equity.com/wp-content/uploads/2026/07/p27_sq-1024x1024.jpg)
![[Obayashi] Reducing Cross-Shareholdings — ¥285.2bn Sold in Five Years](https://japan-equity.com/wp-content/uploads/2026/07/p29_sq-1024x1024.jpg)
![[Obayashi] ¥750bn Investment Plan — ¥300bn to Development, ¥190bn to Tech/DX](https://japan-equity.com/wp-content/uploads/2026/07/p30_sq-1024x1024.jpg)
![[Obayashi] MTP2022 KPIs — Operating Profit ~2x Target, ROE 14.4%](https://japan-equity.com/wp-content/uploads/2026/07/p25_sq-1024x1024.jpg)
![[Obayashi] Cash Allocation — ¥420bn Investment CF Over Five Years](https://japan-equity.com/wp-content/uploads/2026/07/p26_sq-1024x1024.jpg)
![[Obayashi] Green Energy — 44 Plants, 344MW, and the Green Hydrogen Challenge](https://japan-equity.com/wp-content/uploads/2026/07/p21_sq-1024x1024.jpg)
![[Obayashi] Tackling the Labor Shortage — Robotics Construction®](https://japan-equity.com/wp-content/uploads/2026/07/p14_sq-1024x1024.jpg)
