
This article is based on publicly available IR materials and is not a recommendation to buy or sell any specific securities.
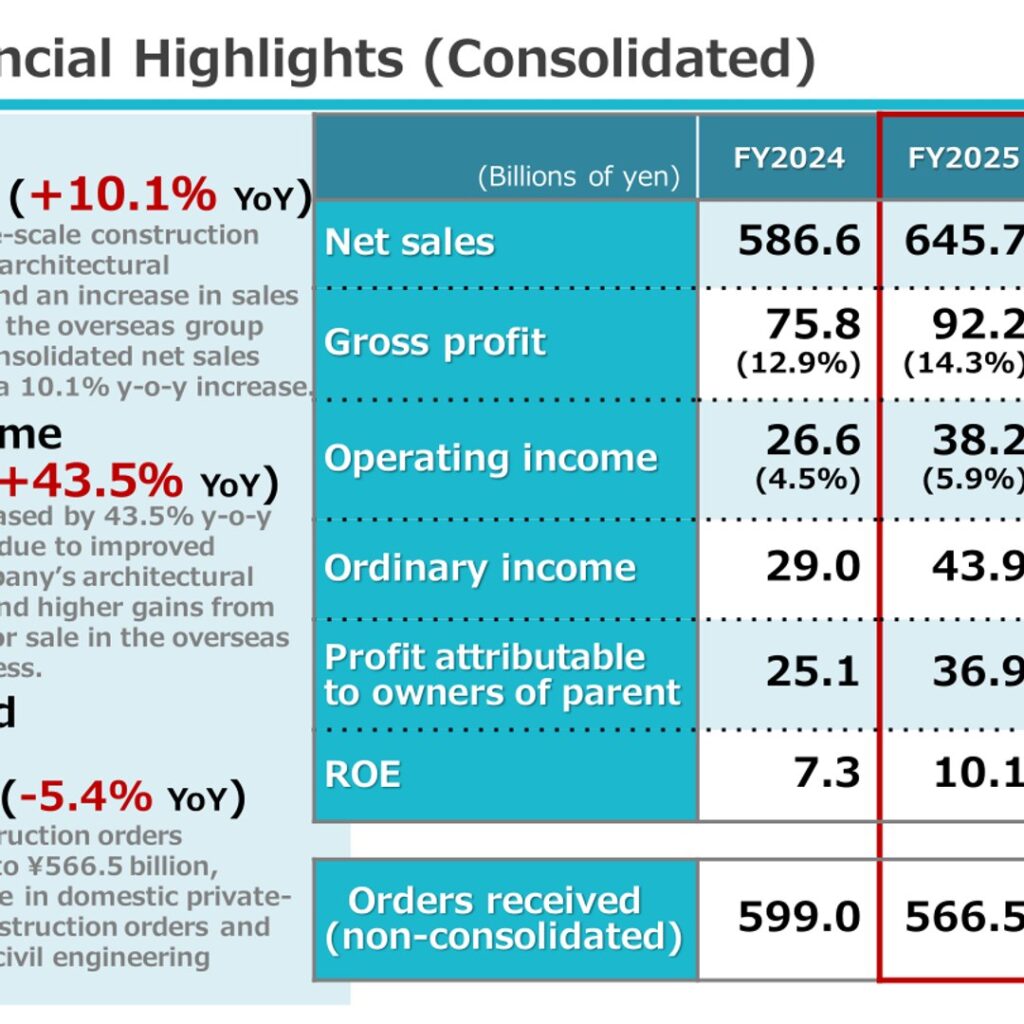
TODA CORPORATION reported consolidated net sales of ¥645.7 billion for FY2025, the year ended March 31, 2026, a 10.1% year-on-year increase, and operating income of ¥38.2 billion, up 43.5%. Ordinary income rose 51.2% to ¥43.9 billion and profit attributable to owners of parent rose 46.8% to ¥36.9 billion, taking ROE to 10.1. Non-consolidated construction orders received fell 5.4% year on year to ¥566.5 billion. For FY2026 the company forecasts net sales of ¥753.0 billion and operating income of ¥39.0 billion.
Consolidated Results (Full-Year Actual)
The company attributes the increase in consolidated net sales to progress in large-scale construction projects on hand in the architectural construction business and an increase in sales of real estate for sale in the overseas group companies business. Operating income increased mainly due to improved profitability in the Company’s architectural construction business and higher gains from the sale of real estate for sale in the overseas group companies business. The decline in non-consolidated construction orders received was mainly due to a decrease in domestic private-sector architectural construction orders and domestic public-sector civil engineering orders. Gross profit rose 21.6% to ¥92.2 billion and the gross profit margin improved to 14.3% from 12.9%.
| Item (Billions of yen) | FY2024 | FY2025 | Change (YoY) | FY2026 (Forecast) |
|---|---|---|---|---|
| Net sales | 586.6 | 645.7 | 10.1% | 753.0 |
| Gross profit (margin) | 75.8 (12.9%) | 92.2 (14.3%) | 21.6% | 93.0 |
| Operating income (margin) | 26.6 (4.5%) | 38.2 (5.9%) | 43.5% | 39.0 |
| Ordinary income | 29.0 | 43.9 | 51.2% | 40.0 |
| Profit attributable to owners of parent | 25.1 | 36.9 | 46.8% | 35.0 |
| ROE | 7.3 | 10.1 | – | 9.5 |
| Orders received (non-consolidated) | 599.0 | 566.5 | -5.4% | 680.0 |
Segment Results
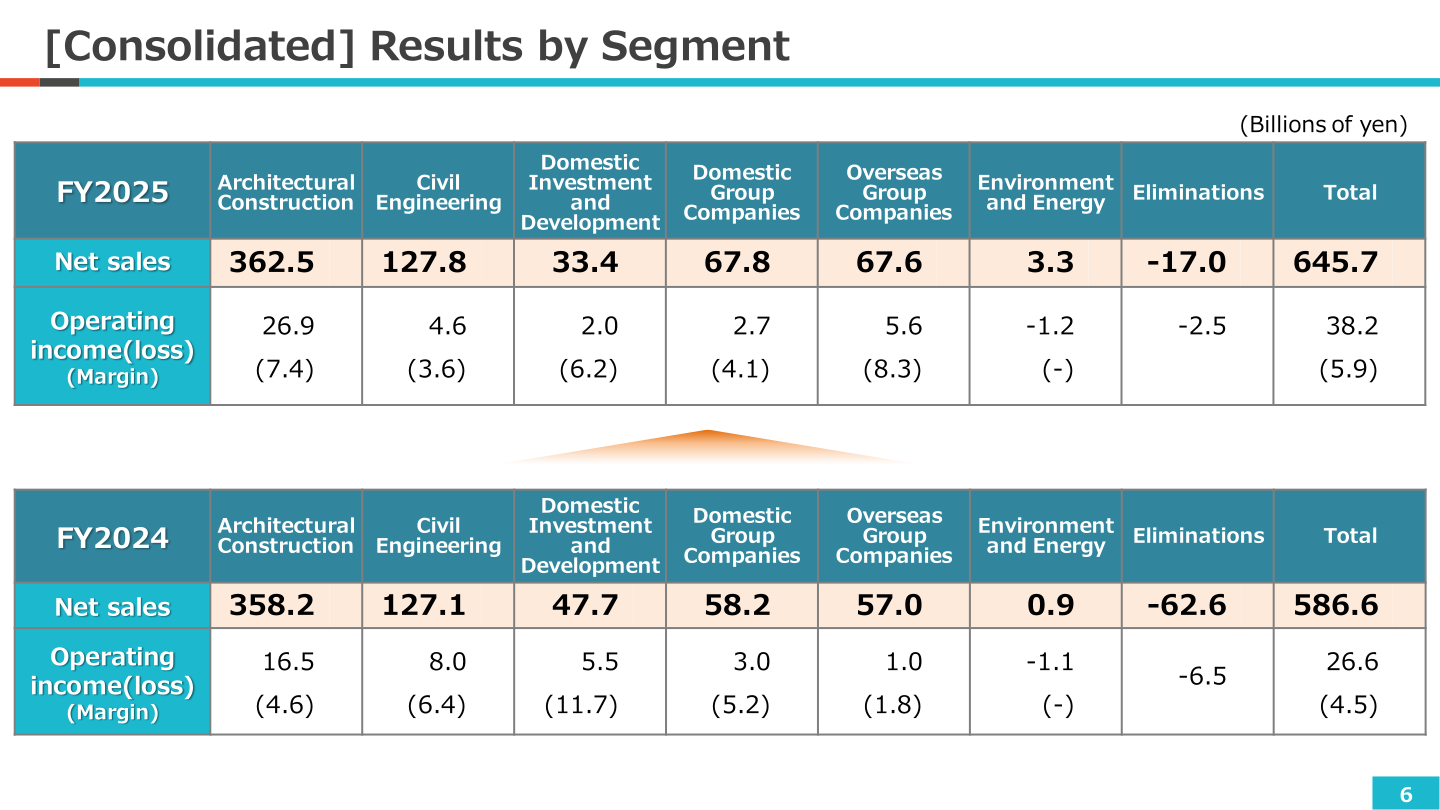
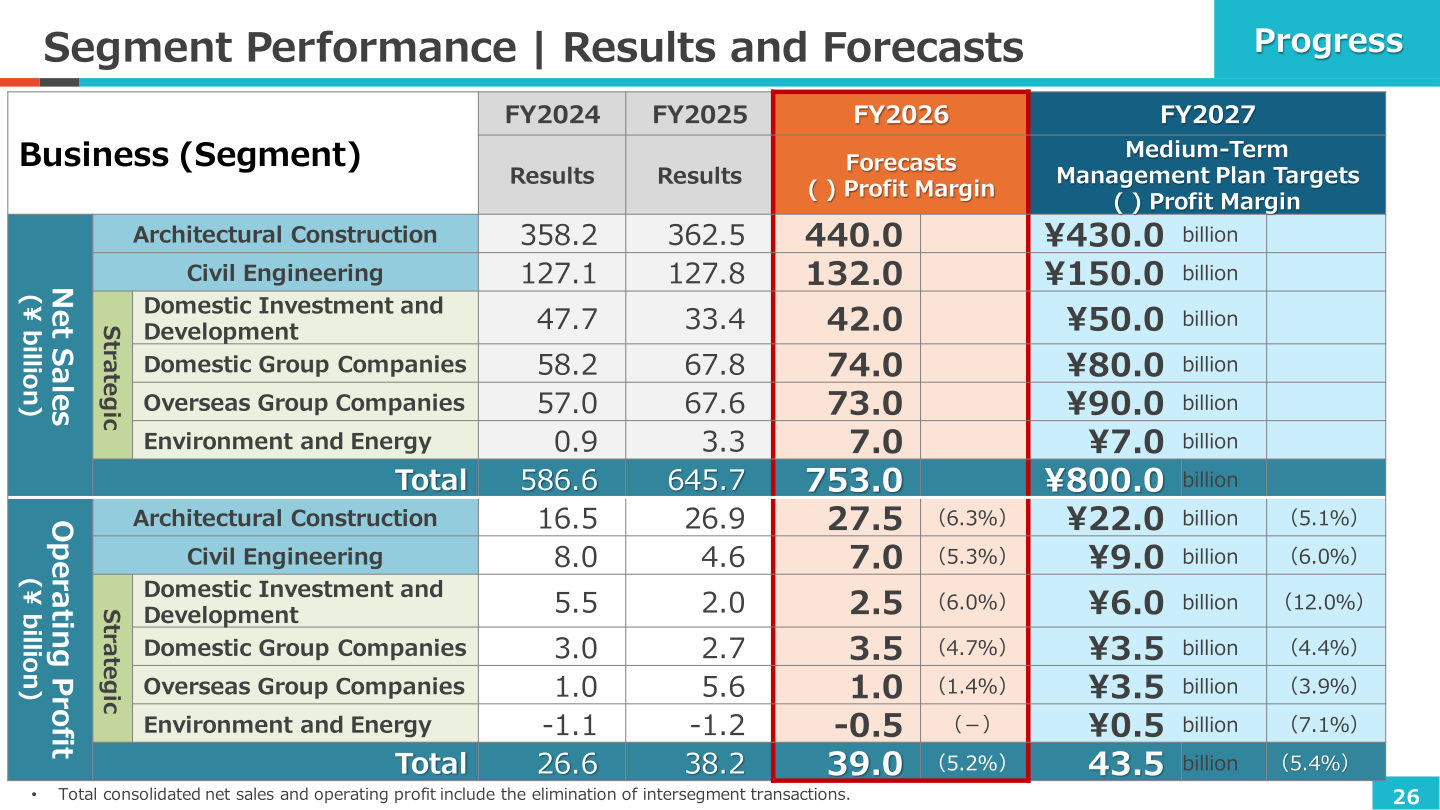
Architectural Construction was the main driver of the profit increase, with operating income of ¥26.9 billion on a 7.4 margin against ¥16.5 billion and a 4.6 margin a year earlier. Overseas Group Companies operating income rose to ¥5.6 billion from ¥1.0 billion, while Civil Engineering operating income fell to ¥4.6 billion from ¥8.0 billion and Domestic Investment and Development fell to ¥2.0 billion from ¥5.5 billion. Environment and Energy remained in operating loss at ¥-1.2 billion.
| Segment (Billions of yen) | Net sales FY2024 | Net sales FY2025 | Operating income (loss) FY2024 (Margin) | Operating income (loss) FY2025 (Margin) |
|---|---|---|---|---|
| Architectural Construction | 358.2 | 362.5 | 16.5 (4.6) | 26.9 (7.4) |
| Civil Engineering | 127.1 | 127.8 | 8.0 (6.4) | 4.6 (3.6) |
| Domestic Investment and Development | 47.7 | 33.4 | 5.5 (11.7) | 2.0 (6.2) |
| Domestic Group Companies | 58.2 | 67.8 | 3.0 (5.2) | 2.7 (4.1) |
| Overseas Group Companies | 57.0 | 67.6 | 1.0 (1.8) | 5.6 (8.3) |
| Environment and Energy | 0.9 | 3.3 | -1.1 (-) | -1.2 (-) |
| Eliminations | -62.6 | -17.0 | -6.5 | -2.5 |
| Total | 586.6 | 645.7 | 26.6 (4.5) | 38.2 (5.9) |
Orders Received and Construction Backlog
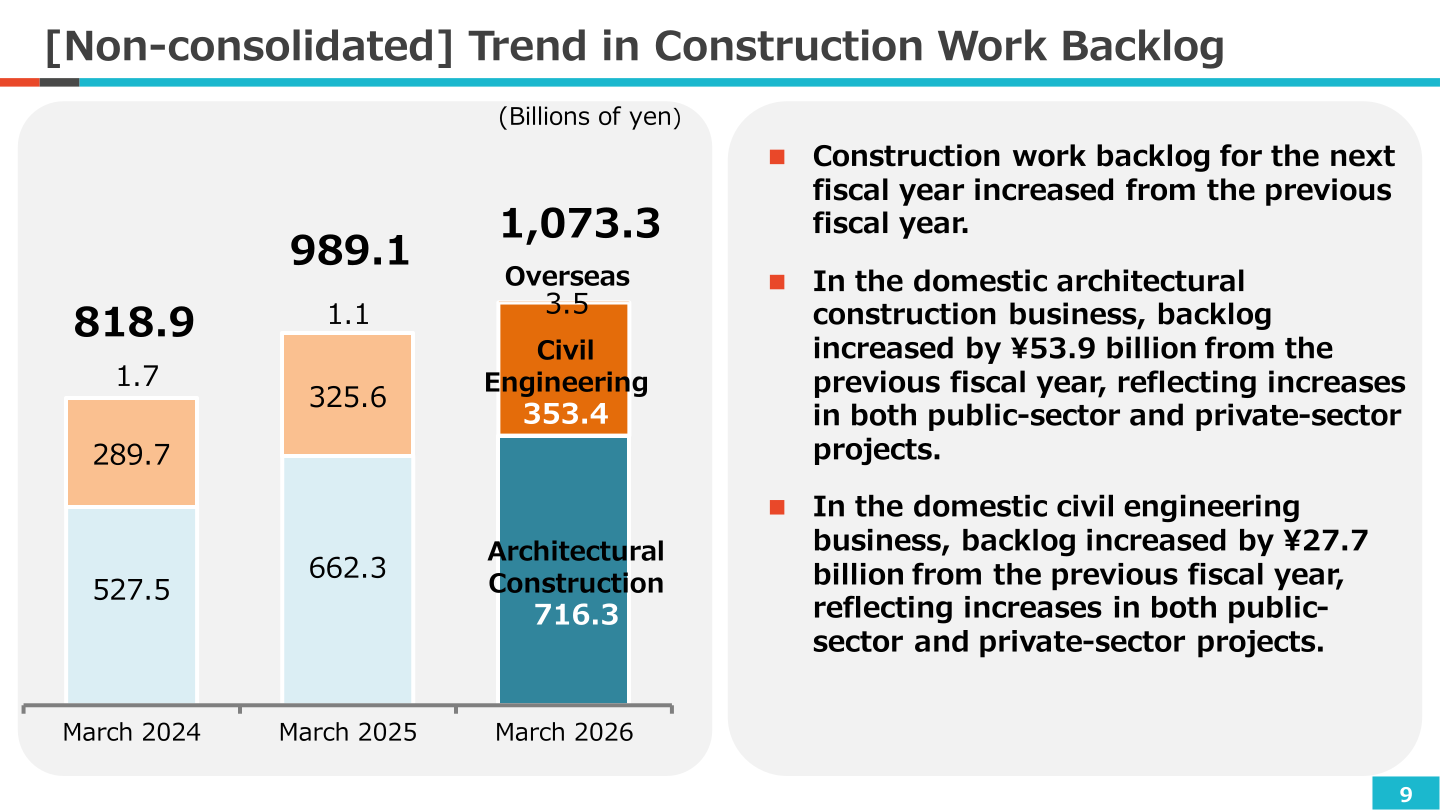
On a non-consolidated basis, construction orders received in FY2025 totalled ¥566.5 billion, comprising Architectural Construction ¥412.8 billion, Civil Engineering ¥149.2 billion and Overseas ¥4.5 billion. Net sales of completed construction contracts were ¥482.3 billion, comprising Architectural Construction ¥358.8 billion, Civil Engineering ¥121.4 billion and Overseas ¥2.0 billion, with a gross profit margin on completed construction contracts of 13.4 in total, 13.7 for Architectural Construction and 12.9 for Civil Engineering. The non-consolidated construction work backlog rose to ¥1,073.3 billion at March 2026 from ¥989.1 billion at March 2025, made up of Architectural Construction ¥716.3 billion, Civil Engineering ¥353.4 billion and Overseas ¥3.5 billion. Domestic architectural construction backlog increased by ¥53.9 billion and domestic civil engineering backlog by ¥27.7 billion, in both cases reflecting increases in public-sector and private-sector projects.
Financial Position and Cash Flows
Total assets increased by ¥74.8 billion to ¥998.3 billion at March 2026 from ¥923.5 billion, with net assets up ¥49.9 billion to ¥403.1 billion. The equity ratio improved to 39.1% from 37.1%, while the current ratio moved to 136.3% from 138.8%. Interest-bearing debt decreased by ¥25.9 billion to ¥229.5 billion, reflecting decreases of ¥12.7 billion in short-term loans payable, ¥5.0 billion in commercial paper and ¥10.1 billion in bonds, despite a ¥2.0 billion increase in long-term loans payable; the D/E ratio was 0.59x. Operating cash flow was ¥62.4 billion, investing cash flow ¥-20.5 billion and financing cash flow ¥-43.8 billion, leaving cash and cash equivalents at ¥84.6 billion versus ¥86.1 billion a year earlier, a change of ¥-1.5 billion. The provision for loss on construction contracts fell ¥1.14 billion year on year to ¥2.98 billion, from ¥4.12 billion at March 2025 and ¥4.06 billion at March 2024, as a result of progress on construction projects and improved profitability in both the domestic architectural construction and domestic civil engineering businesses.
FY2026 Forecast
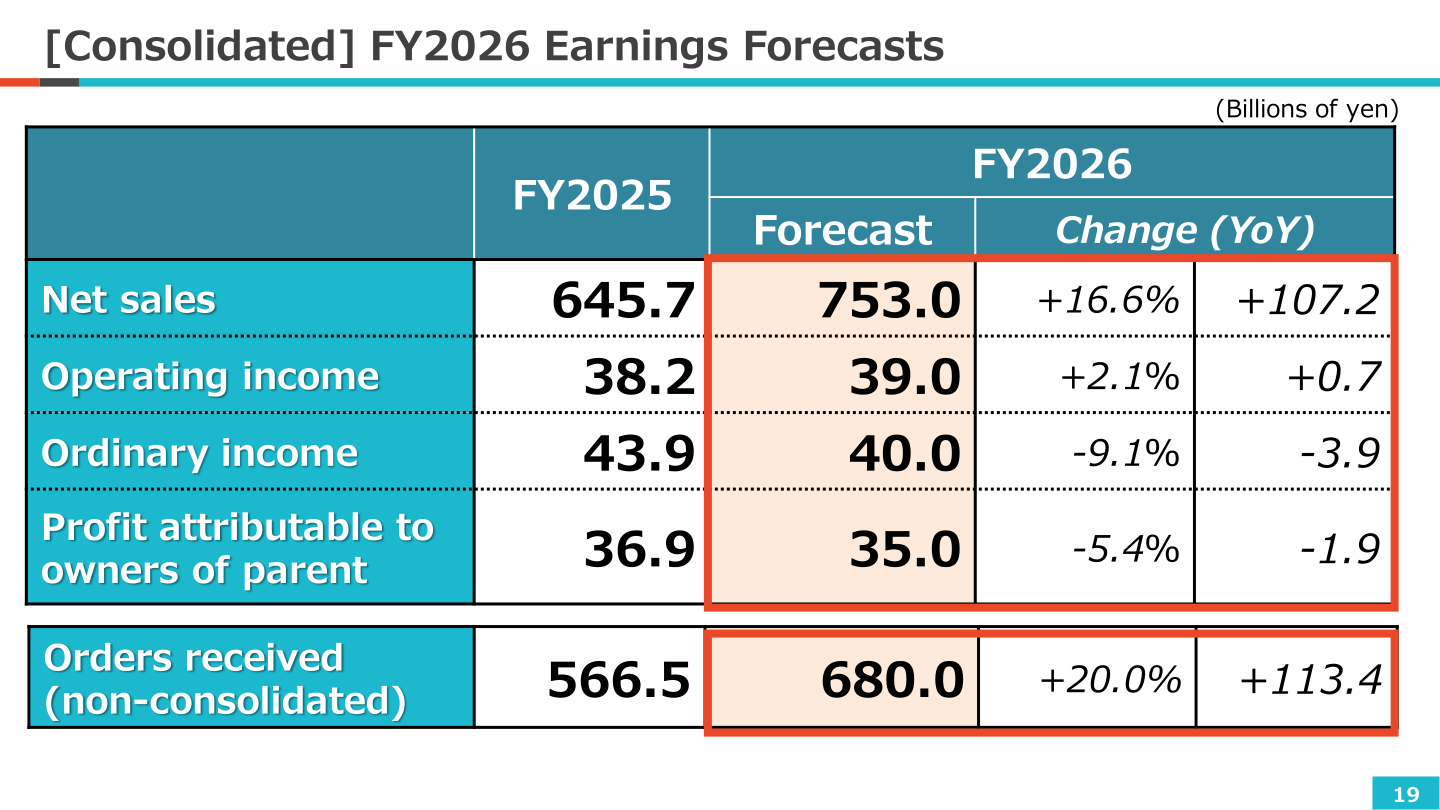
For FY2026 the company forecasts net sales of ¥753.0 billion, up 16.6%, but lower ordinary income and net profit, with non-consolidated orders received forecast to rise 20.0% to ¥680.0 billion. By segment, Architectural Construction net sales are forecast at ¥440.0 billion with operating profit of ¥27.5 billion, and Civil Engineering at ¥132.0 billion with operating profit of ¥7.0 billion.
| Item (Billions of yen) | FY2025 | FY2026 Forecast | Change (YoY) |
|---|---|---|---|
| Net sales | 645.7 | 753.0 | +16.6% (+107.2) |
| Operating income | 38.2 | 39.0 | +2.1% (+0.7) |
| Ordinary income | 43.9 | 40.0 | -9.1% (-3.9) |
| Profit attributable to owners of parent | 36.9 | 35.0 | -5.4% (-1.9) |
| Orders received (non-consolidated) | 566.5 | 680.0 | +20.0% (+113.4) |
Shareholder Returns
DOE rose to 4.7 in FY2025 from 2.6 in FY2024, and the total payout ratio to 66.2 from 55.9. For FY2026 the company targets DOE of 3.5% or higher and a total payout ratio of approximately 70.0%, the same levels set as Medium-Term Management Plan targets for FY2027. The materials define DOE as total dividends divided by shareholders’ equity, and the total payout ratio as the total amount returned to shareholders (total dividends plus total share buybacks) divided by net profit attributable to owners of parent. In the FY2025 cash flow statement, cash dividends paid were ¥-10.7 billion and purchase of treasury stock ¥-7.0 billion.
Medium-Term Management Plan 2027
Medium-Term Management Plan 2027 covers FY2025 to FY2027 under the theme “Identify and Connect”, positioned as Phase 2 “Value restructuring” on the path to the Future Vision CX150. FY2025 results reached ROE of 10.1 against the plan target of 10.0% or higher, and non-consolidated labor productivity of ¥16.84 million against a target of ¥17.50 million or more.
| Indicator | FY2024 Results | FY2025 Results | FY2026 Forecasts | FY2027 Medium-Term Management Plan Targets |
|---|---|---|---|---|
| Net sales (Billions of yen) | 586.6 | 645.7 | 753.0 | Approx. ¥800.0 billion |
| Operating profit (Billions of yen) | 26.6 | 38.2 | 39.0 | ¥43.5 billion or more |
| Operating profit margin | 4.5 | 5.9 | 5.2 | 5.4% or higher |
| Net profit attributable to owners of parent (Billions of yen) | 25.1 | 36.9 | 35.0 | ¥35.0 billion or more |
| ROE | 7.3 | 10.1 | 9.5 | 10.0% or higher |
| Labor productivity (non-consolidated) | 14.93 | 16.84 | 17.20 | ¥17.50 million or more |
| DOE | 2.6 | 4.7 | 3.5% or higher | 3.5% or higher |
| Total payout ratio | 55.9 | 66.2 | Approx. 70.0% | Approx. 70.0% |
Investment Plan and Cross-Shareholdings
The three-year investment plan for FY2025 to FY2027 totals ¥200.0 billion excluding M&A, funded by adjusted operating profit of ¥150.0 billion, sale of held assets of ¥100.0 billion and sale of cross-shareholdings of ¥50.0 billion or more, together with use of interest-bearing debt within a D/E ratio of 0.8x or below. Cumulative investment reached ¥58.4 billion in FY2025, with a plan of ¥77.3 billion for FY2026. The FY2025 breakdown was business foundation investment ¥12.6 billion, real estate development ¥35.9 billion, environment and energy ¥6.8 billion and machinery and equipment ¥2.9 billion; the FY2026 plan is ¥20.8 billion, ¥47.4 billion, ¥6.3 billion and ¥2.7 billion respectively. On cross-shareholdings, disposal proceeds were ¥13.3 billion in FY2025 with ¥20.0 billion planned for each of FY2026 and FY2027, a three-year total of ¥53.3 billion; the company aims to reduce cross-shareholdings to less than 20% of consolidated net assets by FY2030.
Topics
In the Environment and Energy business, the offshore wind power project off the coast of Goto City commenced operation on January 5, 2026 and received the Global Environment Award, the first among general contractors. The company is currently modifying a SEP vessel, with Hakodate Port designated as the base port and operation scheduled to begin in FY2027, as it pursues construction and installation contracts for bottom-fixed offshore wind projects. In FY2025 the frontline workforce increased by a net 244 to 3,423 as of April 2026 from 3,179 as of April 2025. On non-financial targets, CO2 emissions (Scope 1 + 2) were down 37.6% versus FY2020 and Scope 3 emissions down 39.7%, work engagement scored 52.2 and worksite feedback 4.38 out of 5.0, and the company held 89 IR meetings. External recognition included the highest “A List” rating in the CDP 2025 Climate Change survey, selection under the Ministry of the Environment’s 7th ESG Finance Awards Japan as an “Environmental Sustainable Company”, and an upgrade to “Gold” in the PRIDE Index 2025.
This article is an analysis based on publicly available information and is not a recommendation to buy or sell any specific securities. Investment decisions are your own responsibility.
![[Obayashi] Investors’ Guide 2026 — The Complete 24-Article Breakdown](https://japan-equity.com/wp-content/uploads/2026/07/hub_cover-1024x1024.png)
![[Obayashi] IR & SR Policy — Feeding Dialogue Back into Management](https://japan-equity.com/wp-content/uploads/2026/07/p32_sq-1024x1024.jpg)
![[Obayashi] Real Estate Development — 18.7% Margin, ¥287.7bn Unrealized Gains](https://japan-equity.com/wp-content/uploads/2026/07/p20_sq-1024x1024.jpg)
![[Obayashi] Domestic Civil Engineering — Resilience Spending Supports 9.6% Margin](https://japan-equity.com/wp-content/uploads/2026/07/p11_sq-1024x1024.jpg)
![[Obayashi] Share Price & External Ratings — vs TOPIX, ESG Index Inclusion](https://japan-equity.com/wp-content/uploads/2026/07/p40_sq-1024x1024.jpg)
![[Construction] ¥75.5tn Investment, Shrinking Workforce — Big-5 Market Share](https://japan-equity.com/wp-content/uploads/2026/07/p12_sq-1024x1024.jpg)



![[Obayashi] Capital Policy & Shareholder Returns — ROE 10%+, DOE ~5%, ¥100bn Buyback](https://japan-equity.com/wp-content/uploads/2026/07/p27_sq-1024x1024.jpg)
![[Obayashi] Reducing Cross-Shareholdings — ¥285.2bn Sold in Five Years](https://japan-equity.com/wp-content/uploads/2026/07/p29_sq-1024x1024.jpg)
![[Obayashi] ¥750bn Investment Plan — ¥300bn to Development, ¥190bn to Tech/DX](https://japan-equity.com/wp-content/uploads/2026/07/p30_sq-1024x1024.jpg)
![[Obayashi] MTP2022 KPIs — Operating Profit ~2x Target, ROE 14.4%](https://japan-equity.com/wp-content/uploads/2026/07/p25_sq-1024x1024.jpg)
![[Obayashi] Cash Allocation — ¥420bn Investment CF Over Five Years](https://japan-equity.com/wp-content/uploads/2026/07/p26_sq-1024x1024.jpg)
![[Obayashi] Green Energy — 44 Plants, 344MW, and the Green Hydrogen Challenge](https://japan-equity.com/wp-content/uploads/2026/07/p21_sq-1024x1024.jpg)
![[Obayashi] Tackling the Labor Shortage — Robotics Construction®](https://japan-equity.com/wp-content/uploads/2026/07/p14_sq-1024x1024.jpg)
