
This article is based on publicly available IR materials and is not a recommendation to buy or sell any specific securities.
Note: this article covers COMSYS Holdings’ most recently completed full fiscal year, the year ended March 31, 2026, which the company labels “FY 03/2026”; japan-equity.com classifies it as FY2025, and the company’s own labels are kept in the text, tables and charts below. All yen amounts follow the presentation’s unit of ¥100 million unless otherwise stated.
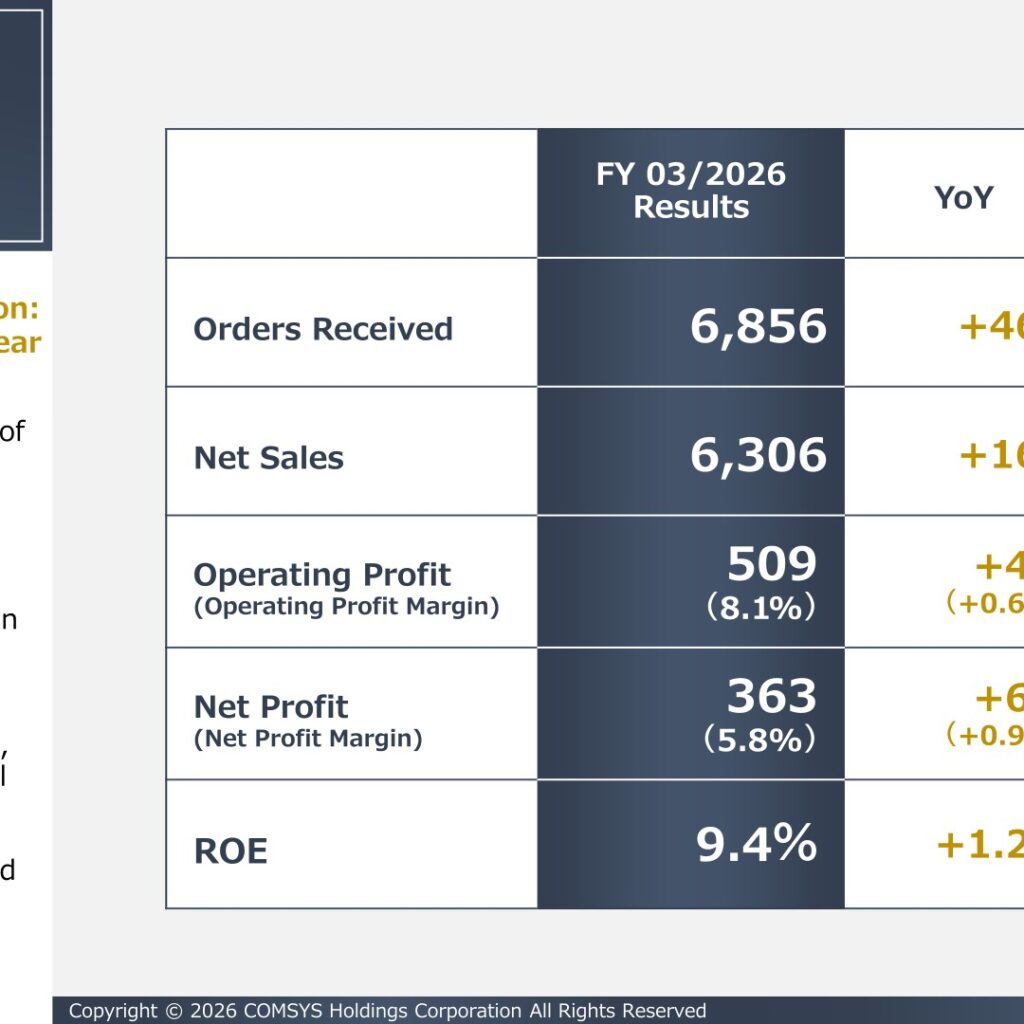
COMSYS Holdings Corporation, the holding company of a group of telecommunications, IT and social infrastructure engineering companies, reported new record highs across the board in FY 03/2026. The company flagged records for orders received, net sales, contract backlog, operating profit, net profit and ROE, and every headline item finished above its own full-year targets. Operating profit rose 10.7% year on year and profit attributable to owners of parent rose 20.7%, lifting ROE by 1.2p to a record 9.4%. FY 03/2026 was also year one of the COMSYS Group 2030 Vision, which the company describes as off to a smooth start.
Consolidated Results (Full-Year Actual)
Orders received rose 7.3% to 6,856 and net sales rose 2.6% to 6,306, both new records. Measured against the full-year targets of 6,500 for orders received and 6,200 for net sales, results came in 5.5% and 1.7% ahead respectively. Gross profit increased 9.1% to 919 and the gross profit margin improved to 14.6% from 13.7%, while SG&A expenses rose 7.2% to 410. Operating profit advanced 10.7% to 509 — 13.1% above the 450 target — with the operating profit margin up 0.6p to 8.1%. Profit attributable to owners of parent climbed 20.7% to 363, 17.1% above the 310 target, taking the net profit margin up 0.9p to 5.8%. The presentation also expresses full-year net sales as ¥630.6 B.
| Item (Unit: ¥100 million) | FY 03/2026 (Results) | FY 03/2025 (Results) | YoY Change |
|---|---|---|---|
| Orders Received | 6,856 | 6,388 | 7.3% |
| Net Sales | 6,306 | 6,146 | 2.6% |
| Gross Profit | 919 | 842 | 9.1% |
| (Gross Profit Margin) | (14.6%) | (13.7%) | — |
| SG&A Expenses | 410 | 382 | 7.2% |
| Operating Profit | 509 | 459 | 10.7% |
| (Operating Profit Margin) | (8.1%) | (7.5%) | +0.6p |
| Ordinary Profit | 521 | 466 | 11.8% |
| (Ordinary Profit Margin) | (8.3%) | (7.6%) | — |
| Profit Attributable to Owners of Parent | 363 | 300 | 20.7% |
| (Net Profit Margin) | (5.8%) | (4.9%) | +0.9p |
| ROE | 9.4% | 8.2% | +1.2p |
| EPS | ¥311.6 | ¥253.5 | — |
On the balance sheet, total assets stood at 5,657 as of March 31, 2026 against 5,397 a year earlier, and the equity ratio improved from 69.3% to 70.7%, with net assets of 4,074. Cash flow from operating activities was +424, investing activities -156 and financing activities -237, leaving cash and cash equivalents of 413 at year-end versus 381 at the start of the year. Capital expenditure totalled 149 (+42.5%) and depreciation and amortization was 111 (-2.6%).
Results by Business
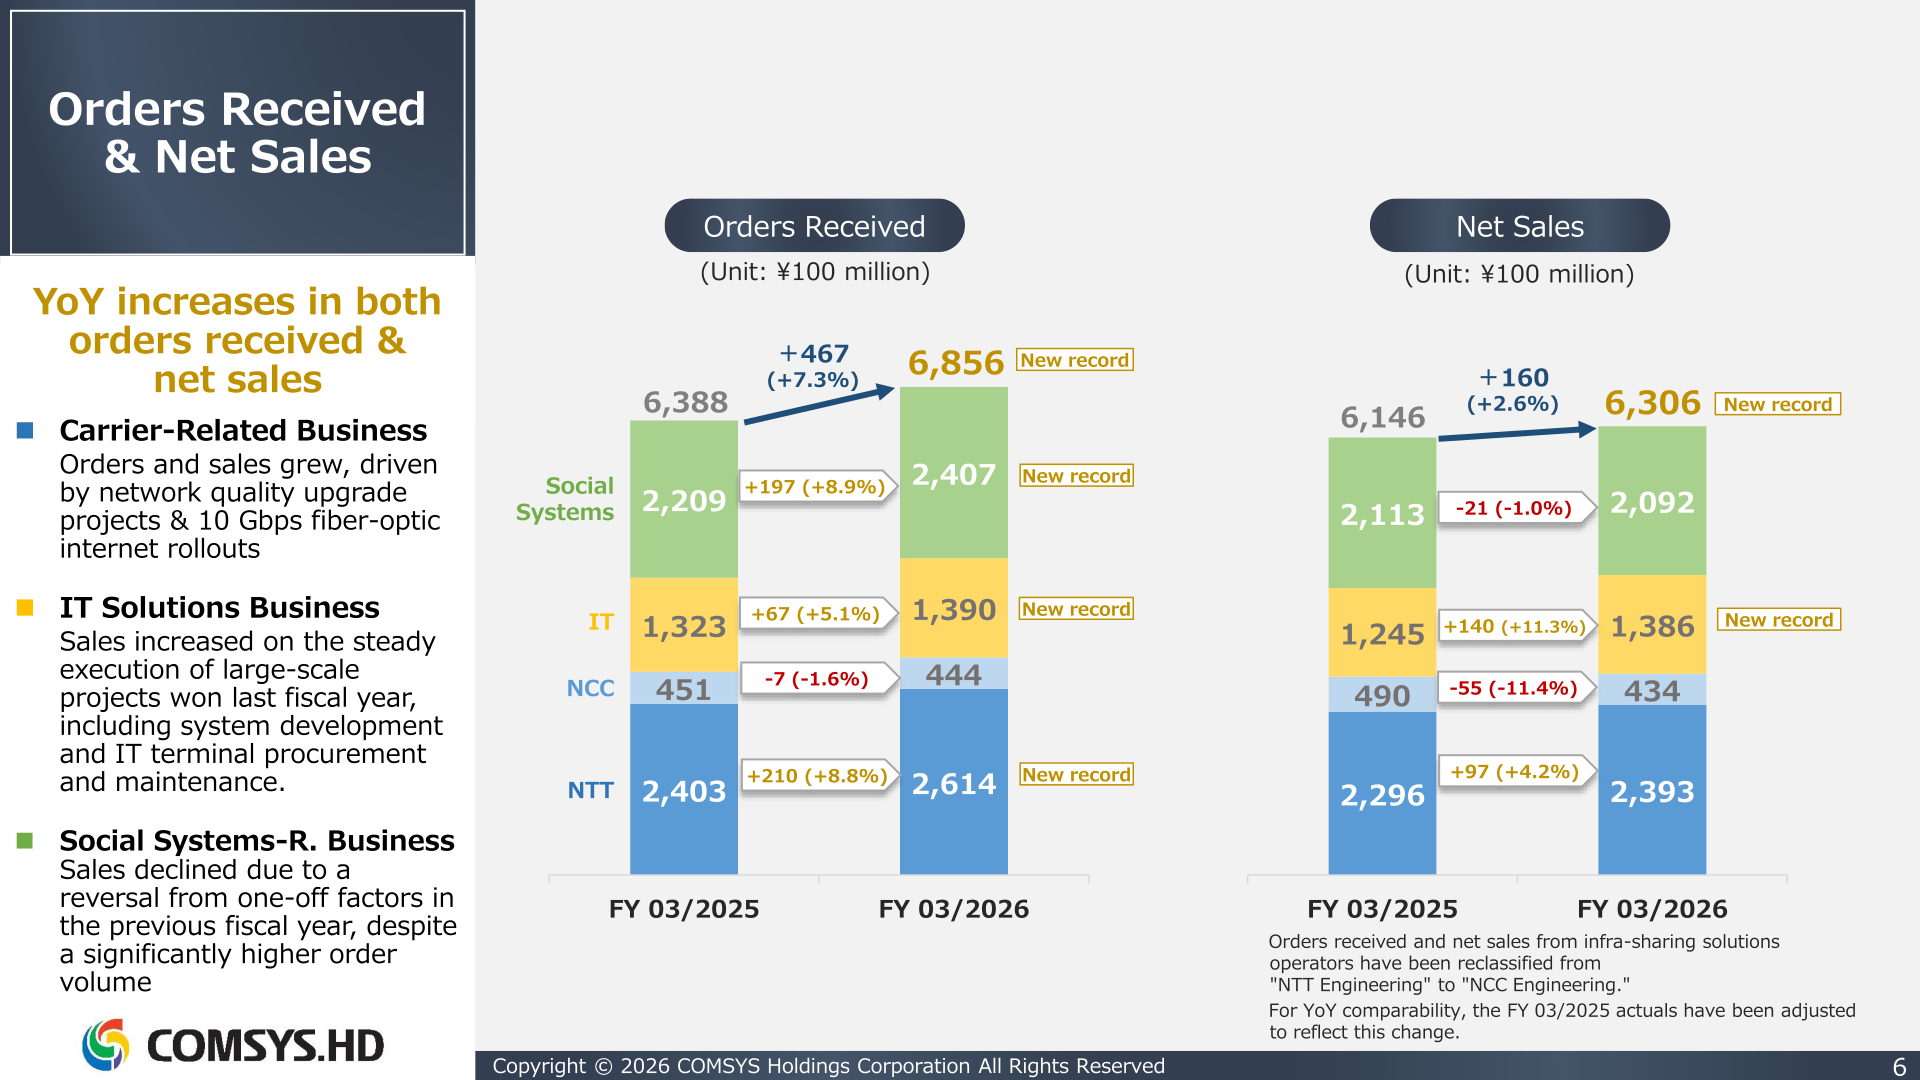
COMSYS reports a Carrier-Related Business (split into NTT Engineering and NCC Engineering), an IT Solutions Business and a Social Systems-Related Business. Effective from FY 03/2026, orders received and net sales from infra-sharing solutions operators were reclassified from NTT Engineering to NCC Engineering, and the FY 03/2025 actuals shown here have been adjusted for comparability. In orders received, NTT Engineering gained 210 (+8.8%) to 2,614 and the Social Systems-Related Business gained 197 (+8.9%) to 2,407, while IT Solutions added 67 (+5.1%) to 1,390 and NCC Engineering slipped 7 (-1.6%) to 444. On the sales line, IT Solutions grew 140 (+11.3%) to 1,386 on steady execution of large-scale projects won in the prior year, and NTT Engineering grew 97 (+4.2%) to 2,393 on network quality upgrade projects and 10 Gbps fiber-optic internet rollouts; NCC Engineering fell 55 (-11.4%) to 434 and Social Systems-Related eased 21 (-1.0%) to 2,092 on a reversal of one-off factors in the previous fiscal year despite a much higher order volume.
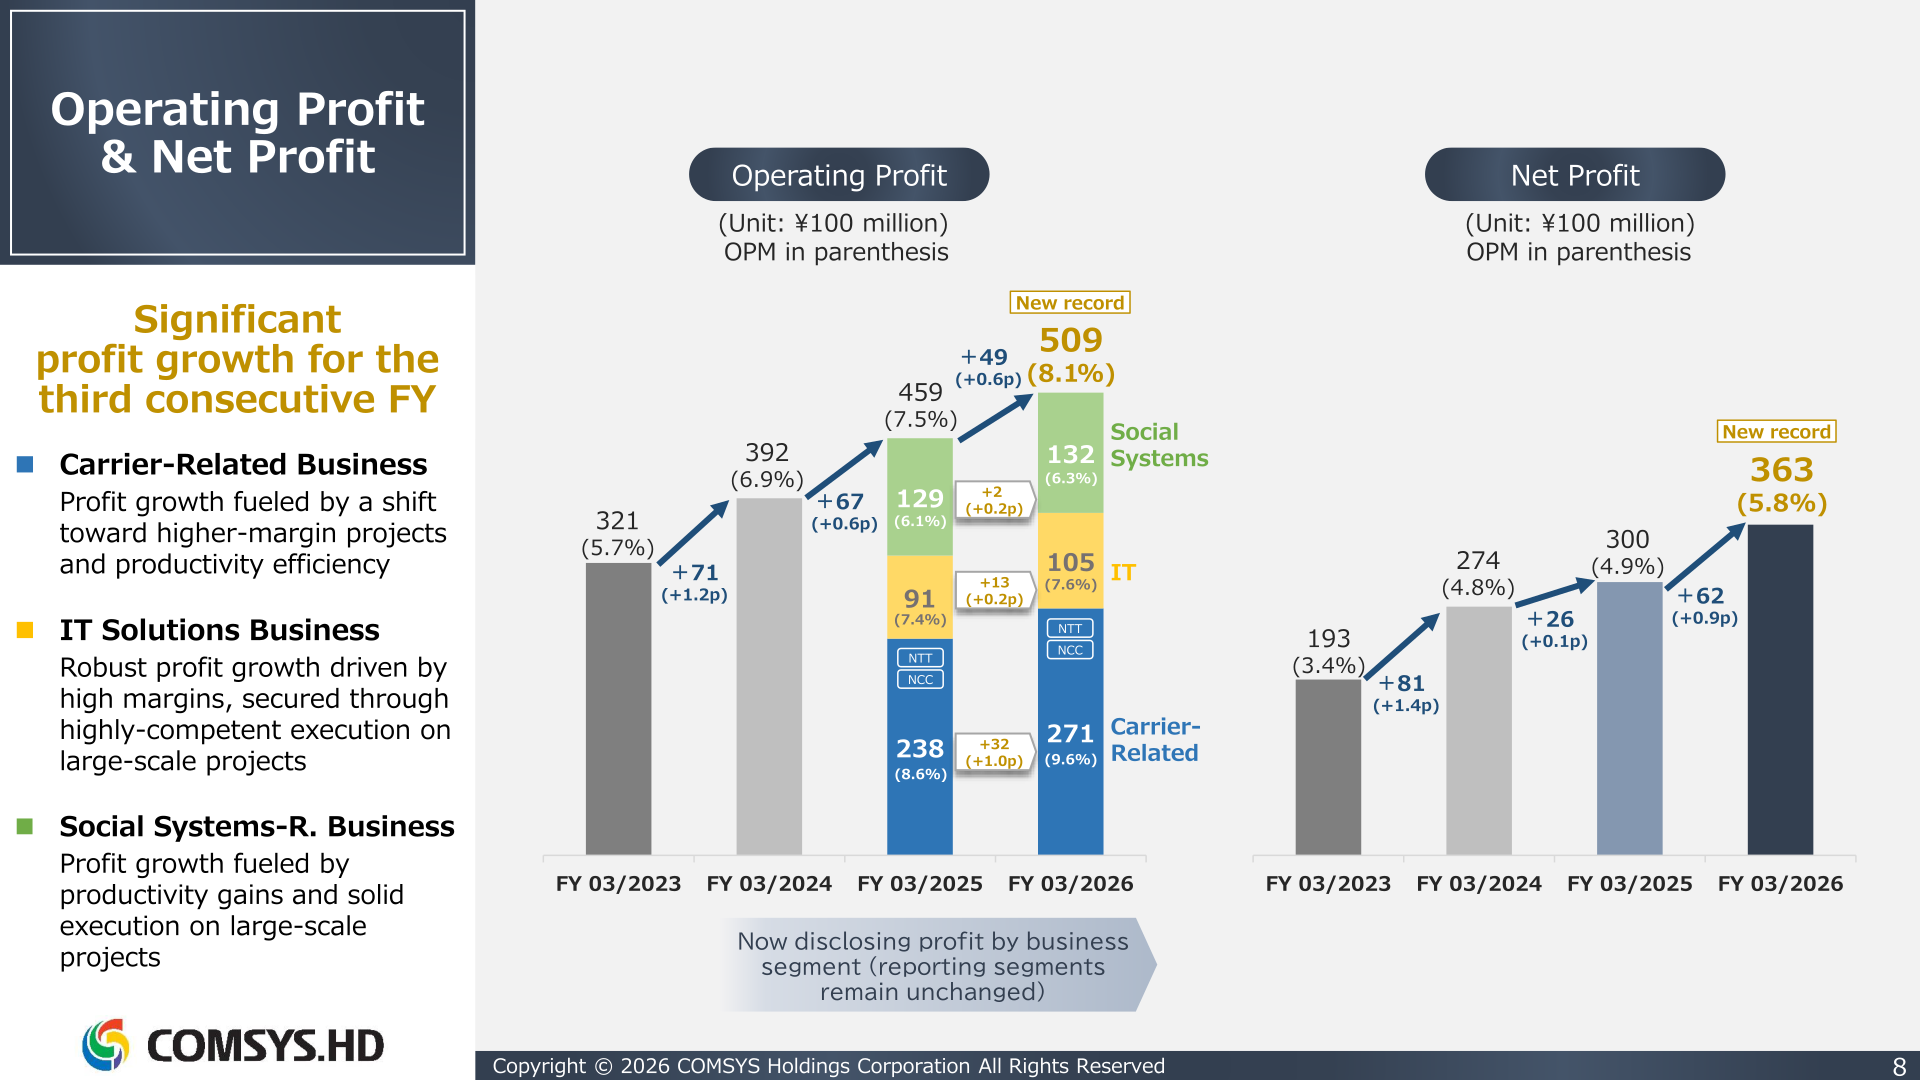
With this presentation the company began disclosing operating profit by business, while leaving its reporting segments unchanged. Carrier-Related operating profit rose 13.5% to 271 for a 9.6% margin, IT Solutions rose 15.1% to 105 for a 7.6% margin, and Social Systems-Related rose 2.2% to 132 for a 6.3% margin. Among the operating companies, Nippon COMSYS-G posted net sales of 3,268 (+3.1%) and operating profit of 260 (+10.1%), NDS-G posted net sales of 953 (+8.8%) and operating profit of 72 (+29.5%), and COMSYS JOHO SYSTEM-G grew net sales 75.0% to 355; TSUKEN-G saw net sales fall 12.8% to 647 and operating profit fall 14.4% to 62.
| Business (Unit: ¥100 million) | Orders Received FY 03/2026 | Net Sales FY 03/2026 | Operating Profit FY 03/2026 | Operating Profit Margin |
|---|---|---|---|---|
| Carrier-Related — NTT Engineering | 2,614 | 2,393 | — | — |
| Carrier-Related — NCC Engineering | 444 | 434 | — | — |
| Carrier-Related Business (sub-total) | 3,058 | 2,828 | 271 | (9.6%) |
| IT Solutions Business | 1,390 | 1,386 | 105 | (7.6%) |
| Social Systems-Related Business | 2,407 | 2,092 | 132 | (6.3%) |
| Total | 6,856 | 6,306 | 509 | (8.1%) |
Contract Backlog
The contract backlog carried into FY 03/2027 reached a record 3,199, up 549 (+20.7%) from the 2,649 carried into FY 03/2026. The Social Systems-Related Business accounted for 1,562 (+315, +25.2%) and NTT Engineering for 983 (+220, +28.9%), with NCC Engineering at 193 (+9, +5.0%) and IT Solutions at 459 (+4, +1.0%). Within NTT Engineering, the Mobile backlog rose 63.5% to 475. The company positions this backlog as the driver of top- and bottom-line growth from FY 03/2027 onward.
FY 03/2027 Forecast
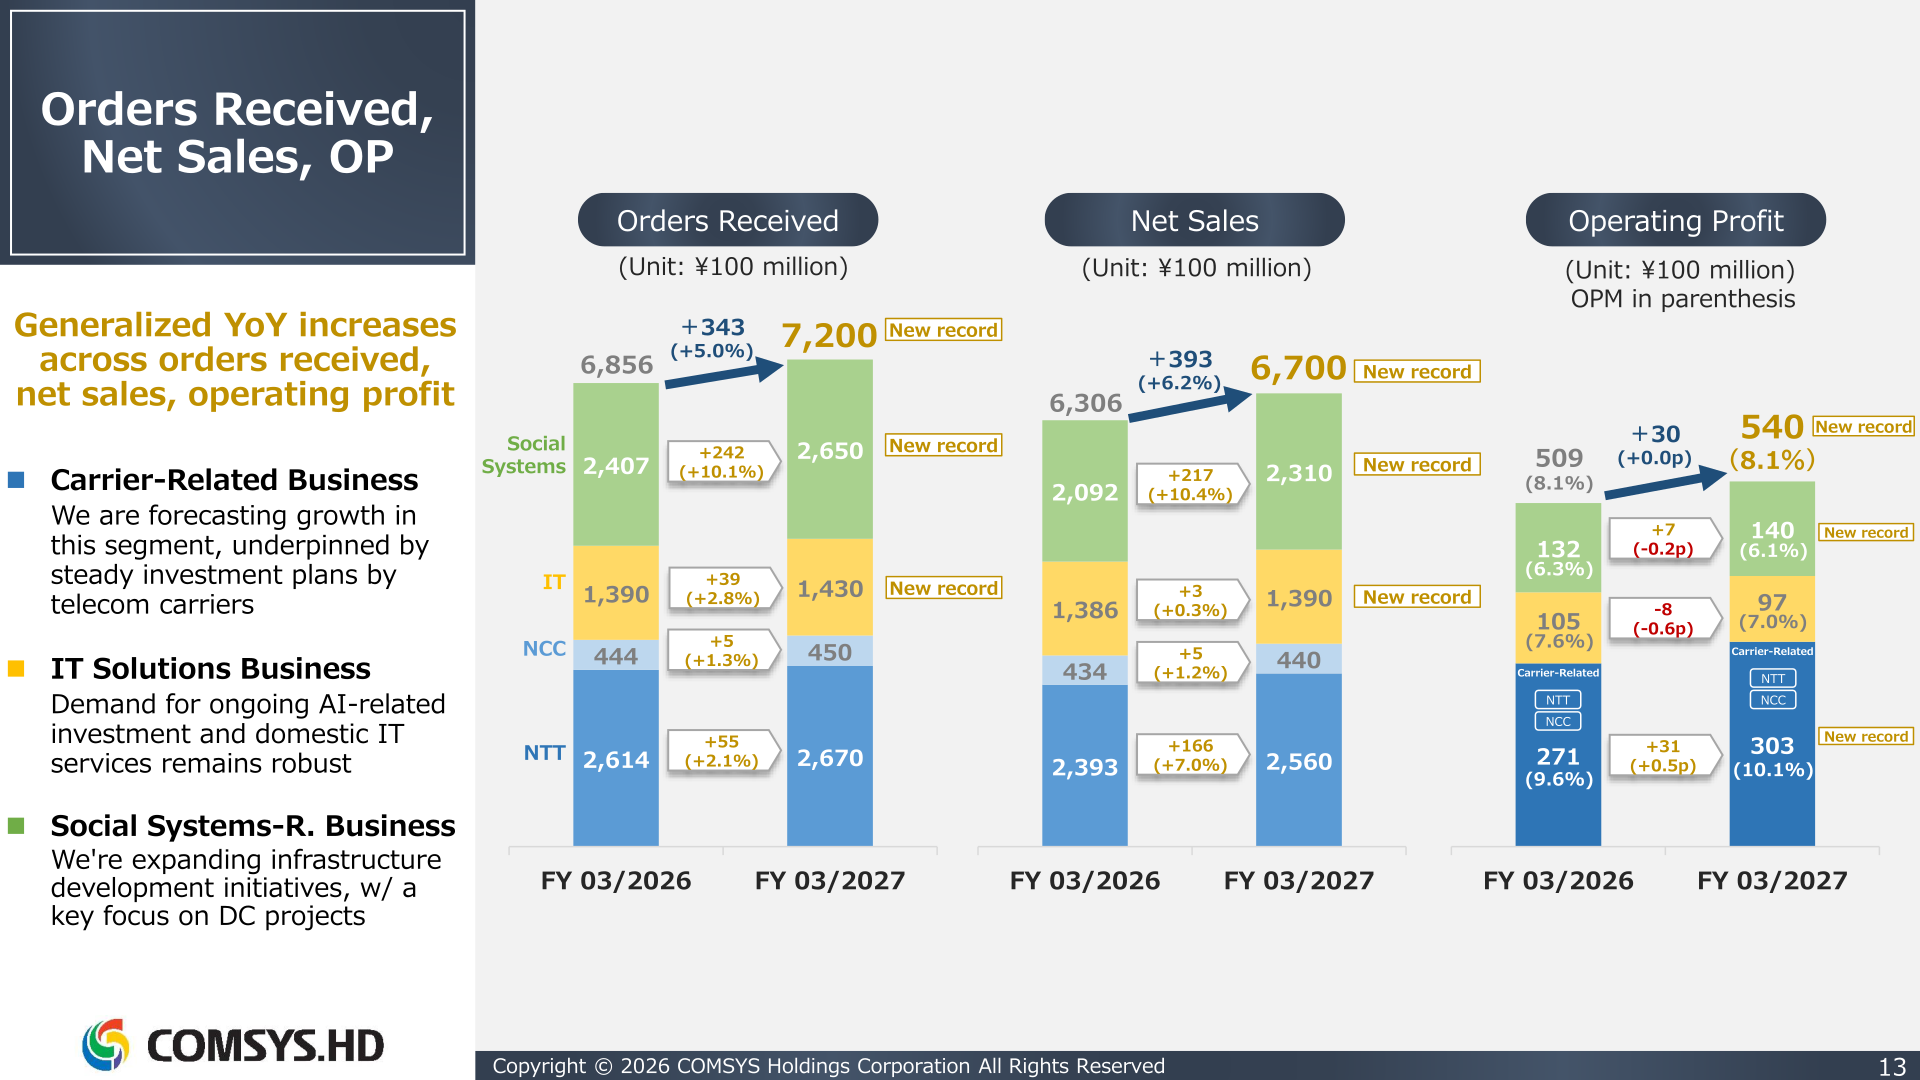
For FY 03/2027 the company targets orders received of 7,200 (+5.0%), net sales of 6,700 (+6.2%), operating profit of 540 (+6.1%) and profit attributable to owners of parent of 378 (+4.3%), holding the operating profit margin at 8.1% and ROE at 9.4%. By business, orders received targets are 2,670 for NTT Engineering, 450 for NCC Engineering, 1,430 for IT Solutions and 2,650 for Social Systems-Related; net sales targets are 2,560, 440, 1,390 and 2,310 respectively. Operating profit is guided at 303 for the Carrier-Related Business (10.1% margin), 97 for IT Solutions (7.0%) and 140 for Social Systems-Related (6.1%). Capital expenditure is planned at 220 (+46.8%).
| Item (Unit: ¥100 million) | FY 03/2027 (Target) | FY 03/2026 (Results) | YoY Change |
|---|---|---|---|
| Orders Received | 7,200 | 6,856 | 5.0% |
| Net Sales | 6,700 | 6,306 | 6.2% |
| Gross Profit | 992 | 919 | 7.9% |
| SG&A Expenses | 452 | 410 | 10.2% |
| Operating Profit | 540 | 509 | 6.1% |
| (Operating Profit Margin) | (8.1%) | (8.1%) | +0.0p |
| Ordinary Profit | 550 | 521 | 5.4% |
| Profit Attributable to Owners of Parent | 378 | 363 | 4.3% |
| (Net Profit Margin) | (5.7%) | (5.8%) | -0.1p |
| ROE | 9.4% | 9.4% | +0.0p |
Shareholder Returns
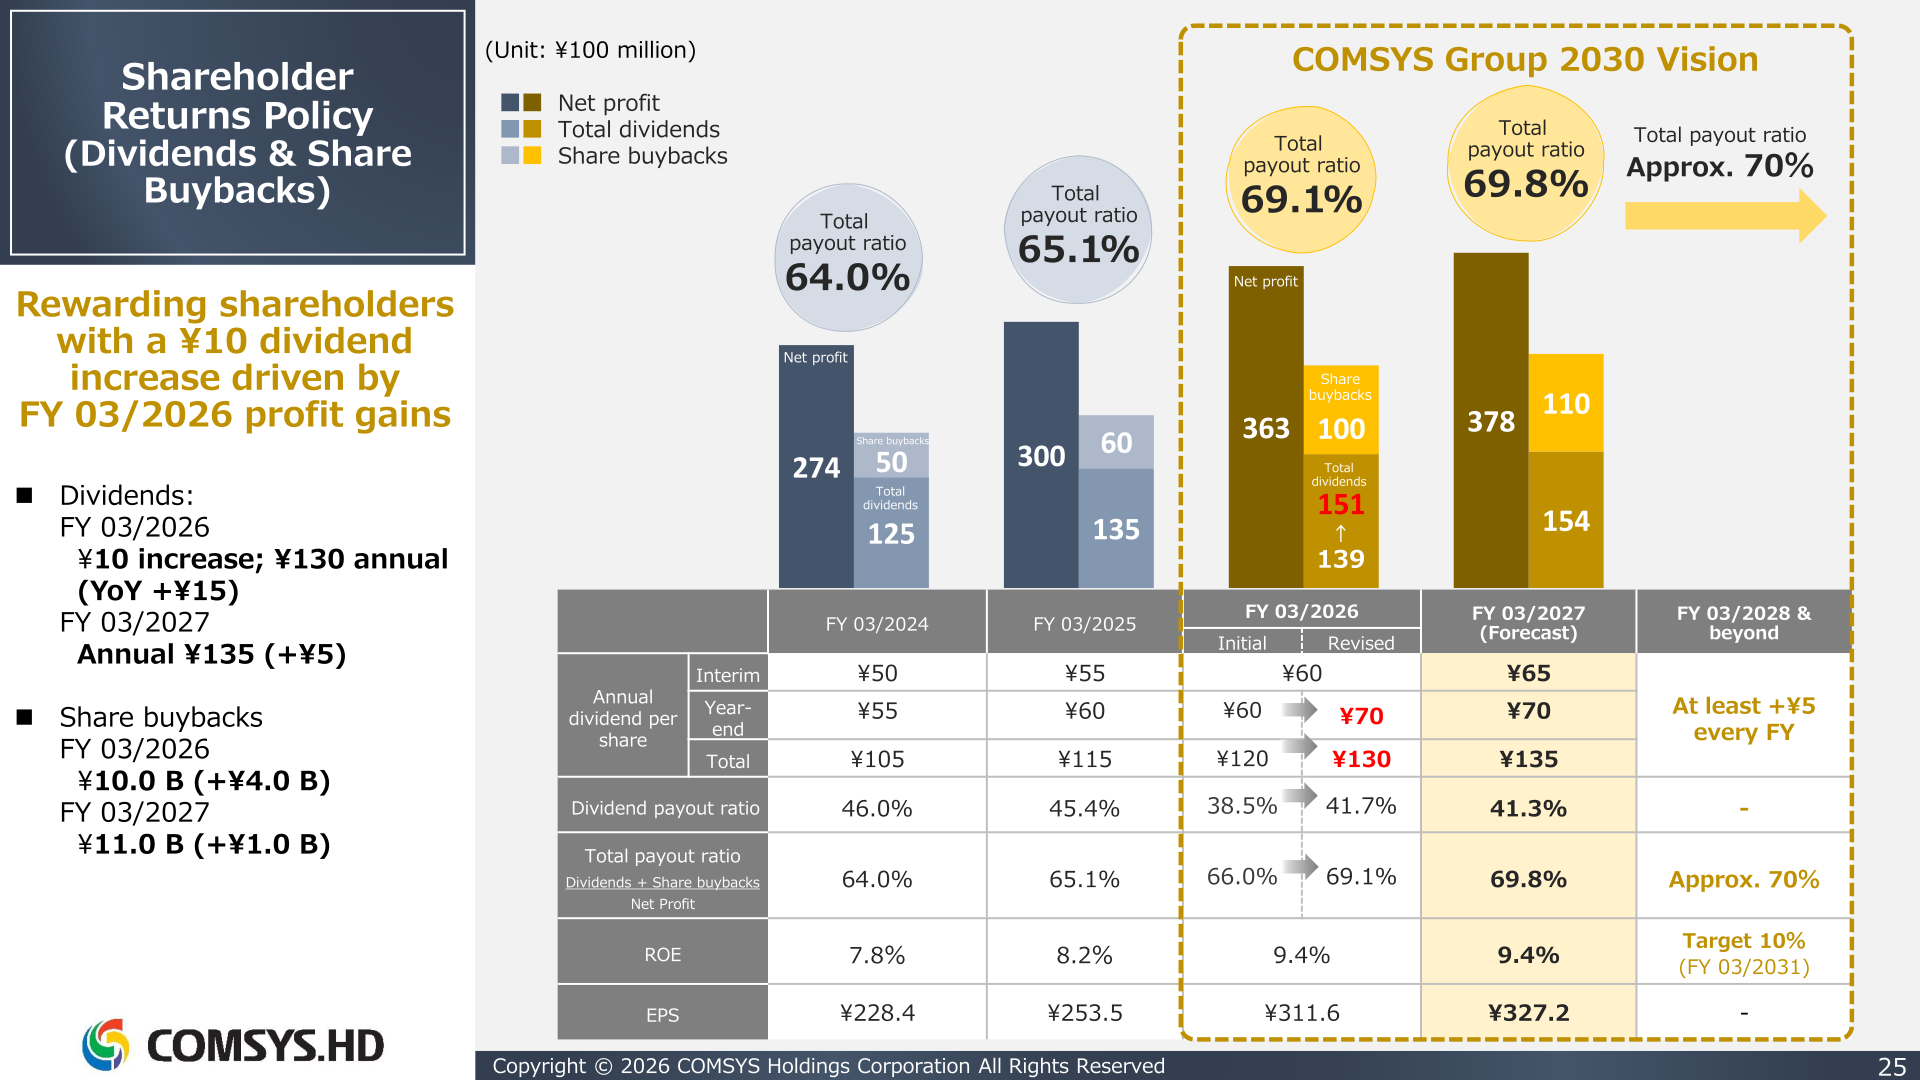
COMSYS raised its FY 03/2026 annual dividend to ¥130 per share, ¥10 above the initial plan of ¥120 and ¥15 higher year on year, by lifting the year-end dividend to ¥70 from the ¥60 initially planned. The dividend payout ratio therefore came to 41.7% against 38.5% on the initial plan, and the total payout ratio (dividends plus share buybacks divided by net profit) to 69.1% against 66.0%. Share buybacks amounted to ¥10.0 B in FY 03/2026, an increase of ¥4.0 B, and ¥11.0 B is planned for FY 03/2027, an increase of ¥1.0 B. For FY 03/2027 the company guides an annual dividend of ¥135 (+¥5), a payout ratio of 41.3% and a total payout ratio of 69.8%. From FY 03/2028 and beyond the policy is to raise the dividend by at least ¥5 every fiscal year and to keep the total payout ratio at approximately 70%.
The company describes FY 03/2026 as its 22nd consecutive fiscal year of stable and growing dividends counting from its founding, and the 13th consecutive year of dividend increases starting with FY 03/2014; FY 03/2027 guidance would make it 23 consecutive years.
| Item | FY 03/2025 | FY 03/2026 | FY 03/2027 (Forecast) |
|---|---|---|---|
| Interim dividend per share | ¥55 | ¥60 | ¥65 |
| Year-end dividend per share | ¥60 | ¥70 | ¥70 |
| Total annual dividend per share | ¥115 | ¥130 | ¥135 |
| Dividend payout ratio | 45.4% | 41.7% | 41.3% |
| Total payout ratio (dividends + share buybacks / net profit) | 65.1% | 69.1% | 69.8% |
| ROE | 8.2% | 9.4% | 9.4% |
| EPS | ¥253.5 | ¥311.6 | ¥327.2 |
COMSYS Group 2030 Vision and Topics
FY 03/2026 was the first year of the COMSYS Group 2030 Vision, covering FY 03/2026 through FY 03/2031. The plan targets net sales of ¥800.0 B or over, operating profit of ¥60.0 B or over and ROE of 10% by FY 03/2031, shown in the presentation’s unit terms as net sales of 8,000 or over and operating profit of 600 or over.
Data centers are a focus of the Social Systems-Related Business. DC business orders received were 585 and DC net sales 340 in FY 03/2026 — figures that include the Carrier-Related and IT Solutions businesses in addition to the Social Systems-Related business — including ¥7 B of orders secured ahead of schedule in March that had originally been scheduled for the following fiscal year. For FY 03/2027 the company forecasts DC orders received of approximately 380 and DC net sales of approximately 460. It also launched a containerized data center business, opening Cube Park NAGANO in February 2026, is cross-deploying engineers from the Carrier-Related Business to handle roughly 40% of DC construction, and is training roughly 50 engineers from across the Group on major DC projects in the Tokyo metropolitan area.
On governance, board composition is expected to move to 6 outside and 5 inside directors following the June 2026 ordinary general meeting of shareholders — an independent outside director ratio of 54.5%, up from 45.5% in 2025 — and independent outside directors are to chair both the Board of Directors and the Nomination and Remuneration Advisory Committee from June 2026. On sustainability, COMSYS earned its first CDP Climate Change ‘A List’ rating for 2025, awarded to the top 4% of the 22,700 companies globally that took the CDP survey, having reached net-zero Scope 2 emissions in FY 2025 via energy certificates issued by the group’s solar farms. On engagement, an Employee Stock Ownership Plan was rolled out in March 2026 to roughly 10,000 group employees, and the stock incentive match rate for the Employee Stock Ownership Association was raised from 5% to 20% in April 2025.
This article is an analysis based on publicly available information and is not a recommendation to buy or sell any specific securities. Investment decisions are your own responsibility.
![[Obayashi] Investors’ Guide 2026 — The Complete 24-Article Breakdown](https://japan-equity.com/wp-content/uploads/2026/07/hub_cover-1024x1024.png)
![[Obayashi] IR & SR Policy — Feeding Dialogue Back into Management](https://japan-equity.com/wp-content/uploads/2026/07/p32_sq-1024x1024.jpg)
![[Obayashi] Real Estate Development — 18.7% Margin, ¥287.7bn Unrealized Gains](https://japan-equity.com/wp-content/uploads/2026/07/p20_sq-1024x1024.jpg)
![[Obayashi] Domestic Civil Engineering — Resilience Spending Supports 9.6% Margin](https://japan-equity.com/wp-content/uploads/2026/07/p11_sq-1024x1024.jpg)
![[Obayashi] Share Price & External Ratings — vs TOPIX, ESG Index Inclusion](https://japan-equity.com/wp-content/uploads/2026/07/p40_sq-1024x1024.jpg)
![[Construction] ¥75.5tn Investment, Shrinking Workforce — Big-5 Market Share](https://japan-equity.com/wp-content/uploads/2026/07/p12_sq-1024x1024.jpg)



![[Obayashi] Capital Policy & Shareholder Returns — ROE 10%+, DOE ~5%, ¥100bn Buyback](https://japan-equity.com/wp-content/uploads/2026/07/p27_sq-1024x1024.jpg)
![[Obayashi] Reducing Cross-Shareholdings — ¥285.2bn Sold in Five Years](https://japan-equity.com/wp-content/uploads/2026/07/p29_sq-1024x1024.jpg)
![[Obayashi] ¥750bn Investment Plan — ¥300bn to Development, ¥190bn to Tech/DX](https://japan-equity.com/wp-content/uploads/2026/07/p30_sq-1024x1024.jpg)
![[Obayashi] MTP2022 KPIs — Operating Profit ~2x Target, ROE 14.4%](https://japan-equity.com/wp-content/uploads/2026/07/p25_sq-1024x1024.jpg)
![[Obayashi] Cash Allocation — ¥420bn Investment CF Over Five Years](https://japan-equity.com/wp-content/uploads/2026/07/p26_sq-1024x1024.jpg)
![[Obayashi] Green Energy — 44 Plants, 344MW, and the Green Hydrogen Challenge](https://japan-equity.com/wp-content/uploads/2026/07/p21_sq-1024x1024.jpg)
![[Obayashi] Tackling the Labor Shortage — Robotics Construction®](https://japan-equity.com/wp-content/uploads/2026/07/p14_sq-1024x1024.jpg)
