
This article is based on publicly available IR materials and is not a recommendation to buy or sell any specific securities.
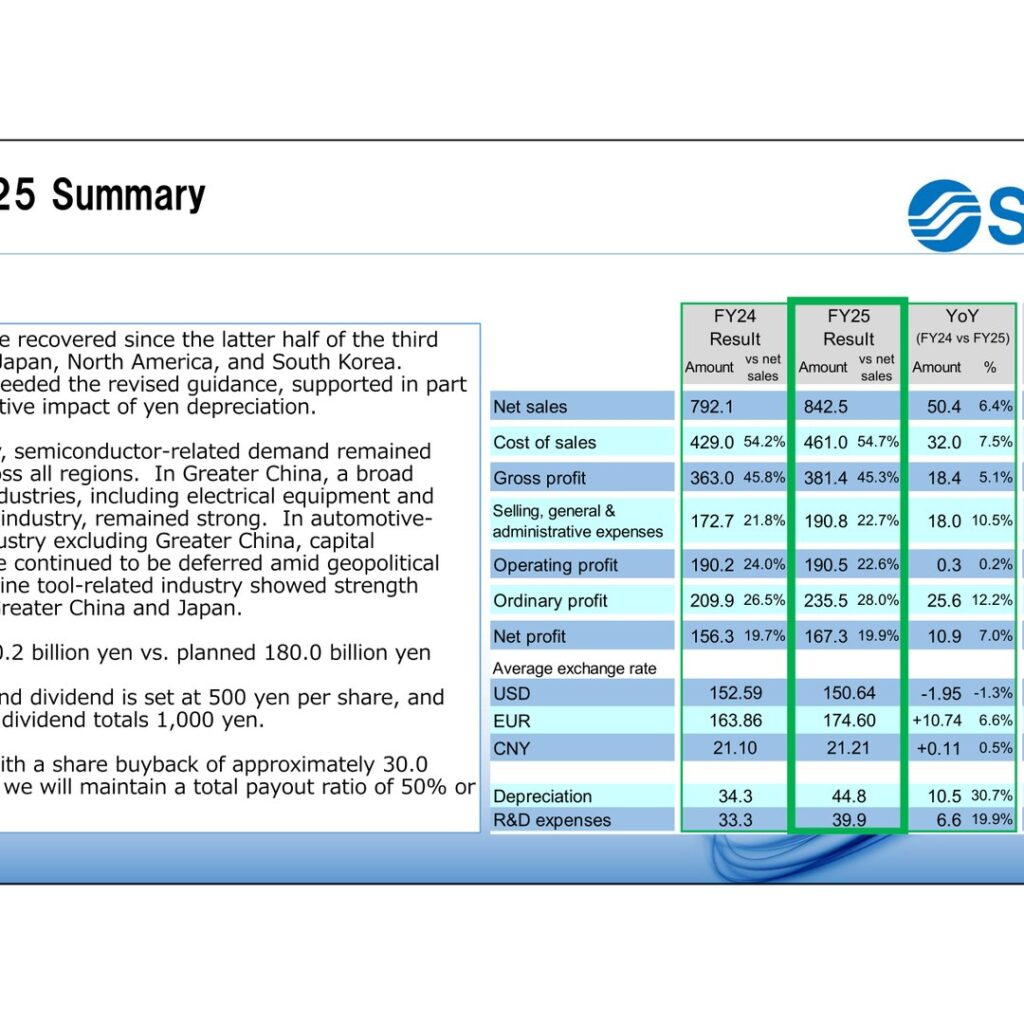
SMC Corporation reported net sales of 842.5 billion yen for FY2025, the fiscal year ended March 31, 2026, up 50.4 billion yen or 6.4% year on year and ahead of its 816.0 billion yen forecast. Operating profit was almost flat at 190.5 billion yen (+0.2%), while ordinary profit rose 12.2% to 235.5 billion yen and net profit rose 7.0% to 167.3 billion yen. The company states that orders recovered from the latter half of the third quarter in Japan, North America and South Korea, and that results exceeded the revised guidance, supported in part by the positive impact of yen depreciation. For FY2026 SMC guides to net sales of 1,000.0 billion yen, which it describes as achieving its medium-term target of 1 trillion yen in sales.
Consolidated Results (Full-Year Actual)
Figures below are in billions of yen as presented in the results presentation. Percentages shown in parentheses next to an amount are the ratio to net sales. Gross profit rose 5.1% to 381.4 billion yen, but the gross margin narrowed to 45.3% from 45.8%, and selling, general and administrative expenses increased 10.5% to 190.8 billion yen, leaving operating profit essentially unchanged at 190.5 billion yen and the operating margin down to 22.6% from 24.0%. Ordinary profit grew faster than operating profit, reaching 235.5 billion yen, equivalent to 28.0% of net sales.
| Item | FY2025 (Result) | FY2024 (Result) | YoY Change | YoY % | FY2025 (Forecast) |
|---|---|---|---|---|---|
| Net sales | 842.5 | 792.1 | 50.4 | 6.4% | 816.0 |
| Cost of sales | 461.0 (54.7%) | 429.0 (54.2%) | 32.0 | 7.5% | 449.0 (55.0%) |
| Gross profit | 381.4 (45.3%) | 363.0 (45.8%) | 18.4 | 5.1% | 367.0 (45.0%) |
| Selling, general & administrative expenses | 190.8 (22.7%) | 172.7 (21.8%) | 18.0 | 10.5% | 184.0 (22.5%) |
| Operating profit | 190.5 (22.6%) | 190.2 (24.0%) | 0.3 | 0.2% | 183.0 (22.4%) |
| Ordinary profit | 235.5 (28.0%) | 209.9 (26.5%) | 25.6 | 12.2% | 209.0 (25.6%) |
| Net profit | 167.3 (19.9%) | 156.3 (19.7%) | 10.9 | 7.0% | 153.0 (18.8%) |
| Average exchange rate: USD | 150.64 | 152.59 | -1.95 | -1.3% | 147.10 |
| Average exchange rate: EUR | 174.60 | 163.86 | +10.74 | 6.6% | 172.00 |
| Average exchange rate: CNY | 21.21 | 21.10 | +0.11 | 0.5% | 20.60 |
| Depreciation | 44.8 | 34.3 | 10.5 | 30.7% | 42.3 (Progress 106.0%) |
| R&D expenses | 39.9 | 33.3 | 6.6 | 19.9% | 37.0 (Progress 108.1%) |
The company breaks the 50.4 billion yen increase in net sales into a 31.2 billion yen contribution from sales quantity (a 3.9% increase), 4.8 billion yen from selling price (0.6%), 7.4 billion yen from exchange rate fluctuation (0.9%) and 7.0 billion yen from newly consolidated companies. On operating profit, positives of 14.0 billion yen from sales quantity, 4.8 billion yen from selling price, 14.4 billion yen from the swing in inventory devaluation (from -10.3 billion yen in FY2024 to +4.1 billion yen in FY2025) and 1.0 billion yen from newly consolidated companies were offset by -14.8 billion yen from processing costs, material costs and others, -9.7 billion yen from SG&A expenses, -6.7 billion yen from US tariffs and -2.7 billion yen from exchange rate fluctuation.
Sales by Region and Industry
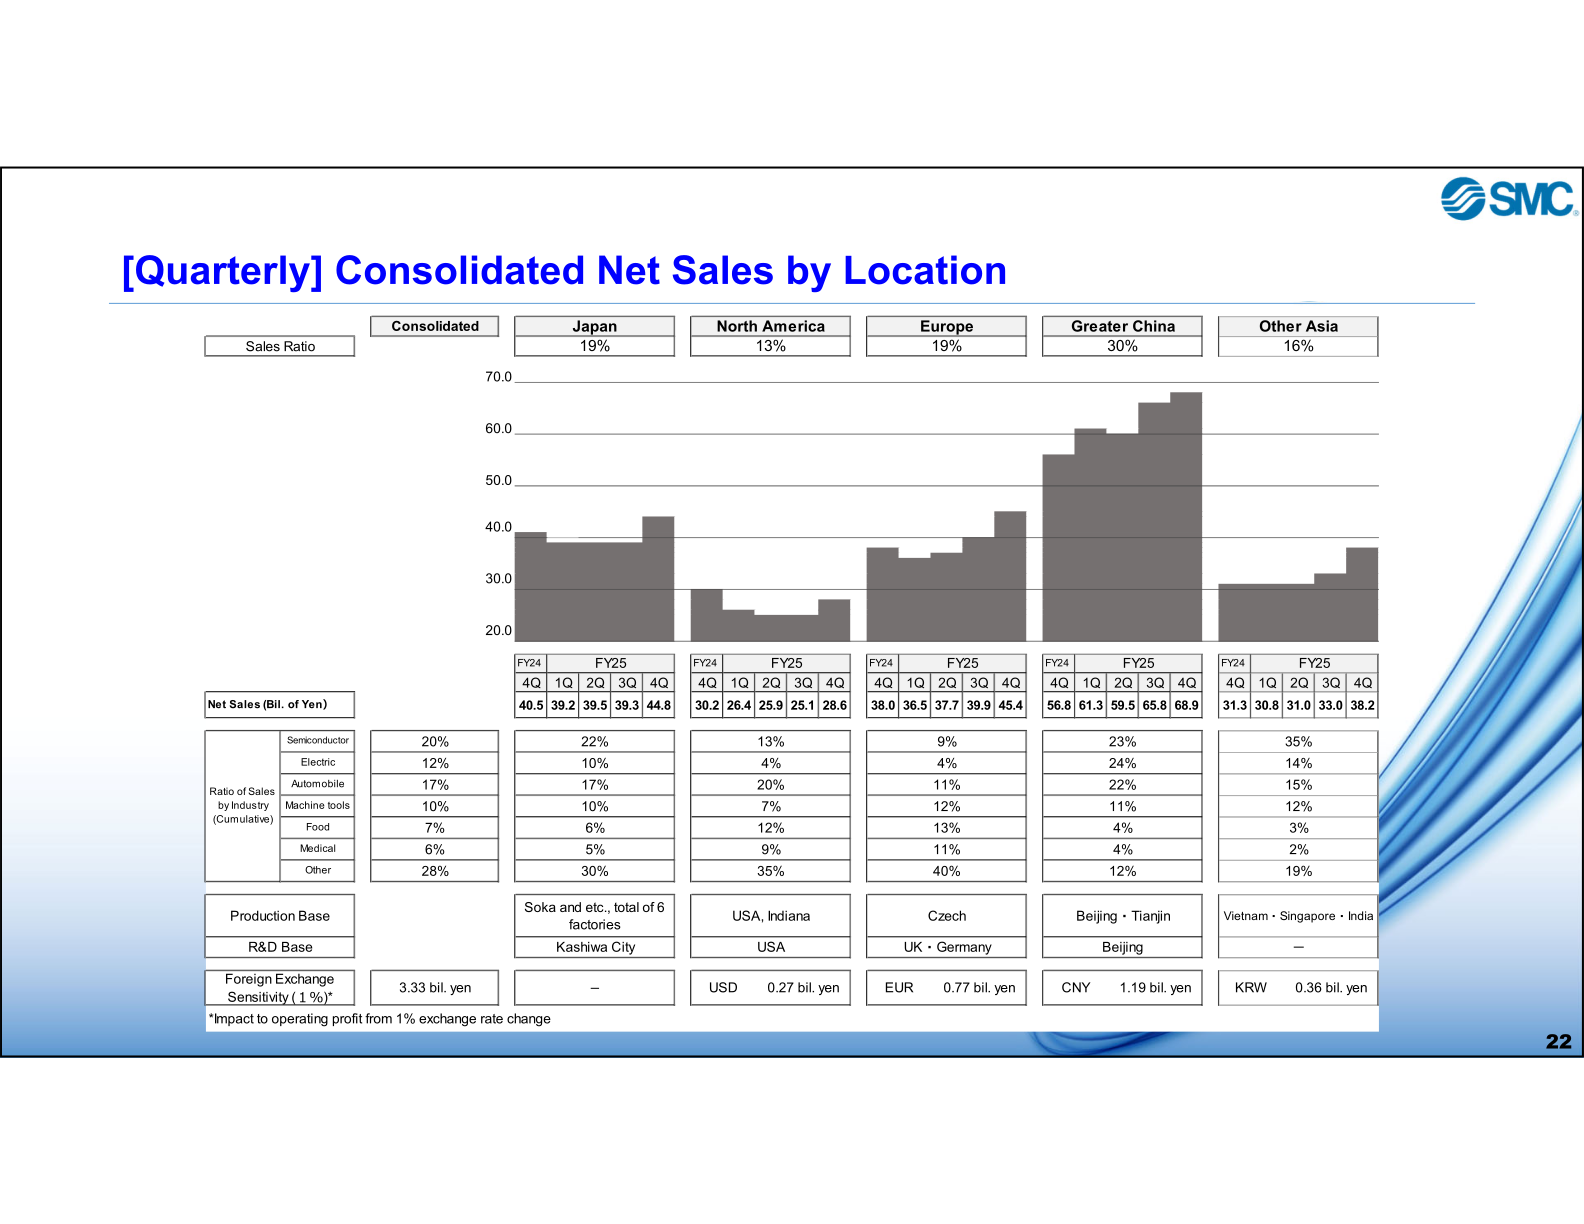
SMC presents its business by location rather than by reportable segment. On a cumulative FY2025 basis the sales ratio was Japan 19%, North America 13%, Europe 19%, Greater China 30% and Other Asia 16%. Quarterly net sales by location show Greater China as the largest and fastest-growing region, rising from 56.8 billion yen in FY2024 4Q to 68.9 billion yen in FY2025 4Q, while North America declined from 30.2 billion yen to 28.6 billion yen over the same comparison.
| Region | Sales ratio | FY2024 4Q | FY2025 1Q | FY2025 2Q | FY2025 3Q | FY2025 4Q |
|---|---|---|---|---|---|---|
| Japan | 19% | 40.5 | 39.2 | 39.5 | 39.3 | 44.8 |
| North America | 13% | 30.2 | 26.4 | 25.9 | 25.1 | 28.6 |
| Europe | 19% | 38.0 | 36.5 | 37.7 | 39.9 | 45.4 |
| Greater China | 30% | 56.8 | 61.3 | 59.5 | 65.8 | 68.9 |
| Other Asia | 16% | 31.3 | 30.8 | 31.0 | 33.0 | 38.2 |
On a full-year sales quantity basis, Japan decreased 4.1 billion yen (-2%) and North America decreased 12.3 billion yen (-10%), while Europe increased 6.7 billion yen (+4%), Greater China increased 34.5 billion yen (+15%) and Other Asia increased 7.0 billion yen (+5%). By industry, the cumulative consolidated sales mix was semiconductor 20%, electric 12%, automobile 17%, machine tools 10%, food 7%, medical 6% and other 28%. The company notes that semiconductor-related demand remained strong across all regions, that a broad range of industries in Greater China including electrical equipment and EV-related industry remained strong, and that capital expenditure in automotive-related industry outside Greater China continued to be deferred amid geopolitical risks. Foreign exchange sensitivity to a 1% rate change is given as 3.33 billion yen on a consolidated basis (USD 0.27 billion yen, EUR 0.77 billion yen, CNY 1.19 billion yen, KRW 0.36 billion yen).
FY2026 Forecast
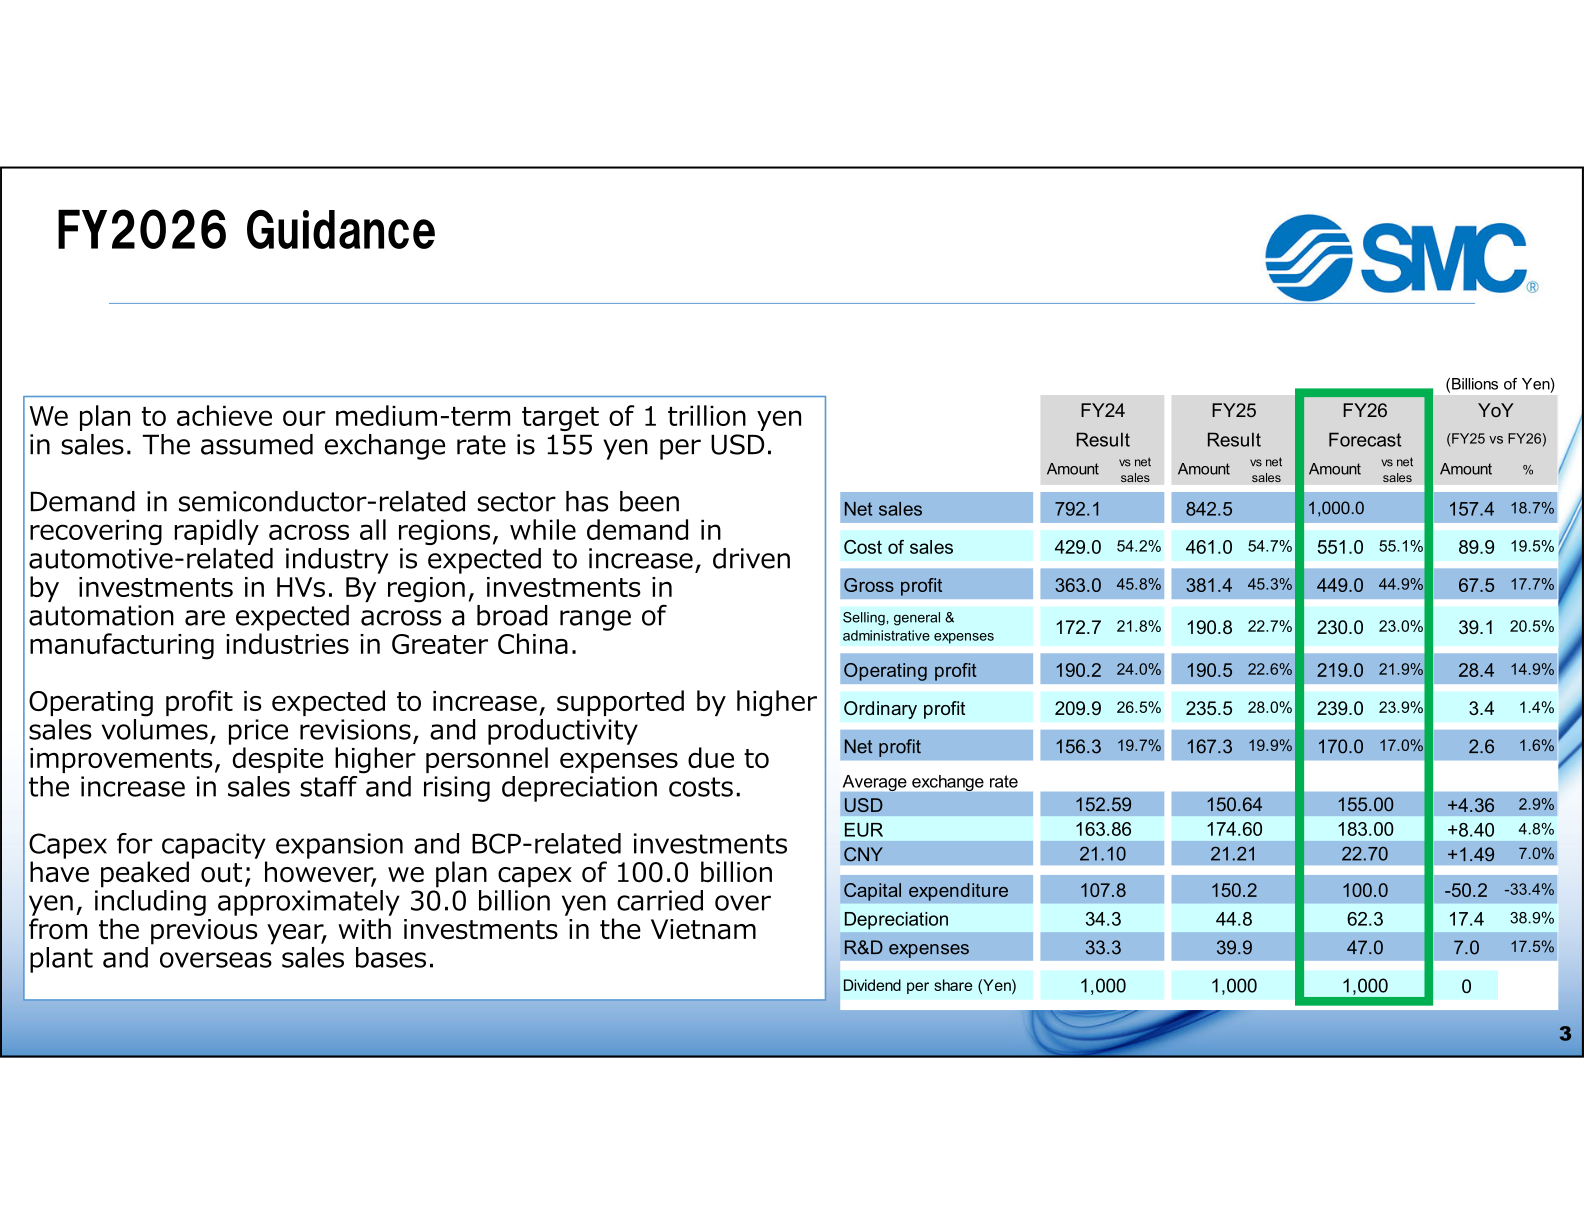
SMC forecasts FY2026 net sales of 1,000.0 billion yen, up 157.4 billion yen or 18.7%, operating profit of 219.0 billion yen (+14.9%), ordinary profit of 239.0 billion yen (+1.4%) and net profit of 170.0 billion yen (+1.6%). The assumed exchange rate is 155 yen per USD. The company expects operating profit to increase on higher sales volumes, price revisions and productivity improvements, despite higher personnel expenses from the increase in sales staff and rising depreciation costs.
| Item | FY2026 (Forecast) | FY2025 (Result) | Change | % |
|---|---|---|---|---|
| Net sales | 1,000.0 | 842.5 | 157.4 | 18.7% |
| Cost of sales | 551.0 (55.1%) | 461.0 (54.7%) | 89.9 | 19.5% |
| Gross profit | 449.0 (44.9%) | 381.4 (45.3%) | 67.5 | 17.7% |
| Selling, general & administrative expenses | 230.0 (23.0%) | 190.8 (22.7%) | 39.1 | 20.5% |
| Operating profit | 219.0 (21.9%) | 190.5 (22.6%) | 28.4 | 14.9% |
| Ordinary profit | 239.0 (23.9%) | 235.5 (28.0%) | 3.4 | 1.4% |
| Net profit | 170.0 (17.0%) | 167.3 (19.9%) | 2.6 | 1.6% |
| Average exchange rate: USD | 155.00 | 150.64 | +4.36 | 2.9% |
| Average exchange rate: EUR | 183.00 | 174.60 | +8.40 | 4.8% |
| Average exchange rate: CNY | 22.70 | 21.21 | +1.49 | 7.0% |
| Capital expenditure | 100.0 | 150.2 | -50.2 | -33.4% |
| Depreciation | 62.3 | 44.8 | 17.4 | 38.9% |
| R&D expenses | 47.0 | 39.9 | 7.0 | 17.5% |
| Dividend per share (Yen) | 1,000 | 1,000 | 0 | – |
The bridge from FY2025 actual to FY2026 forecast net sales consists of +119.8 billion yen from sales quantity, +4.0 billion yen from selling price and +33.6 billion yen from exchange rate fluctuation. By region, the sales quantity increase is Japan +27.7 billion yen (+17%), North America +3.8 billion yen (+14%), Europe +20.6 billion yen (+13%), Greater China +40.4 billion yen (+16%) and Other Asia +14.8 billion yen (+11%). Order momentum supports the outlook: on an index where FY2024 equals 100, consolidated orders were 110 for FY2025, 107 in FY2025 3Q, 133 in FY2025 4Q and 155 in April 2026, with Greater China at 202 and semiconductor/electric at 218 in April 2026.
Shareholder Returns
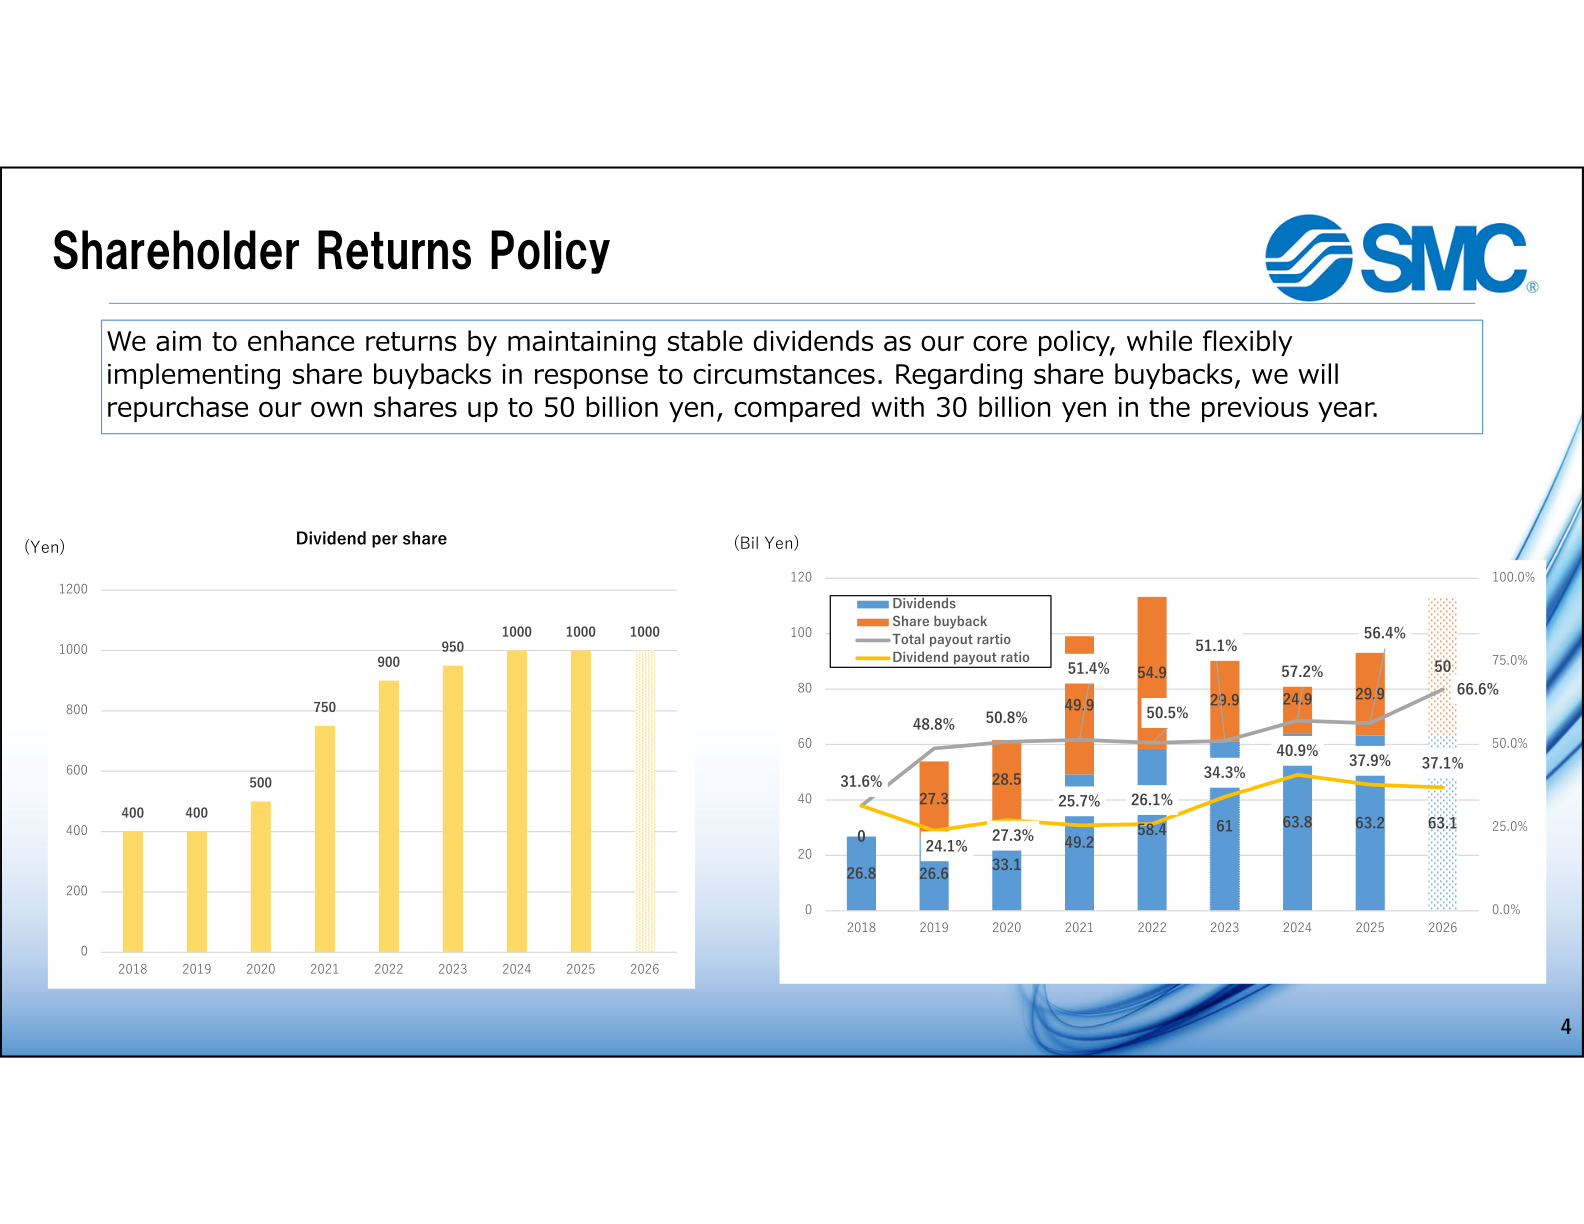
SMC states that it aims to enhance returns by maintaining stable dividends as its core policy while flexibly implementing share buybacks in response to circumstances. The year-end dividend for FY2025 is set at 500 yen per share, bringing the annual dividend to 1,000 yen, unchanged from the previous year, and the FY2026 forecast dividend is also 1,000 yen. Together with a share buyback of approximately 30.0 billion yen in FY2025, the company says it will maintain a total payout ratio of 50% or higher. For FY2026 it plans to repurchase its own shares up to 50 billion yen, compared with 30 billion yen in the previous year.
| Item | FY2024 | FY2025 | FY2026 (Plan) |
|---|---|---|---|
| Dividend per share (Yen) | 1,000 | 1,000 | 1,000 |
| Dividends (Bil Yen) | 63.8 | 63.2 | 63.1 |
| Share buyback (Bil Yen) | 24.9 | 29.9 | 50 |
| Total payout ratio | 57.2% | 56.4% | 66.6% |
| Dividend payout ratio | 40.9% | 37.9% | 37.1% |
Medium-Term Plan and Priority Measures
The FY2026 sales guidance of 1,000.0 billion yen is presented as the achievement of the company’s medium-term target of 1 trillion yen in sales. SMC sets out three mid- to long-term priority measures: sales strategies based on its strengths, namely a wide global footprint and a wide product lineup with a short delivery lead time system offering “one-stop shop” services; aggressive capital expenditure to differentiate from competitors, covering product supply capability, production diversification and human capital investment; and establishing a system for developing products that meet the performance required by customers, including compact and lightweight and environmentally friendly products.
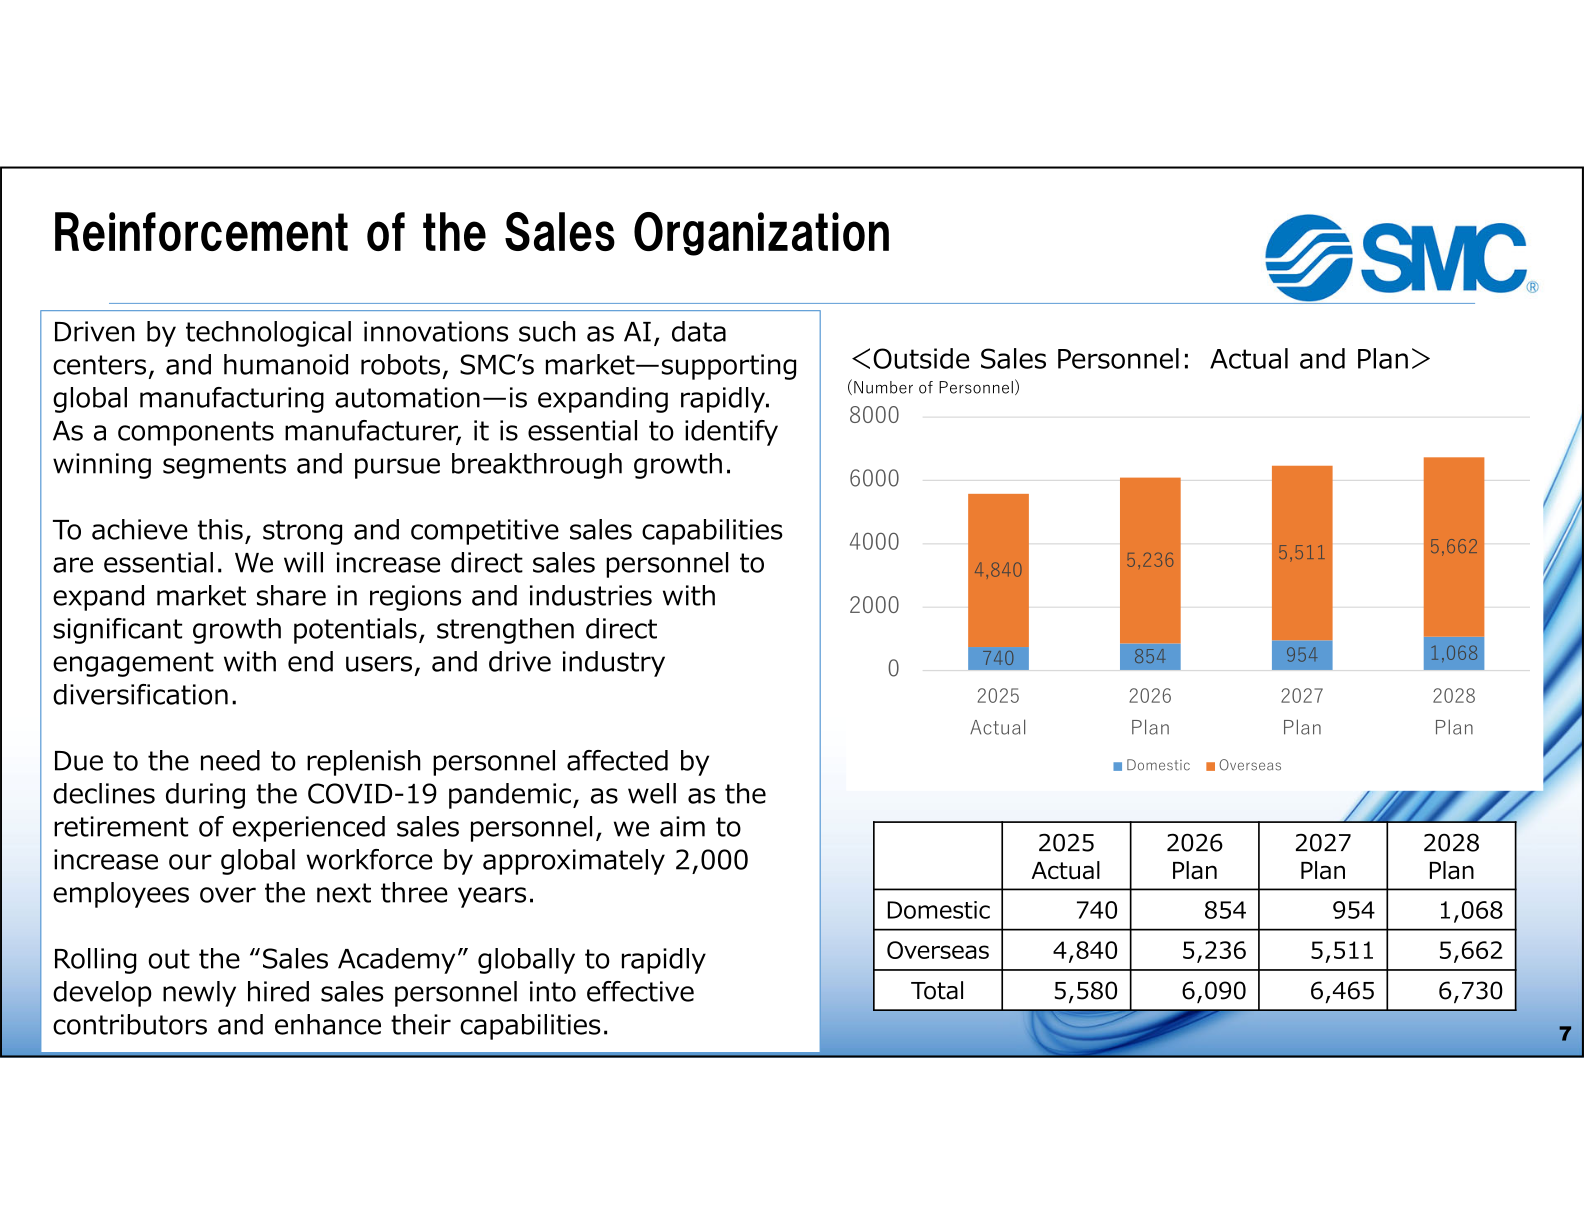
A central plank is reinforcement of the sales organization. Citing technological innovations such as AI, data centers and humanoid robots, the company plans to increase outside sales personnel from 5,580 in FY2025 actual (domestic 740, overseas 4,840) to 6,090 in FY2026, 6,465 in FY2027 and 6,730 in FY2028, and says it aims to increase its global workforce by approximately 2,000 employees over the next three years while rolling out its “Sales Academy” globally.
On investment, FY2025 capital expenditure reached a record high of 150.2 billion yen against a plan of 180.0 billion yen, driven by the completion of JTC and the Tono Supplier Park. FY2026 capital expenditure is planned at 100.0 billion yen, including approximately 30.0 billion yen carried over from the previous year, with investments in the Vietnam plant and overseas sales bases, while depreciation expenses are projected to reach a record high of approximately 62.0 billion yen. In products, consolidated sales of chillers were 60.9 billion yen in 2025, with a sales plan of 73.0 billion yen for FY2026 and 100.0 billion yen for FY2027, and the company has developed and launched a membrane nitrogen generator achieving a nitrogen concentration of 99.9% or more from a compressed air supply alone, which it says reduces costs by approximately 94% compared with conventional nitrogen gas cylinders.
Balance Sheet and Financial Position
Total assets increased 211.0 billion yen (10.0%) to 2,311.8 billion yen, with non-current assets up 128.6 billion yen (18.9%) to 807.5 billion yen. Cash and deposits were 663.8 billion yen and cashable financial assets 827.8 billion yen, up 19.9 billion yen (2.5%). Liabilities rose 24.1 billion yen (14.0%) to 196.5 billion yen and net assets rose 186.9 billion yen (9.7%) to 2,115.2 billion yen. The equity ratio was 91.5% against 91.8% a year earlier, net assets per share rose 3,243 yen to 33,498 yen, and ROE was 8.3% against 8.2%. Total inventory increased 17.0 billion yen to 506.6 billion yen, but the company shows an actual change of -11.5 billion yen after stripping out impacts of 3.1 billion yen from consolidation expansion, 21.2 billion yen from exchange rate fluctuation and 4.1 billion yen from inventory devaluation; the closing month sales ratio improved to 5.9 from 7.4.
Governance and ESG Topics
Subject to approval of amendments to the Articles of Incorporation at the annual general meeting scheduled for June 26, 2026, SMC will transition to a Company with an Audit and Supervisory Committee, stating that the purpose is to strengthen the supervisory function of the Board, clearly separate supervisory from executive functions and enable more agile and efficient decision-making. After the AGM the Board is to comprise 7 internal executive directors, 4 independent directors and 3 independent directors serving as Audit and Supervisory Committee members. On ESG, the company was selected for the CDP 2025 “A List,” the highest rating, in both Climate Change and Water Security, improved its EcoVadis score to 67/100 (Bronze) from 59/100, and received SBT certification for a net-zero target for Scope 1 and 2 by FY2040 and for Scope 3 by FY2050, alongside short-term targets of a 48% reduction in Scope 1 and 2 and a 33% reduction in Scope 3 by FY2030 versus FY2021.
This article is an analysis based on publicly available information and is not a recommendation to buy or sell any specific securities. Investment decisions are your own responsibility.
![[Obayashi] Investors’ Guide 2026 — The Complete 24-Article Breakdown](https://japan-equity.com/wp-content/uploads/2026/07/hub_cover-1024x1024.png)
![[Obayashi] IR & SR Policy — Feeding Dialogue Back into Management](https://japan-equity.com/wp-content/uploads/2026/07/p32_sq-1024x1024.jpg)
![[Obayashi] Real Estate Development — 18.7% Margin, ¥287.7bn Unrealized Gains](https://japan-equity.com/wp-content/uploads/2026/07/p20_sq-1024x1024.jpg)
![[Obayashi] Domestic Civil Engineering — Resilience Spending Supports 9.6% Margin](https://japan-equity.com/wp-content/uploads/2026/07/p11_sq-1024x1024.jpg)
![[Obayashi] Share Price & External Ratings — vs TOPIX, ESG Index Inclusion](https://japan-equity.com/wp-content/uploads/2026/07/p40_sq-1024x1024.jpg)
![[Construction] ¥75.5tn Investment, Shrinking Workforce — Big-5 Market Share](https://japan-equity.com/wp-content/uploads/2026/07/p12_sq-1024x1024.jpg)



![[Obayashi] Capital Policy & Shareholder Returns — ROE 10%+, DOE ~5%, ¥100bn Buyback](https://japan-equity.com/wp-content/uploads/2026/07/p27_sq-1024x1024.jpg)
![[Obayashi] Reducing Cross-Shareholdings — ¥285.2bn Sold in Five Years](https://japan-equity.com/wp-content/uploads/2026/07/p29_sq-1024x1024.jpg)
![[Obayashi] ¥750bn Investment Plan — ¥300bn to Development, ¥190bn to Tech/DX](https://japan-equity.com/wp-content/uploads/2026/07/p30_sq-1024x1024.jpg)
![[Obayashi] MTP2022 KPIs — Operating Profit ~2x Target, ROE 14.4%](https://japan-equity.com/wp-content/uploads/2026/07/p25_sq-1024x1024.jpg)
![[Obayashi] Cash Allocation — ¥420bn Investment CF Over Five Years](https://japan-equity.com/wp-content/uploads/2026/07/p26_sq-1024x1024.jpg)
![[Obayashi] Green Energy — 44 Plants, 344MW, and the Green Hydrogen Challenge](https://japan-equity.com/wp-content/uploads/2026/07/p21_sq-1024x1024.jpg)
![[Obayashi] Tackling the Labor Shortage — Robotics Construction®](https://japan-equity.com/wp-content/uploads/2026/07/p14_sq-1024x1024.jpg)
