
This article is based on publicly available IR materials and is not a recommendation to buy or sell any specific securities.
Mitsubishi Chemical Group Corporation (4188) reported FY2025 (fiscal year ended March 31, 2026) consolidated sales revenue of ¥3,704.0Bn (down 6% year on year) and core operating income of ¥225.0Bn (down 2% year on year), as solid performance in Industrial Gases largely offset a 43% decline in Chemicals Business core operating income to ¥24.3Bn amid a deteriorating MMA monomer market and an impairment loss on Soarnol-related fixed assets in the UK. Net income attributable to owners of the parent fell 74% year on year to ¥11.8Bn, despite the recording of proceeds from the transfer of Mitsubishi Tanabe Pharma, due to a loss from the decision to withdraw from the coke and carbon materials businesses and special retirement expenses under Mitsubishi Chemical Corporation’s Next-Stage Support Program. For FY2026, the company forecasts core operating income of ¥305.0Bn and net income attributable to owners of the parent of ¥127.0Bn, with Chemicals Business core operating income expected to rise to ¥100.0Bn; the forecast excludes the impact of the situation in the Middle East, including the effective closure of the Strait of Hormuz.
Consolidated Results (Full-Year Actual)
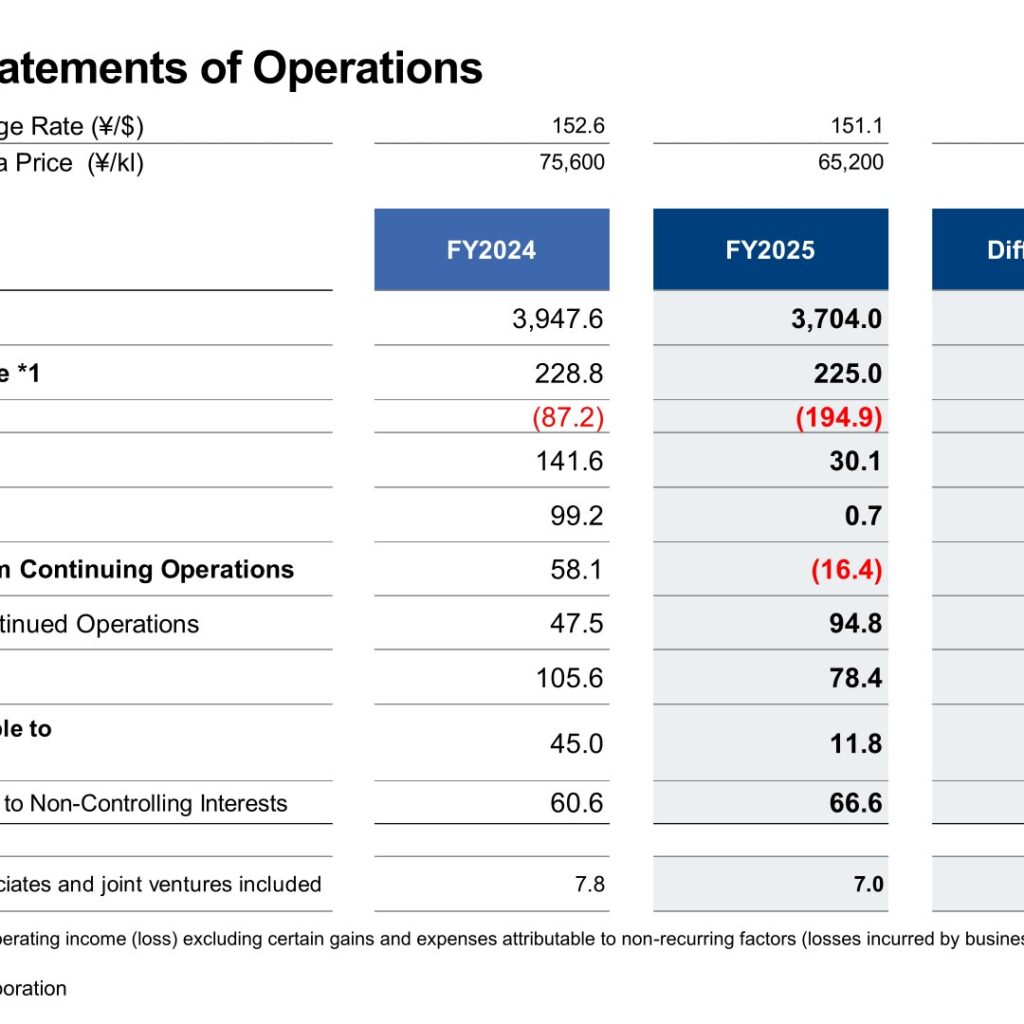
Operating income decreased 79% year on year to ¥30.1Bn, reflecting a widening of special items to ¥(194.9)Bn (FY2024: ¥(87.2)Bn) that included a ¥(61.4)Bn impairment loss, a ¥(59.2)Bn provision for restructuring costs, and ¥(53.1)Bn in special retirement expenses. Income before taxes fell 99% to ¥0.7Bn. Net income (loss) from continuing operations was ¥(16.4)Bn (FY2024: ¥58.1Bn), while net income from discontinued operations (Mitsubishi Tanabe Pharma) was ¥94.8Bn (FY2024: ¥47.5Bn). Total net income was ¥78.4Bn (FY2024: ¥105.6Bn).
| Item | FY2024 | FY2025 | Change |
|---|---|---|---|
| Sales Revenue (¥Bn) | 3,947.6 | 3,704.0 | (243.6) (6%) |
| Core Operating Income (¥Bn) | 228.8 | 225.0 | (3.8) (2%) |
| Special Items (¥Bn) | (87.2) | (194.9) | (107.7) |
| Operating Income (¥Bn) | 141.6 | 30.1 | (111.5) (79%) |
| Income before Taxes (¥Bn) | 99.2 | 0.7 | (98.5) (99%) |
| Net Income (Loss) from Continuing Operations (¥Bn) | 58.1 | (16.4) | (74.5) |
| Net Income from Discontinued Operations (¥Bn) | 47.5 | 94.8 | 47.3 |
| Net Income (¥Bn) | 105.6 | 78.4 | (27.2) |
| Net Income Attributable to Owners of the Parent (¥Bn) | 45.0 | 11.8 | (33.2) (74%) |
| Net Income Attributable to Non-Controlling Interests (¥Bn) | 60.6 | 66.6 | 6.0 |
Segment Results
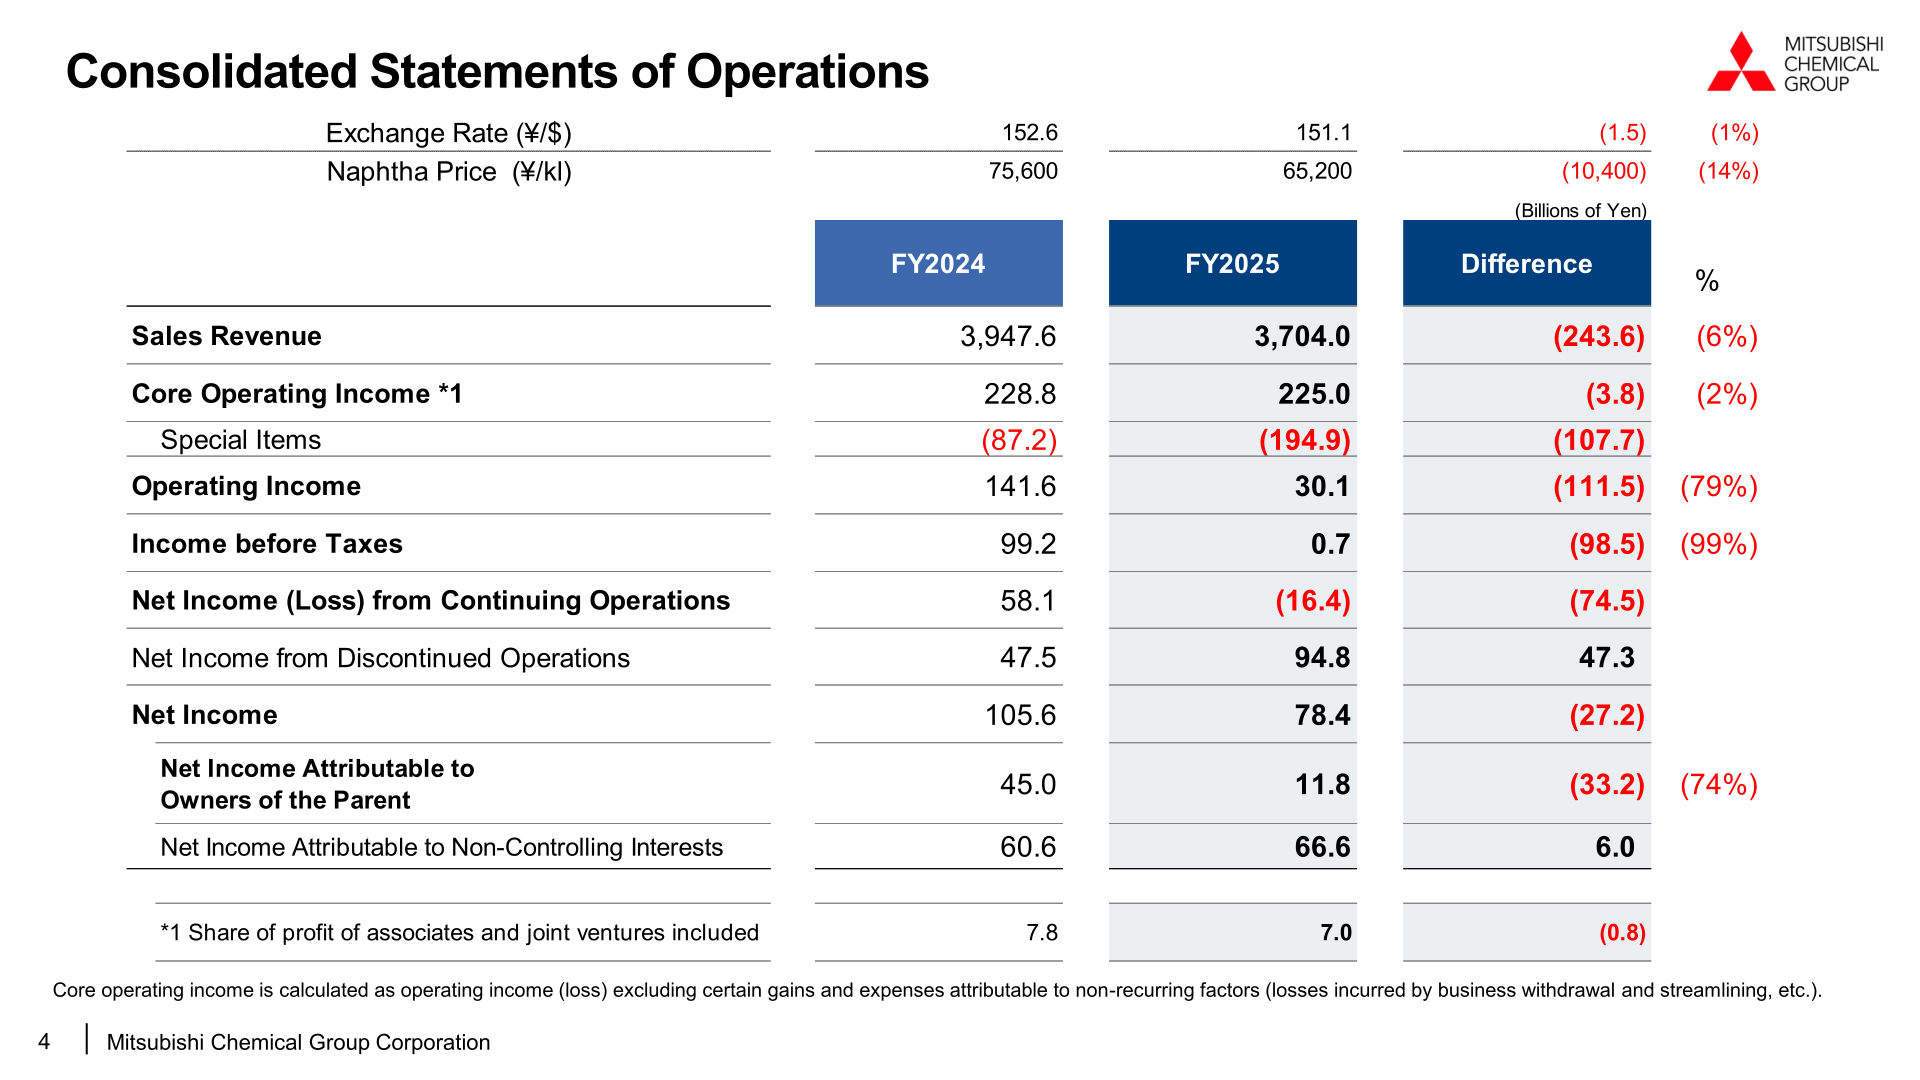
Within the Chemicals Business (core operating income ¥24.3Bn, down 43% year on year), Specialty Materials core operating income rose 35% to ¥32.3Bn as price gap and sales volume improved, though Advanced Films & Polymers core operating income fell to ¥7.4Bn (FY2024: ¥34.0Bn), partly due to a ¥(30.3)Bn impairment loss on Soarnol-related fixed assets in the UK. MMA & Derivatives swung to a core operating loss of ¥(1.5)Bn (FY2024: ¥35.7Bn profit), as the MMA segment posted a loss of ¥(8.3)Bn (FY2024: ¥32.3Bn profit) on deteriorating MMA monomer market prices. Basic Materials & Polymers narrowed its core operating loss to ¥(4.2)Bn (FY2024: ¥(14.6)Bn), including Carbon Products at ¥(2.3)Bn (FY2024: ¥(27.4)Bn), reflecting improved price gap and cost reductions from structural reform of the coke business. Industrial Gases core operating income increased 8% to ¥200.7Bn, supported by productivity improvement activities including DX and optimization of plant operations, which offset a rise in U.S. electricity prices and softer gas demand mainly in Europe and the U.S.
| Segment | FY2024 Sales Revenue (¥Bn) | FY2025 Sales Revenue (¥Bn) | FY2024 Core Op. Income (¥Bn) | FY2025 Core Op. Income (¥Bn) |
|---|---|---|---|---|
| Specialty Materials | 1,071.3 | 1,059.6 | 23.9 | 32.3 |
| Advanced Films & Polymers | 470.8 | 449.6 | 34.0 | 7.4 |
| Advanced Solutions | 350.2 | 343.5 | 1.4 | 22.9 |
| Advanced Composites & Shapes | 250.3 | 266.5 | (11.5) | 2.0 |
| MMA & Derivatives | 417.6 | 351.9 | 35.7 | (1.5) |
| MMA | 307.5 | 245.5 | 32.3 | (8.3) |
| Coating & Additives | 110.1 | 106.4 | 3.4 | 6.8 |
| Basic Materials & Polymers | 986.6 | 790.7 | (14.6) | (4.2) |
| Materials & Polymers | 778.2 | 685.3 | 12.8 | (1.9) |
| Carbon Products | 208.4 | 105.4 | (27.4) | (2.3) |
| Others | 171.0 | 149.3 | (2.3) | (2.3) |
| Chemicals Business (Total) | 2,646.5 | 2,351.5 | 42.7 | 24.3 |
| Industrial Gases | 1,301.1 | 1,352.5 | 186.1 | 200.7 |
| Total Consolidated | 3,947.6 | 3,704.0 | 228.8 | 225.0 |
FY2026 Forecast
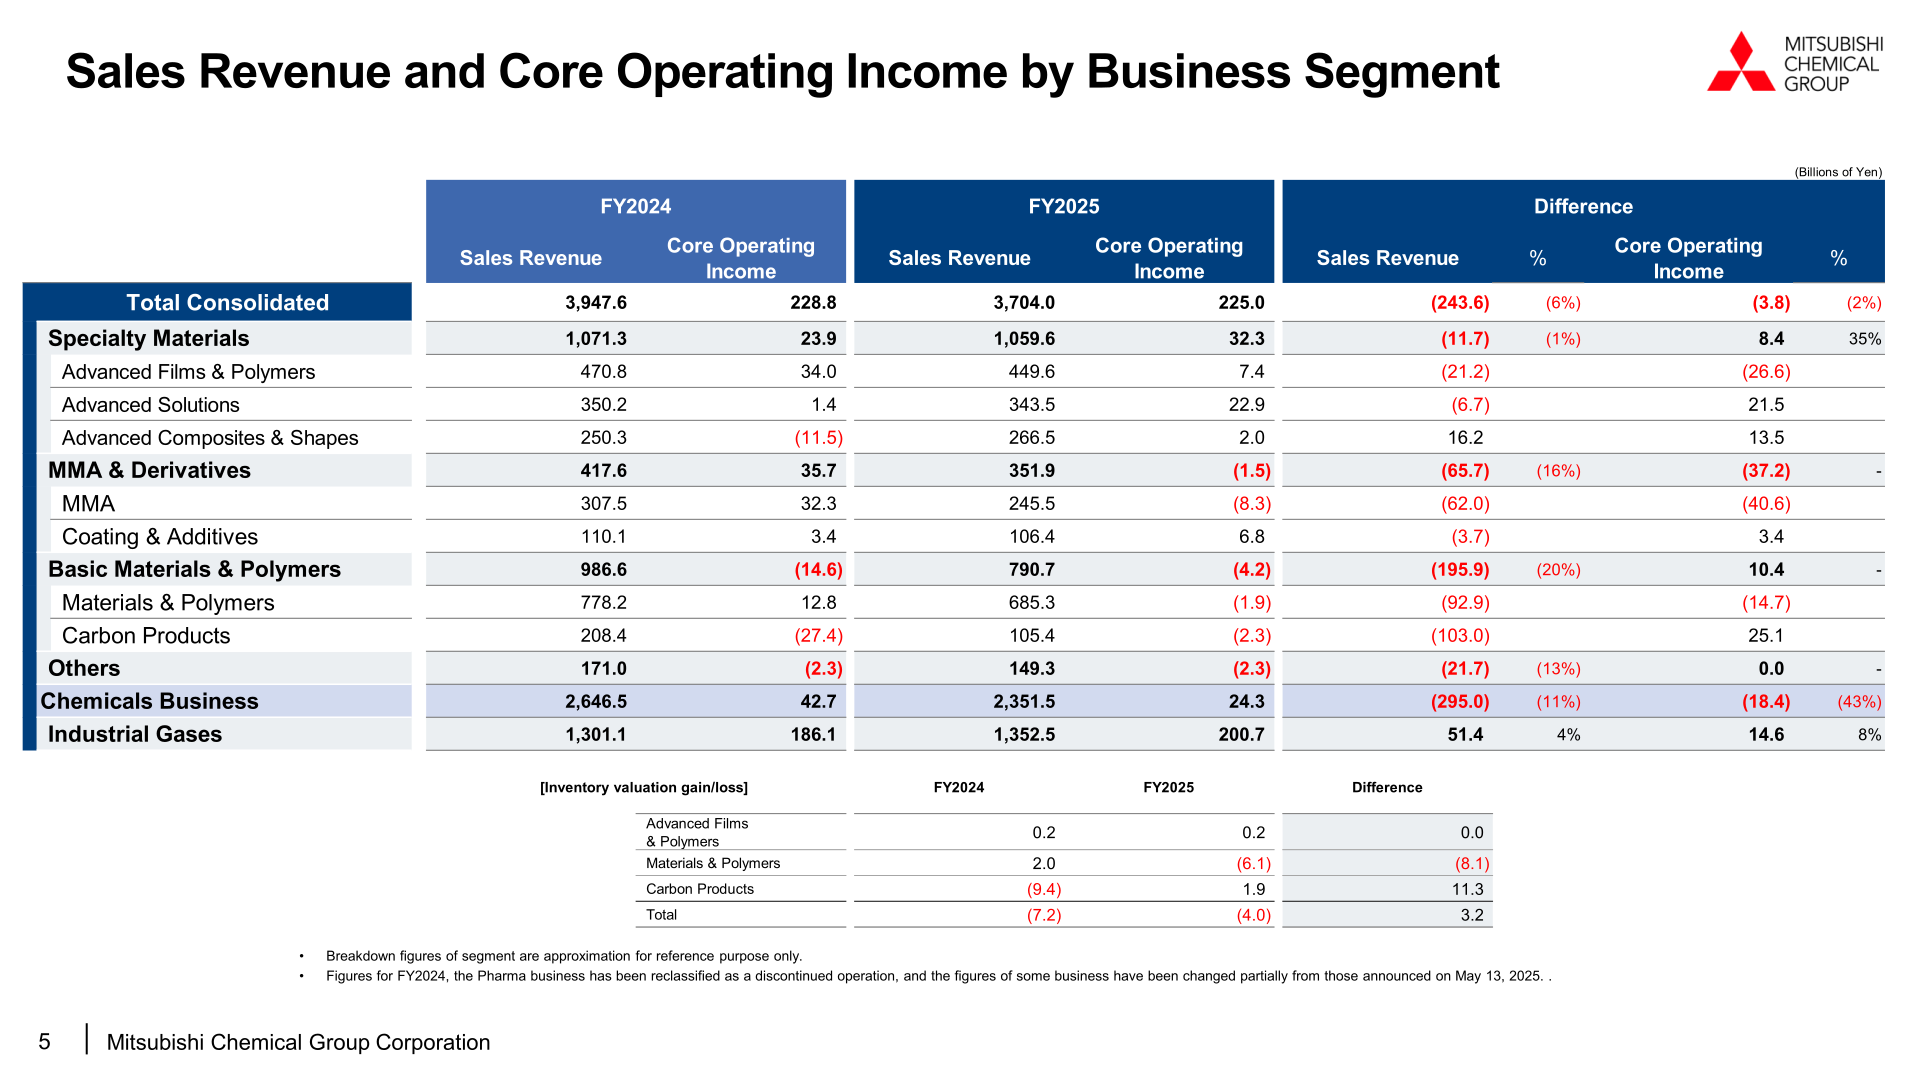
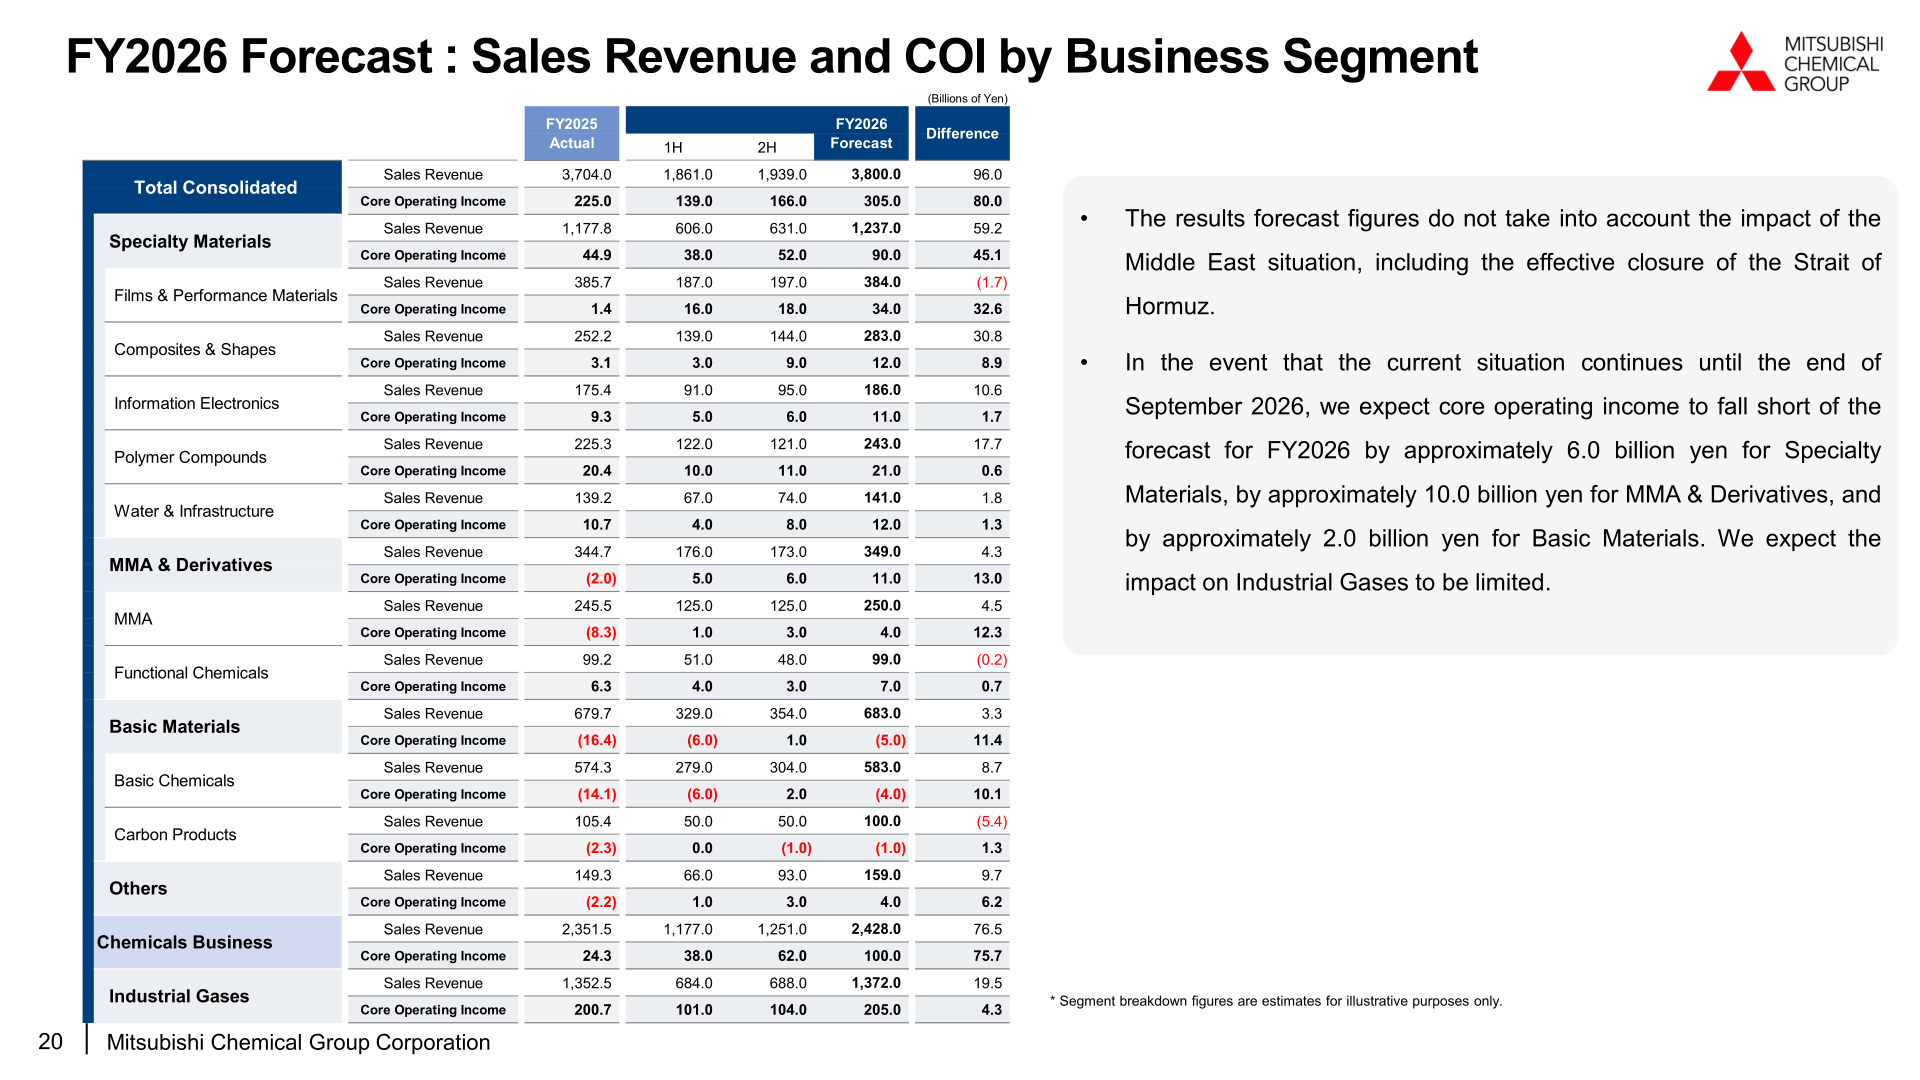
For FY2026, the company forecasts consolidated sales revenue of ¥3,800.0Bn (+3%) and core operating income of ¥305.0Bn (+36%), with operating income of ¥300.0Bn reflecting a narrower special items burden of ¥(5.0)Bn (FY2025: ¥(194.9)Bn). Net income attributable to owners of the parent is forecast at ¥127.0Bn, up ¥115.2Bn from FY2025, when a significant non-recurring loss was recorded in relation to asset optimization. In the Chemicals Business, core operating income is forecast to increase ¥75.7Bn year on year to ¥100.0Bn, primarily due to an increase in sales of products and reduced costs in Specialty Materials as well as the rebound of the bottomed-out MMA monomer market; Industrial Gases core operating income is forecast to increase ¥4.3Bn to ¥205.0Bn on price management and productivity improvement initiatives. The forecast does not take into account the impact of the situation in the Middle East, including the effective closure of the Strait of Hormuz. The company estimates that if the current situation continues until the end of September 2026, consolidated core operating income would fall short of the FY2026 forecast by approximately ¥18.0Bn (approximately ¥6.0Bn for Specialty Materials, ¥10.0Bn for MMA & Derivatives, and ¥2.0Bn for Basic Materials, with limited impact expected on Industrial Gases). Note: figures below use the reporting segments in effect through FY2025; new reporting segments apply from FY2026 (see Segment Results table for the restated FY2026 forecast breakdown).
| Item | FY2025 Actual | FY2026 Forecast | Change |
|---|---|---|---|
| Sales Revenue (¥Bn) | 3,704.0 | 3,800.0 | 96.0 (3%) |
| Core Operating Income (¥Bn) | 225.0 | 305.0 | 80.0 (36%) |
| Special Items (¥Bn) | (194.9) | (5.0) | 189.9 |
| Operating Income (¥Bn) | 30.1 | 300.0 | 269.9 (897%) |
| Financial Income/Expenses (¥Bn) | (29.4) | (30.0) | (0.6) |
| Income before Taxes (¥Bn) | 0.7 | 270.0 | 269.3 |
| Income Taxes (¥Bn) | (17.1) | (70.0) | (52.9) |
| Net Income (Loss) from Continuing Operations (¥Bn) | (16.4) | 200.0 | 216.4 |
| Net Income from Discontinued Operations (¥Bn) | 94.8 | – | (94.8) |
| Net Income (¥Bn) | 78.4 | 200.0 | 121.6 (155%) |
| Net Income Attributable to Owners of the Parent (¥Bn) | 11.8 | 127.0 | 115.2 (974%) |
| Net Income Attributable to Non-Controlling Interests (¥Bn) | 66.6 | 73.0 | 6.4 |
Under the new reporting segments effective from FY2026 (organizational revision as of April 1, 2026), the segment-level forecast breakdown, restated for FY2025 comparison, is as follows.
| Segment | FY2025 Actual Sales Revenue (¥Bn) | FY2026 Forecast Sales Revenue (¥Bn) | FY2025 Actual Core Op. Income (¥Bn) | FY2026 Forecast Core Op. Income (¥Bn) |
|---|---|---|---|---|
| Specialty Materials | 1,177.8 | 1,237.0 | 44.9 | 90.0 |
| Films & Performance Materials | 385.7 | 384.0 | 1.4 | 34.0 |
| Composites & Shapes | 252.2 | 283.0 | 3.1 | 12.0 |
| Information Electronics | 175.4 | 186.0 | 9.3 | 11.0 |
| Polymer Compounds | 225.3 | 243.0 | 20.4 | 21.0 |
| Water & Infrastructure | 139.2 | 141.0 | 10.7 | 12.0 |
| MMA & Derivatives | 344.7 | 349.0 | (2.0) | 11.0 |
| MMA | 245.5 | 250.0 | (8.3) | 4.0 |
| Functional Chemicals | 99.2 | 99.0 | 6.3 | 7.0 |
| Basic Materials | 679.7 | 683.0 | (16.4) | (5.0) |
| Basic Chemicals | 574.3 | 583.0 | (14.1) | (4.0) |
| Carbon Products | 105.4 | 100.0 | (2.3) | (1.0) |
| Others | 149.3 | 159.0 | (2.2) | 4.0 |
| Chemicals Business (Total) | 2,351.5 | 2,428.0 | 24.3 | 100.0 |
| Industrial Gases | 1,352.5 | 1,372.0 | 200.7 | 205.0 |
| Total Consolidated | 3,704.0 | 3,800.0 | 225.0 | 305.0 |
Shareholder Returns
MCG’s basic policy for shareholder returns is to enhance shareholder value by increasing corporate value, while keeping an eye on increasing retained earnings to fund future business activities. The company targets a dividend payout ratio of 35% under the ‘New Medium-Term Management Plan 2029,’ with a potential dividend increase based on further profit growth. The expected FY2025 fiscal year-end dividend per share is ¥16, unchanged from the previously announced forecast, scheduled for approval at the Board of Directors meeting on May 20, 2026. For FY2026, the company forecasts an interim and fiscal year-end dividend per share of ¥16 each, equivalent to the FY2025 year-end dividend, for a forecast full-year FY2026 dividend of ¥32 per share.
| Item | FY2025 | FY2026 Forecast |
|---|---|---|
| Fiscal Year-End Dividend per Share (yen) | 16 | 16 |
| Interim Dividend per Share (yen) | – | 16 |
| Annual Dividend per Share (yen) | – | 32 |
| Target Dividend Payout Ratio | – | 35% (New Medium-Term Management Plan 2029) |
Medium-Term Plan / Topics
Under the ‘three disciplined approaches in business operations’ (pricing policy, investment decision making, and asset optimization), the company states these measures contributed ¥58.0Bn to core operating income in FY2025 and are targeted to contribute ¥48.0Bn in FY2026. On asset optimization, against a Medium-Term Management Plan (FY24-29) target of approximately 400 billion yen in business restructuring and divestitures for the Chemicals Business, the company states it has executed a larger-than-planned scale of these measures over the past two years (approximately 490 billion yen in the Chemicals Business, plus approximately 460 billion yen related to Pharmaceuticals/Mitsubishi Tanabe Pharma), including the decisions to withdraw from the coke and carbon materials business (Kagawa) and Kansai Coke and Chemicals, thereby laying the groundwork for growth starting next fiscal year. On growth investment, the company is advancing Chemicals Business projects for commercial operation across FY25-FY28, including a new facility for chemical recycling of waste plastic by oilification (Ibaraki), a new production facility for EUV dry resist precursor (US), and capacity increases for natural anode materials for automotive lithium-ion batteries (Kagawa) and SoarnoL (UK), among others.
This article is an analysis based on publicly available information and is not a recommendation to buy or sell any specific securities. Investment decisions are your own responsibility.
![[Obayashi] Investors’ Guide 2026 — The Complete 24-Article Breakdown](https://japan-equity.com/wp-content/uploads/2026/07/hub_cover-1024x1024.png)
![[Obayashi] IR & SR Policy — Feeding Dialogue Back into Management](https://japan-equity.com/wp-content/uploads/2026/07/p32_sq-1024x1024.jpg)
![[Obayashi] Real Estate Development — 18.7% Margin, ¥287.7bn Unrealized Gains](https://japan-equity.com/wp-content/uploads/2026/07/p20_sq-1024x1024.jpg)
![[Obayashi] Domestic Civil Engineering — Resilience Spending Supports 9.6% Margin](https://japan-equity.com/wp-content/uploads/2026/07/p11_sq-1024x1024.jpg)
![[Obayashi] Share Price & External Ratings — vs TOPIX, ESG Index Inclusion](https://japan-equity.com/wp-content/uploads/2026/07/p40_sq-1024x1024.jpg)
![[Construction] ¥75.5tn Investment, Shrinking Workforce — Big-5 Market Share](https://japan-equity.com/wp-content/uploads/2026/07/p12_sq-1024x1024.jpg)



![[Obayashi] Capital Policy & Shareholder Returns — ROE 10%+, DOE ~5%, ¥100bn Buyback](https://japan-equity.com/wp-content/uploads/2026/07/p27_sq-1024x1024.jpg)
![[Obayashi] Reducing Cross-Shareholdings — ¥285.2bn Sold in Five Years](https://japan-equity.com/wp-content/uploads/2026/07/p29_sq-1024x1024.jpg)
![[Obayashi] ¥750bn Investment Plan — ¥300bn to Development, ¥190bn to Tech/DX](https://japan-equity.com/wp-content/uploads/2026/07/p30_sq-1024x1024.jpg)
![[Obayashi] MTP2022 KPIs — Operating Profit ~2x Target, ROE 14.4%](https://japan-equity.com/wp-content/uploads/2026/07/p25_sq-1024x1024.jpg)
![[Obayashi] Cash Allocation — ¥420bn Investment CF Over Five Years](https://japan-equity.com/wp-content/uploads/2026/07/p26_sq-1024x1024.jpg)
![[Obayashi] Green Energy — 44 Plants, 344MW, and the Green Hydrogen Challenge](https://japan-equity.com/wp-content/uploads/2026/07/p21_sq-1024x1024.jpg)
![[Obayashi] Tackling the Labor Shortage — Robotics Construction®](https://japan-equity.com/wp-content/uploads/2026/07/p14_sq-1024x1024.jpg)
