

This article is based on publicly available IR materials and is not a recommendation to buy or sell any specific securities.
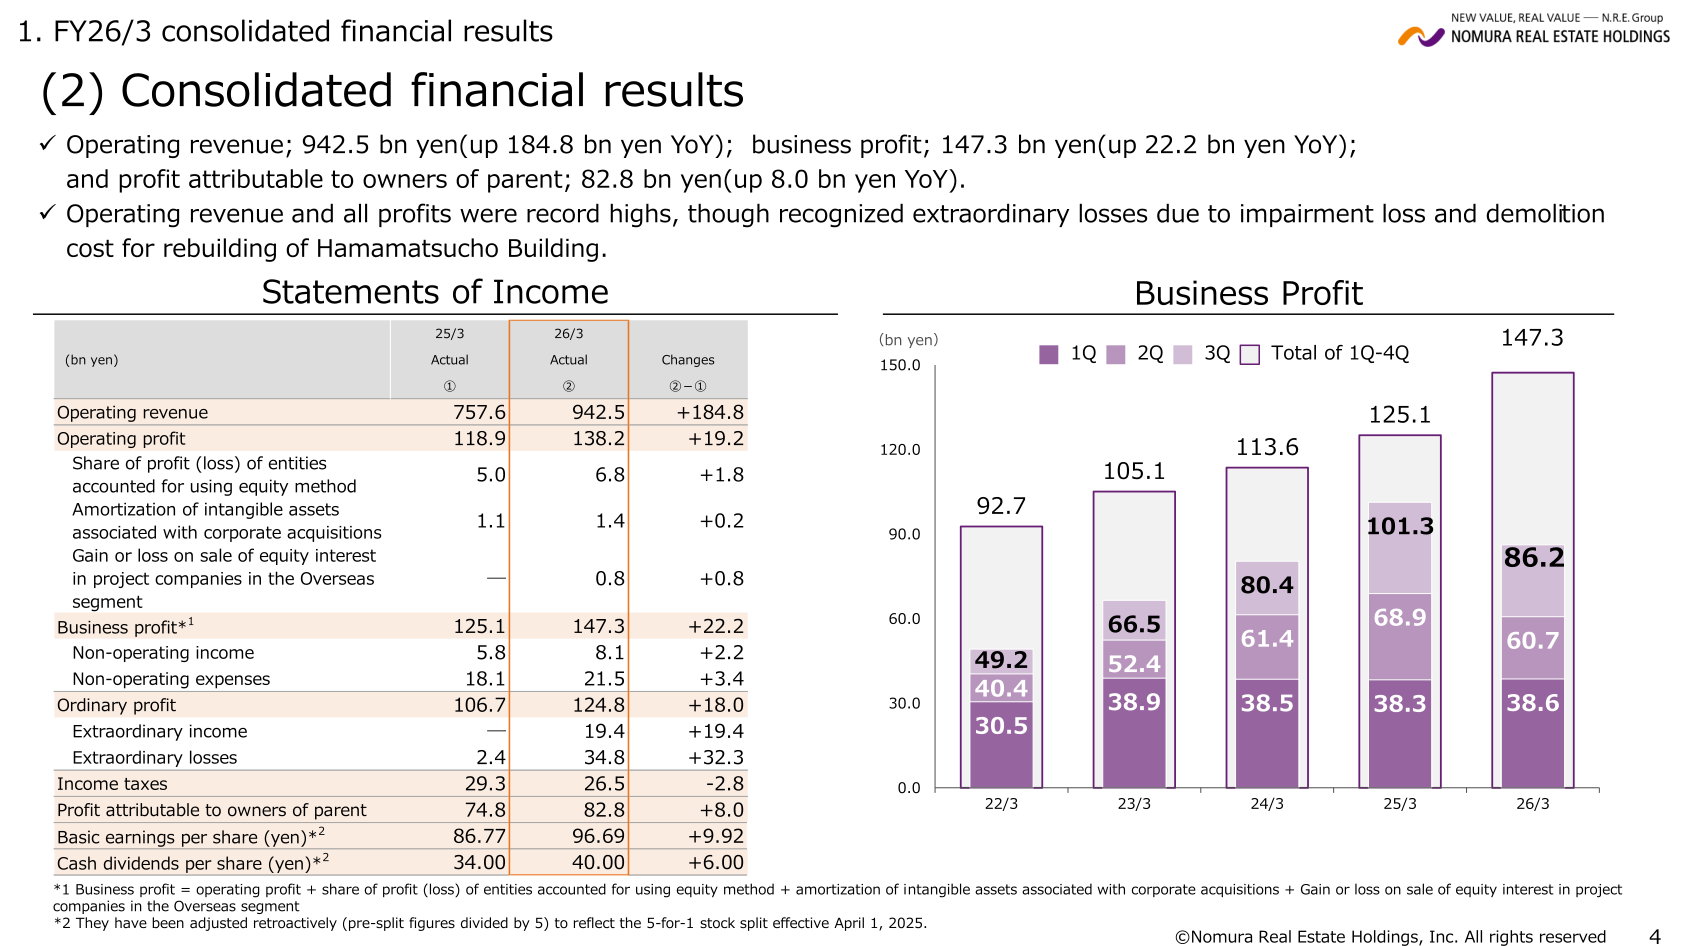
Note: This site labels the fiscal year ended March 31, 2026 as FY2025, while the source materials label it FY26/3; figures below follow the source’s own period labels. Nomura Real Estate Holdings, Inc. reported record operating revenue of 942.5 bn yen (up 184.8 bn yen, or 24.4% YoY) and record business profit of 147.3 bn yen (up 22.2 bn yen, or 17.8% YoY) for FY26/3, with profit attributable to owners of parent of 82.8 bn yen (up 8.0 bn yen, or 10.8% YoY). Annual dividend per share increased for the 14th consecutive year to 40.0 yen (up 6.0 yen YoY), with a dividend payout ratio of 41.4%.
Consolidated Results (Full-Year Actual)
Operating revenue and all profit items reached record highs. Business profit is defined as operating profit plus share of profit (loss) of entities accounted for using the equity method, plus amortization of intangible assets associated with corporate acquisitions, plus gain or loss on sale of equity interest in project companies in the Overseas segment. The Company recognized extraordinary losses of 34.8 bn yen (up 32.3 bn yen YoY) due to an impairment loss and demolition cost for the rebuilding of the Hamamatsucho Building, alongside extraordinary income of 19.4 bn yen.
| Item | 26/3 (Actual) | 25/3 (Actual) | Change |
|---|---|---|---|
| Operating revenue (bn yen) | 942.5 | 757.6 | +184.8 |
| Operating profit (bn yen) | 138.2 | 118.9 | +19.2 |
| Business profit* (bn yen) | 147.3 | 125.1 | +22.2 |
| Ordinary profit (bn yen) | 124.8 | 106.7 | +18.0 |
| Extraordinary income (bn yen) | 19.4 | ― | +19.4 |
| Extraordinary losses (bn yen) | 34.8 | 2.4 | +32.3 |
| Profit attributable to owners of parent (bn yen) | 82.8 | 74.8 | +8.0 |
| Basic earnings per share (yen) | 96.69 | 86.77 | +9.92 |
| Cash dividends per share (yen) | 40.00 | 34.00 | +6.00 |
Segment Results
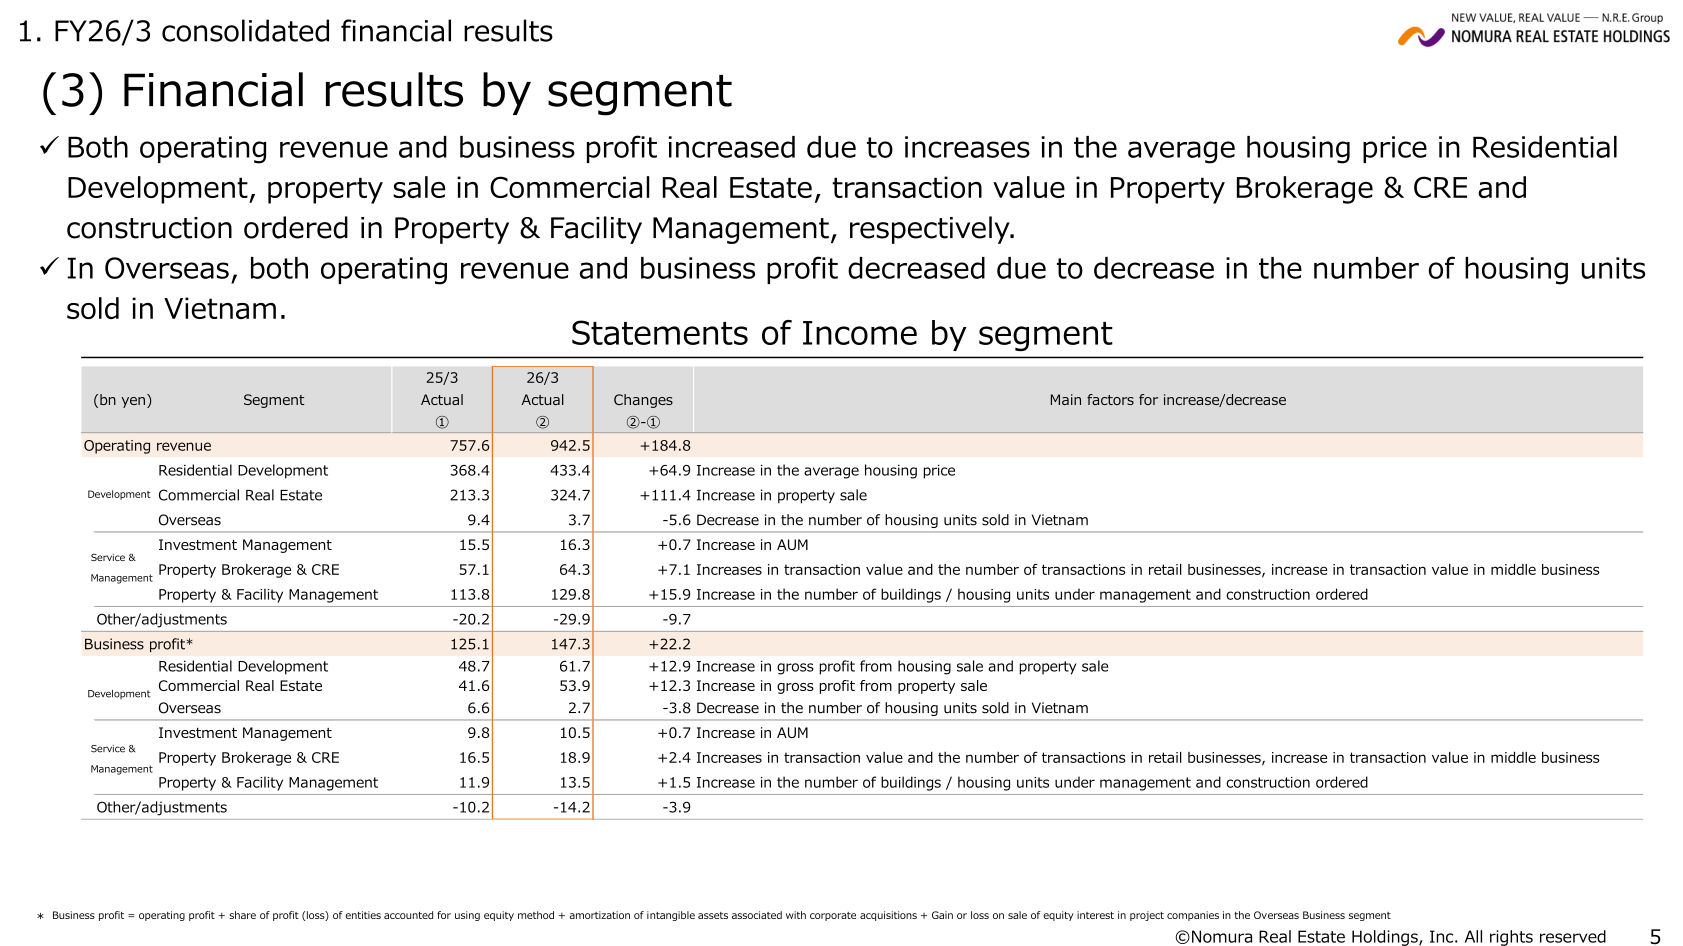
Both operating revenue and business profit increased in Residential Development, Commercial Real Estate, Investment Management, Property Brokerage & CRE, and Property & Facility Management, due to increases in the average housing price, property sale, transaction value in Property Brokerage & CRE, and construction ordered in Property & Facility Management, respectively. In Overseas, both operating revenue and business profit decreased due to a decrease in the number of housing units sold in Vietnam.
| Segment | Operating Revenue 26/3 | Operating Revenue 25/3 | Change |
|---|---|---|---|
| Residential Development | 433.4 | 368.4 | +64.9 |
| Commercial Real Estate | 324.7 | 213.3 | +111.4 |
| Overseas | 3.7 | 9.4 | -5.6 |
| Investment Management | 16.3 | 15.5 | +0.7 |
| Property Brokerage & CRE | 64.3 | 57.1 | +7.1 |
| Property & Facility Management | 129.8 | 113.8 | +15.9 |
| Segment | Business Profit 26/3 | Business Profit 25/3 | Change |
|---|---|---|---|
| Residential Development | 61.7 | 48.7 | +12.9 |
| Commercial Real Estate | 53.9 | 41.6 | +12.3 |
| Overseas | 2.7 | 6.6 | -3.8 |
| Investment Management | 10.5 | 9.8 | +0.7 |
| Property Brokerage & CRE | 18.9 | 16.5 | +2.4 |
| Property & Facility Management | 13.5 | 11.9 | +1.5 |
FY2026 Forecast
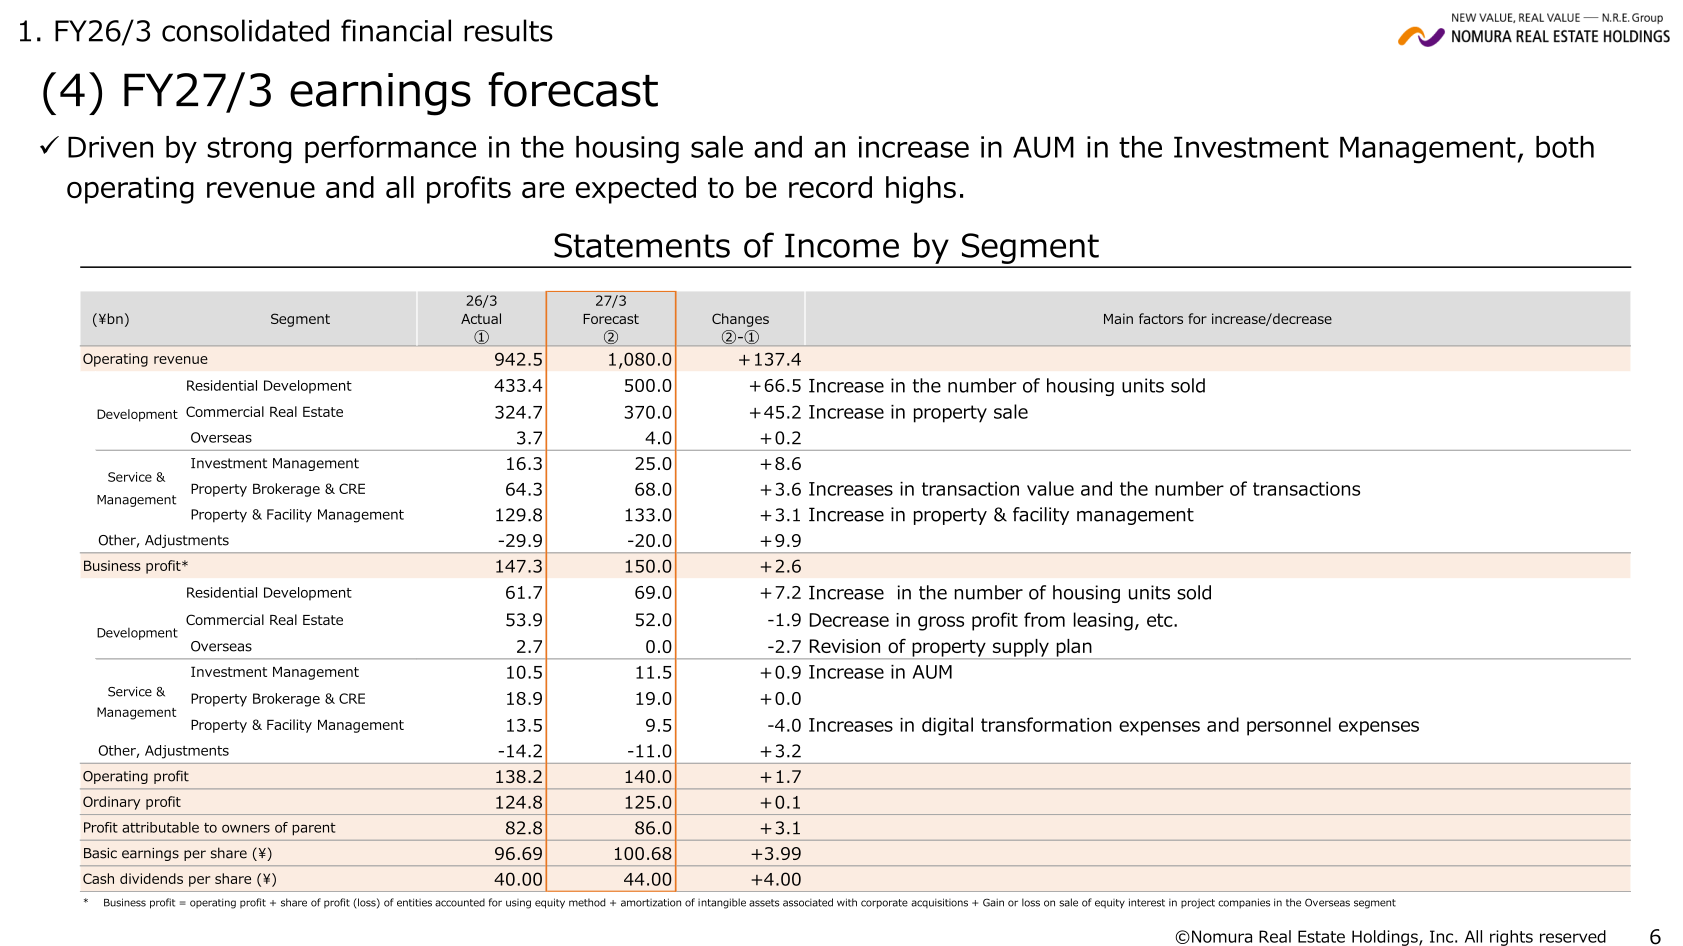
Driven by strong performance in housing sale and an increase in assets under management (AUM) in Investment Management, both operating revenue and all profit items are expected to reach record highs in FY27/3 (the site’s FY2026).
| Item | 27/3 (Forecast) | 26/3 (Actual) | Change |
|---|---|---|---|
| Operating revenue (bn yen) | 1,080.0 | 942.5 | +137.4 |
| Operating profit (bn yen) | 140.0 | 138.2 | +1.7 |
| Business profit* (bn yen) | 150.0 | 147.3 | +2.6 |
| Ordinary profit (bn yen) | 125.0 | 124.8 | +0.1 |
| Profit attributable to owners of parent (bn yen) | 86.0 | 82.8 | +3.1 |
| Basic earnings per share (yen) | 100.68 | 96.69 | +3.99 |
| Cash dividends per share (yen) | 44.00 | 40.00 | +4.00 |
| Segment | Operating Revenue 27/3 (Forecast) | Business Profit 27/3 (Forecast) |
|---|---|---|
| Residential Development | 500.0 | 69.0 |
| Commercial Real Estate | 370.0 | 52.0 |
| Overseas | 4.0 | 0.0 |
| Investment Management | 25.0 | 11.5 |
| Property Brokerage & CRE | 68.0 | 19.0 |
| Property & Facility Management | 133.0 | 9.5 |
Shareholder Returns
In FY26/3, the dividend was set at 40.0 yen as forecast, with a dividend payout ratio of 41.4%, exceeding the previous year’s level. For FY27/3, the annual dividend is expected to be 44.0 yen per share (up 4.0 yen YoY), marking the 15th consecutive year of dividend growth, with a dividend payout ratio of 43.7%. Under the Company’s long-term management policy financial indicators (FY26/3 to around 2030), the total return ratio target is 40-50% and the DOE (lower limit) is 4%.
| Item | 26/3 (Actual) | 27/3 (Forecast) |
|---|---|---|
| Dividend per share (yen) | 40.00 | 44.00 |
| Dividend payout ratio | 41.4% | 43.7% |
| Total return ratio | 41.4% | ― |
Medium-Term Plan / Topics
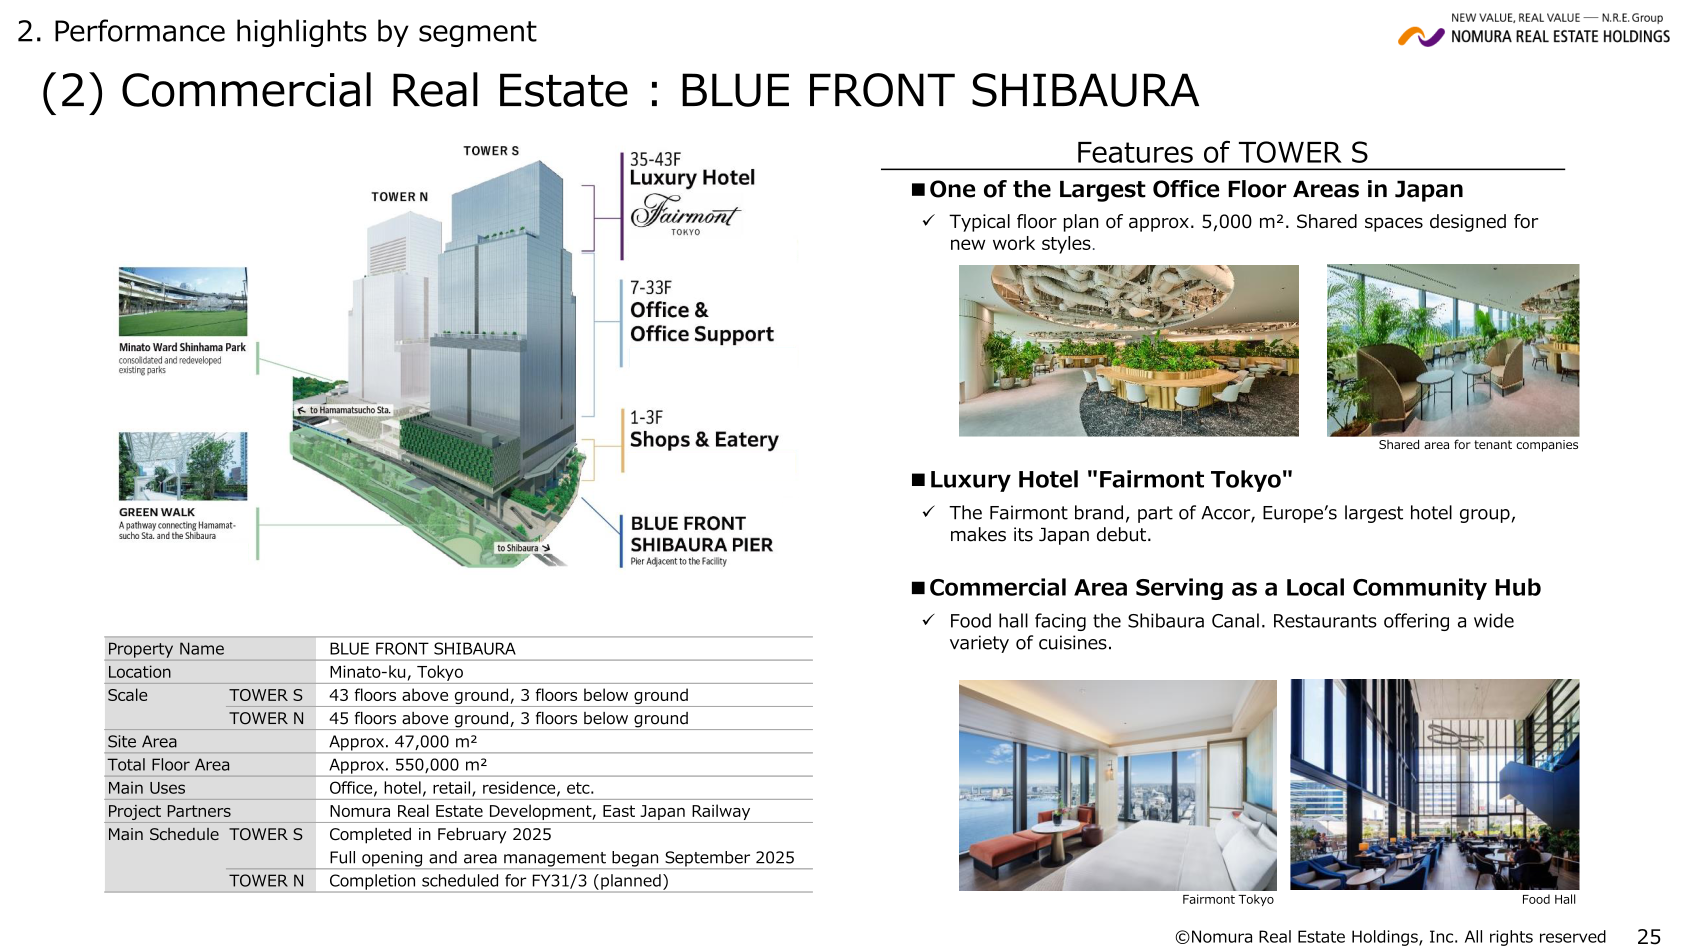
Under the three-year business plan (FY26/3-FY28/3) disclosed on April 24, 2025, the Company’s long-term management policy financial indicators (FY26/3 to around 2030) are ROA of 5% or higher, ROE of 10% or higher, an average annual business profit growth rate at the 8% level, and a shareholders’ equity ratio at the 30% level. FY26/3 results exceeded the ROA and ROE targets, with ROA at 5.4% and ROE at 10.7%, and business profit growth of +17.8% YoY against the plan’s 8% level target; cumulative investment and recovery progress against the FY26/3-FY28/3 plan exceeded 30%. BLUE FRONT SHIBAURA TOWER S, featuring one of the largest office floor areas in Japan and the Japan debut of the Fairmont hotel brand, has been fully leased, with full occupancy scheduled for September 2026.
This article is an analysis based on publicly available information and is not a recommendation to buy or sell any specific securities. Investment decisions are your own responsibility.
![[Obayashi] Investors’ Guide 2026 — The Complete 24-Article Breakdown](https://japan-equity.com/wp-content/uploads/2026/07/hub_cover-1024x1024.png)
![[Obayashi] IR & SR Policy — Feeding Dialogue Back into Management](https://japan-equity.com/wp-content/uploads/2026/07/p32_sq-1024x1024.jpg)
![[Obayashi] Real Estate Development — 18.7% Margin, ¥287.7bn Unrealized Gains](https://japan-equity.com/wp-content/uploads/2026/07/p20_sq-1024x1024.jpg)
![[Obayashi] Domestic Civil Engineering — Resilience Spending Supports 9.6% Margin](https://japan-equity.com/wp-content/uploads/2026/07/p11_sq-1024x1024.jpg)
![[Obayashi] Share Price & External Ratings — vs TOPIX, ESG Index Inclusion](https://japan-equity.com/wp-content/uploads/2026/07/p40_sq-1024x1024.jpg)
![[Construction] ¥75.5tn Investment, Shrinking Workforce — Big-5 Market Share](https://japan-equity.com/wp-content/uploads/2026/07/p12_sq-1024x1024.jpg)



![[Obayashi] Capital Policy & Shareholder Returns — ROE 10%+, DOE ~5%, ¥100bn Buyback](https://japan-equity.com/wp-content/uploads/2026/07/p27_sq-1024x1024.jpg)
![[Obayashi] Reducing Cross-Shareholdings — ¥285.2bn Sold in Five Years](https://japan-equity.com/wp-content/uploads/2026/07/p29_sq-1024x1024.jpg)
![[Obayashi] ¥750bn Investment Plan — ¥300bn to Development, ¥190bn to Tech/DX](https://japan-equity.com/wp-content/uploads/2026/07/p30_sq-1024x1024.jpg)
![[Obayashi] MTP2022 KPIs — Operating Profit ~2x Target, ROE 14.4%](https://japan-equity.com/wp-content/uploads/2026/07/p25_sq-1024x1024.jpg)
![[Obayashi] Cash Allocation — ¥420bn Investment CF Over Five Years](https://japan-equity.com/wp-content/uploads/2026/07/p26_sq-1024x1024.jpg)
![[Obayashi] Green Energy — 44 Plants, 344MW, and the Green Hydrogen Challenge](https://japan-equity.com/wp-content/uploads/2026/07/p21_sq-1024x1024.jpg)
![[Obayashi] Tackling the Labor Shortage — Robotics Construction®](https://japan-equity.com/wp-content/uploads/2026/07/p14_sq-1024x1024.jpg)
