
This article is based on publicly available IR materials and is not a recommendation to buy or sell any specific securities.
Note: JGC Holdings labels the fiscal year ended March 31, 2026 as “FY2025” in its own materials (FY2025 = April 1, 2025 – March 31, 2026), consistent with this publication’s convention of designating fiscal years ending in March by the calendar year in which they begin.
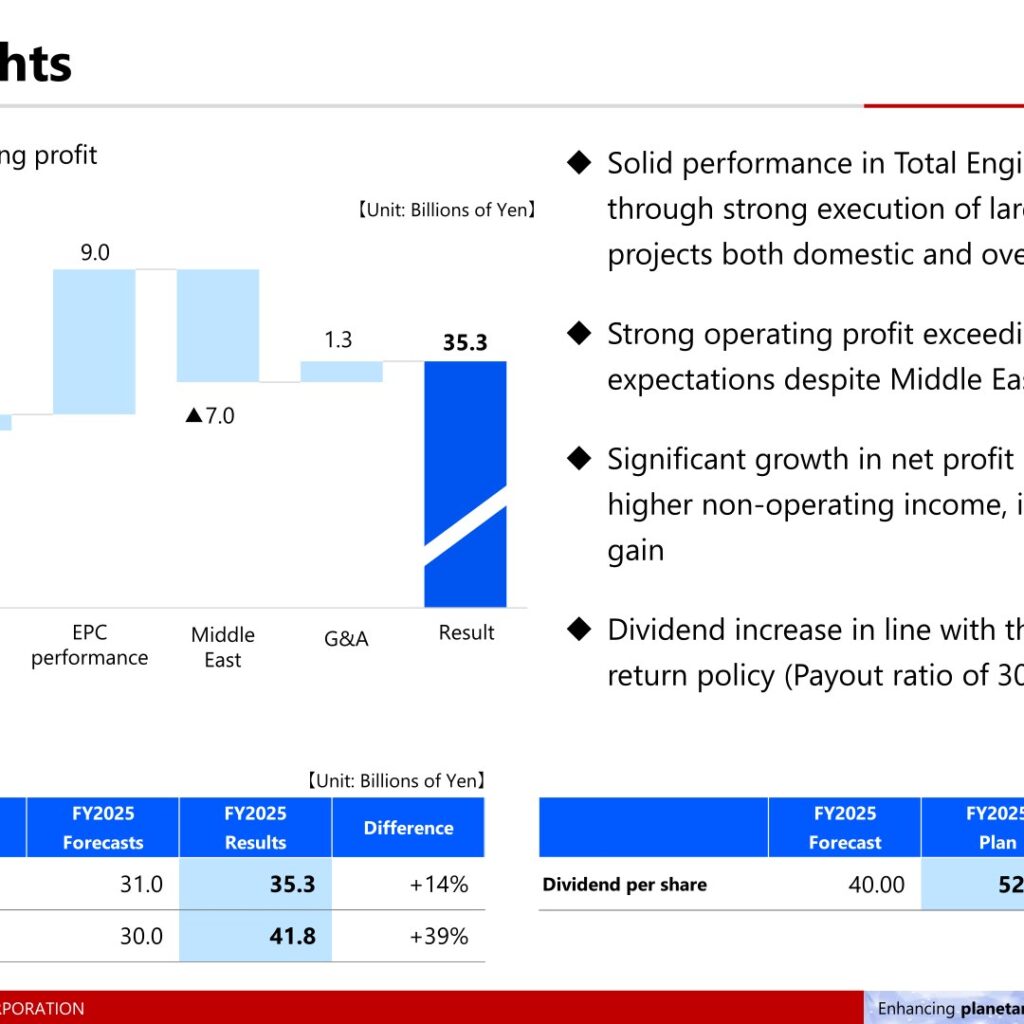
JGC Holdings Corporation reported a strong turnaround in FY2025, with operating profit of ¥35.3 billion exceeding the company’s own forecast of ¥31.0 billion despite ongoing Middle East conflict risks, on the back of solid execution of large-scale EPC projects both domestically and overseas in the Total Engineering business. Profit attributable to owners of parent surged to ¥41.8 billion, up 39% from the FY2025 forecast of ¥30.0 billion, driven mainly by higher non-operating income including an FX gain. In line with its shareholder return policy, the company raised its dividend, resulting in a payout ratio of 30% for FY2025.
Middle East Situation
The Middle East accounted for 45% of JGC’s order backlog, with multiple major large-scale projects under execution and ongoing stakeholder safety measures in place. Key challenges include safety assurance, temporary evacuation and site access restrictions, and personnel and logistics constraints, which carry risks such as safety-related costs, schedule delay costs, alternative transportation route costs, and raw material procurement challenges within domestic manufacturing. In FY2025 results, the company recognized a risk contingency budget assuming easing tensions in the first half of 2026, resulting in an approximate 1% decline in profit margin. For the FY2026 outlook, the company expects an impact from progress delays in addition to the risk contingency budget, resulting in an approximate 60 billion yen revenue reduction and margin deterioration, as well as an impact from raw material procurement within the manufacturing business.
Consolidated Results (Full-Year Actual)
Net sales decreased 13.1% year on year to ¥745.2 billion, exceeding the company’s FY2025 forecast of ¥740.0 billion by ¥5.2 billion. Profitability improved sharply across every line: operating profit turned positive at ¥35.3 billion versus an operating loss of ¥11.4 billion in FY2024 (an improvement of ¥46.8 billion), ordinary profit rose to ¥58.1 billion from ¥11.3 billion (+414.0%), and profit attributable to owners of parent rose to ¥41.8 billion from a loss of ¥0.3 billion in FY2024. Earnings per share was ¥173.06, versus a loss per share of ¥1.65 in FY2024, and return on equity improved to 10.2% from △0.1%. All profit lines exceeded the company’s FY2025 forecasts.
| Item | FY2024 | FY2025 | YoY Change |
|---|---|---|---|
| Net sales | 858.0 | 745.2 | △112.8 (△13.1%) |
| Gross profit | 18.9 | 64.1 | +45.2 (+238.9%) |
| Profit ratio | 2.2% | 8.6% | +6.4pt |
| Operating profit/loss(△) | △11.4 | 35.3 | +46.8 |
| Ordinary profit | 11.3 | 58.1 | +46.8 (+414.0%) |
| Profit/loss(△) attributable to owners of parent | △0.3 | 41.8 | +42.2 |
| Earnings per share | △¥1.65 | ¥173.06 | – |
| Return on equity | △0.1% | 10.2% | – |
Segment Results
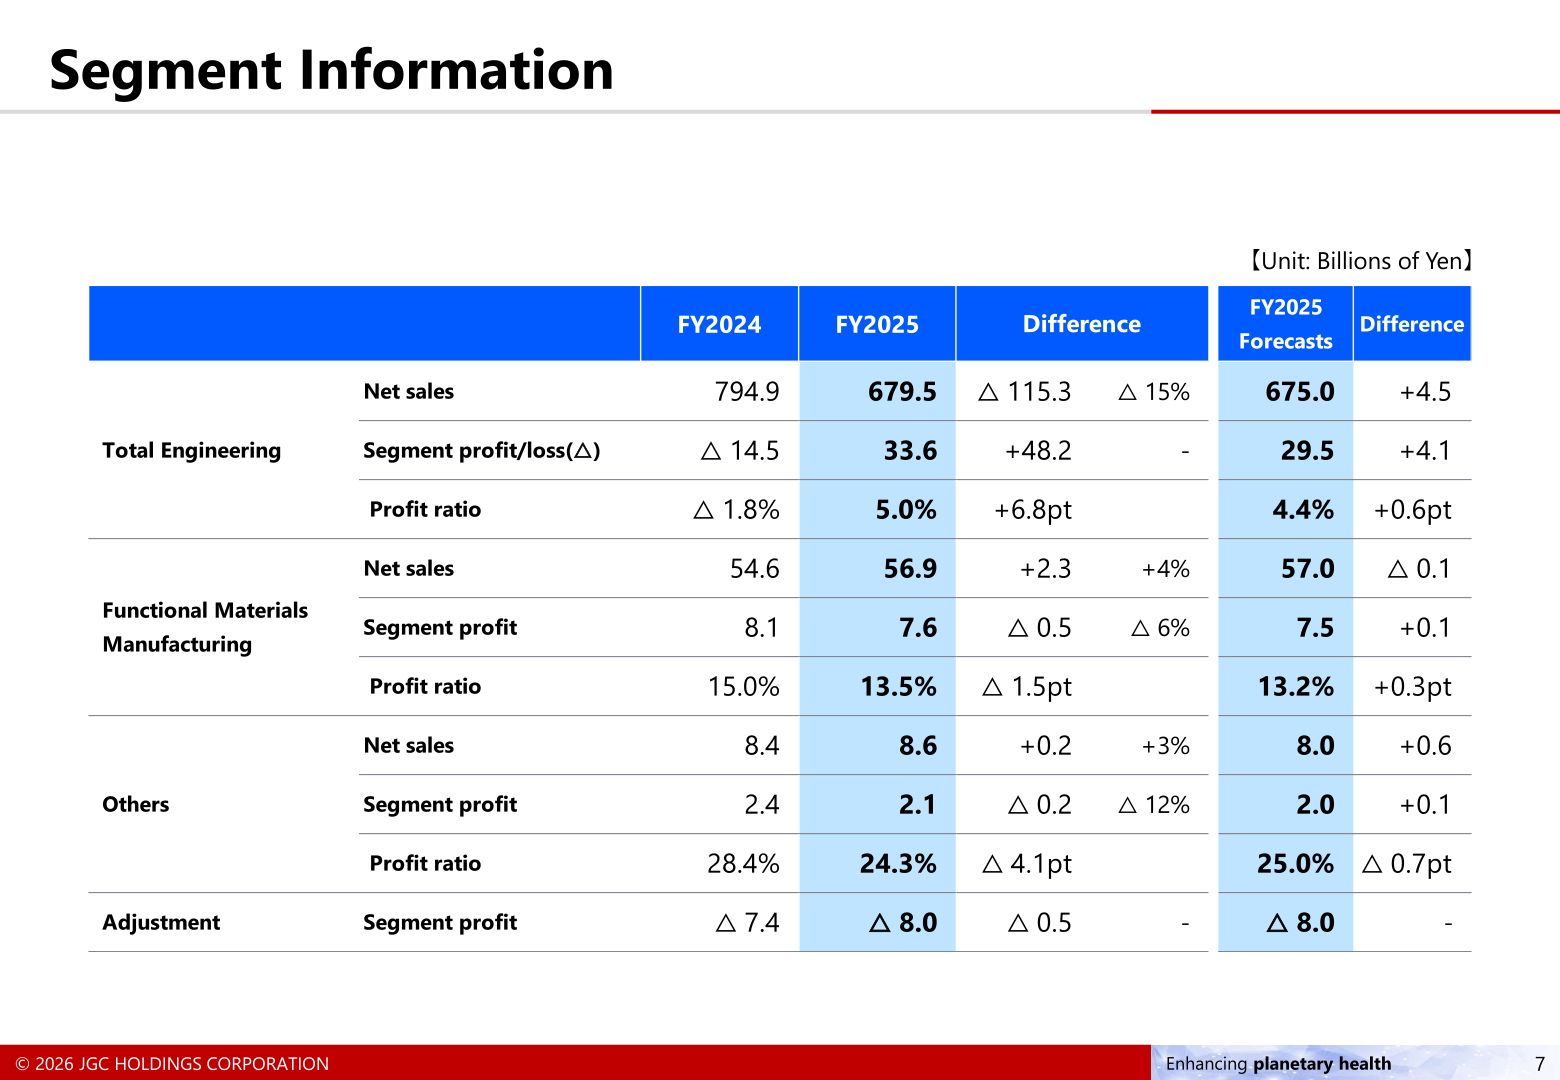
In the Total Engineering segment, net sales decreased 15% year on year to ¥679.5 billion, while segment profit turned positive at ¥33.6 billion versus a segment loss of ¥14.5 billion in FY2024, an improvement of ¥48.2 billion, exceeding the segment’s own FY2025 forecast of ¥29.5 billion. In Functional Materials Manufacturing, net sales rose 4% to ¥56.9 billion, while segment profit decreased 6% to ¥7.6 billion, with the profit ratio declining 1.5pt to 13.5%. In the Others segment, net sales rose 3% to ¥8.6 billion, while segment profit decreased 12% to ¥2.1 billion. The Adjustment segment profit was △¥8.0 billion, versus △¥7.4 billion in FY2024.
| Segment | Metric | FY2024 | FY2025 | YoY Change |
|---|---|---|---|---|
| Total Engineering | Net sales | 794.9 | 679.5 | △115.3 (△15%) |
| Total Engineering | Segment profit/loss(△) | △14.5 | 33.6 | +48.2 |
| Total Engineering | Profit ratio | △1.8% | 5.0% | +6.8pt |
| Functional Materials Manufacturing | Net sales | 54.6 | 56.9 | +2.3 (+4%) |
| Functional Materials Manufacturing | Segment profit | 8.1 | 7.6 | △0.5 (△6%) |
| Functional Materials Manufacturing | Profit ratio | 15.0% | 13.5% | △1.5pt |
| Others | Net sales | 8.4 | 8.6 | +0.2 (+3%) |
| Others | Segment profit | 2.4 | 2.1 | △0.2 (△12%) |
| Others | Profit ratio | 28.4% | 24.3% | △4.1pt |
| Adjustment | Segment profit | △7.4 | △8.0 | △0.5 |
New Contracts and Order Backlog
New contracts in the Total Engineering segment totaled ¥409.2 billion in FY2025, down from ¥922.5 billion in FY2024, comprising ¥250.4 billion overseas and ¥158.7 billion domestic. Major new contracts secured during the period included an LNG FEED contract in Canada, an FLNG preliminary contract in Mozambique, rocket testing and fuel facilities in Japan, renovation of pharmaceutical plants in Japan, expansion of the Gas Oil Separation Unit in Saudi Arabia, a renovation project for chemical plants in Japan, and food-related factories in Japan. As of March 31, 2026, major outstanding contracts included large-scale EGR/CCUS onshore facilities in Indonesia and large-scale low-carbon LNG plants in the UAE (each over ¥100 billion), the expansion of the Gas Oil Separation Unit in Saudi Arabia (over ¥50 billion), and the Gas Oil Separation Unit in Saudi Arabia, Oil Refinery Modernization in Iraq, Nearshore Floating LNG Plant in Malaysia, and Dew Point Control Unit in Saudi Arabia (each over ¥30 billion). By business area, outstanding contracts (Total Engineering, ¥1,155.5 billion) broke down as LNG 30%, Oil & Gas 25%, Energy Transition Others 31%, Chemical 4%, Clean Energy 2%, Urban Infrastructure & Industrial & Others 1%, and Healthcare & Life Science 7%. By region, the following table shows new contracts, net sales, and outstanding contracts for the Total Engineering segment.
| Region | New Contracts (¥bn, %) | Net Sales (¥bn, %) | Outstanding Contracts (¥bn, %) |
|---|---|---|---|
| Japan | 158.7 (38.8%) | 145.2 (21.4%) | 145.3 (12.6%) |
| Asia | 40.8 (10.0%) | 122.4 (18.0%) | 432.5 (37.4%) |
| Middle East | 107.5 (26.3%) | 240.2 (35.4%) | 515.8 (44.6%) |
| Africa | 88.3 (21.6%) | 54.6 (8.0%) | 37.9 (3.3%) |
| Americas & Others | 13.7 (3.3%) | 117.0 (17.2%) | 23.8 (2.1%) |
| Total (Total Engineering) | 409.2 (100.0%) | 679.5 (100.0%) | 1,155.5 (100.0%) |
FY2026 Forecast
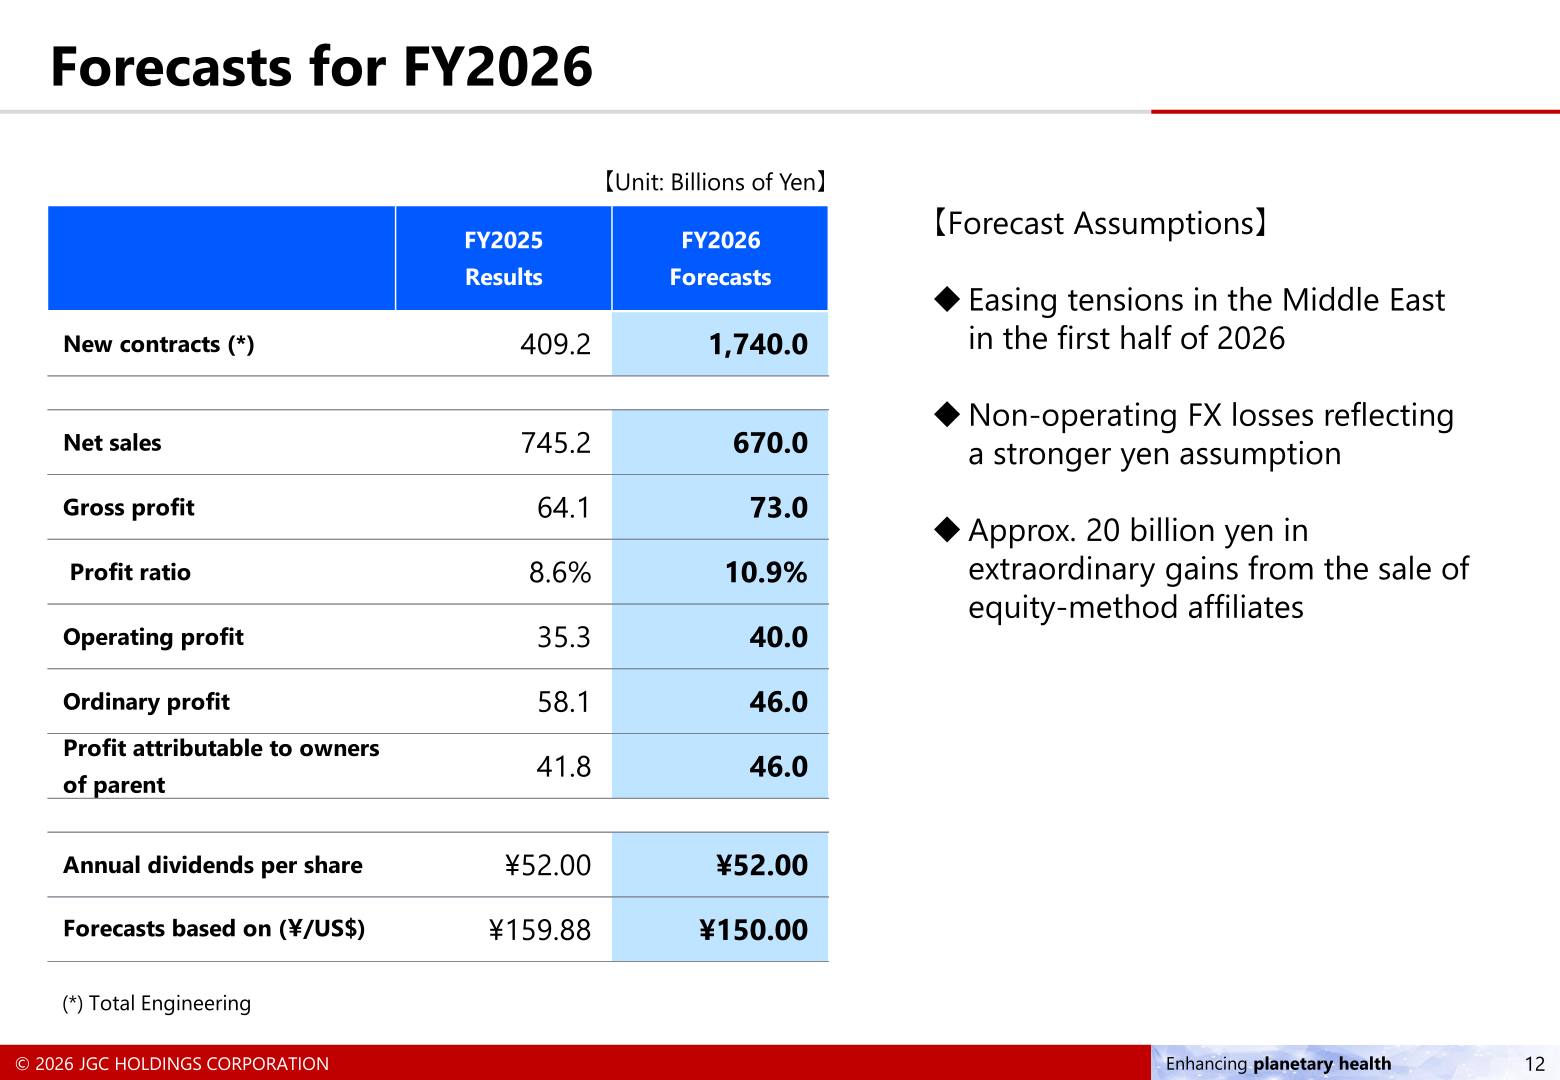
For FY2026, JGC forecasts a sharp rebound in new contracts (Total Engineering) to ¥1,740.0 billion from ¥409.2 billion in FY2025. Consolidated net sales are forecast to decrease to ¥670.0 billion from ¥745.2 billion, while gross profit is forecast to rise to ¥73.0 billion (a profit ratio of 10.9%, up from 8.6%). Operating profit is forecast at ¥40.0 billion, ordinary profit at ¥46.0 billion, and profit attributable to owners of parent at ¥46.0 billion. Annual dividends per share are forecast to be maintained at ¥52.00, unchanged from FY2025. Forecast assumptions include easing tensions in the Middle East in the first half of 2026, non-operating FX losses reflecting a stronger yen assumption (forecast exchange rate of ¥150.00/US$ versus ¥159.88 in FY2025), and approximately 20 billion yen in extraordinary gains from the sale of equity-method affiliates.
| Item | FY2025 Results | FY2026 Forecast |
|---|---|---|
| New contracts (Total Engineering) | 409.2 | 1,740.0 |
| Net sales | 745.2 | 670.0 |
| Gross profit | 64.1 | 73.0 |
| Profit ratio | 8.6% | 10.9% |
| Operating profit | 35.3 | 40.0 |
| Ordinary profit | 58.1 | 46.0 |
| Profit attributable to owners of parent | 41.8 | 46.0 |
| Annual dividends per share | ¥52.00 | ¥52.00 |
| Forecast exchange rate (¥/US$) | ¥159.88 | ¥150.00 |
By segment, FY2026 forecasts call for Total Engineering net sales of ¥606.0 billion (down from ¥679.5 billion) and segment profit of ¥41.4 billion (up from ¥33.6 billion), lifting the profit ratio to 6.8% from 5.0%. Functional Materials Manufacturing is forecast to post net sales of ¥55.5 billion and segment profit of ¥6.6 billion, with the profit ratio declining to 11.9% from 13.5%. The Others segment is forecast to post net sales of ¥8.5 billion and segment profit of ¥2.0 billion, with the profit ratio declining to 23.5% from 24.3%. The Adjustment segment profit is forecast at △¥10.0 billion, versus △¥8.0 billion in FY2025.
| Segment | Metric | FY2025 Results | FY2026 Forecast |
|---|---|---|---|
| Total Engineering | Net sales | 679.5 | 606.0 |
| Total Engineering | Segment profit | 33.6 | 41.4 |
| Total Engineering | Profit ratio | 5.0% | 6.8% |
| Functional Materials Manufacturing | Net sales | 56.9 | 55.5 |
| Functional Materials Manufacturing | Segment profit | 7.6 | 6.6 |
| Functional Materials Manufacturing | Profit ratio | 13.5% | 11.9% |
| Others | Net sales | 8.6 | 8.5 |
| Others | Segment profit | 2.1 | 2.0 |
| Others | Profit ratio | 24.3% | 23.5% |
| Adjustment | Segment profit | △8.0 | △10.0 |
Shareholder Returns
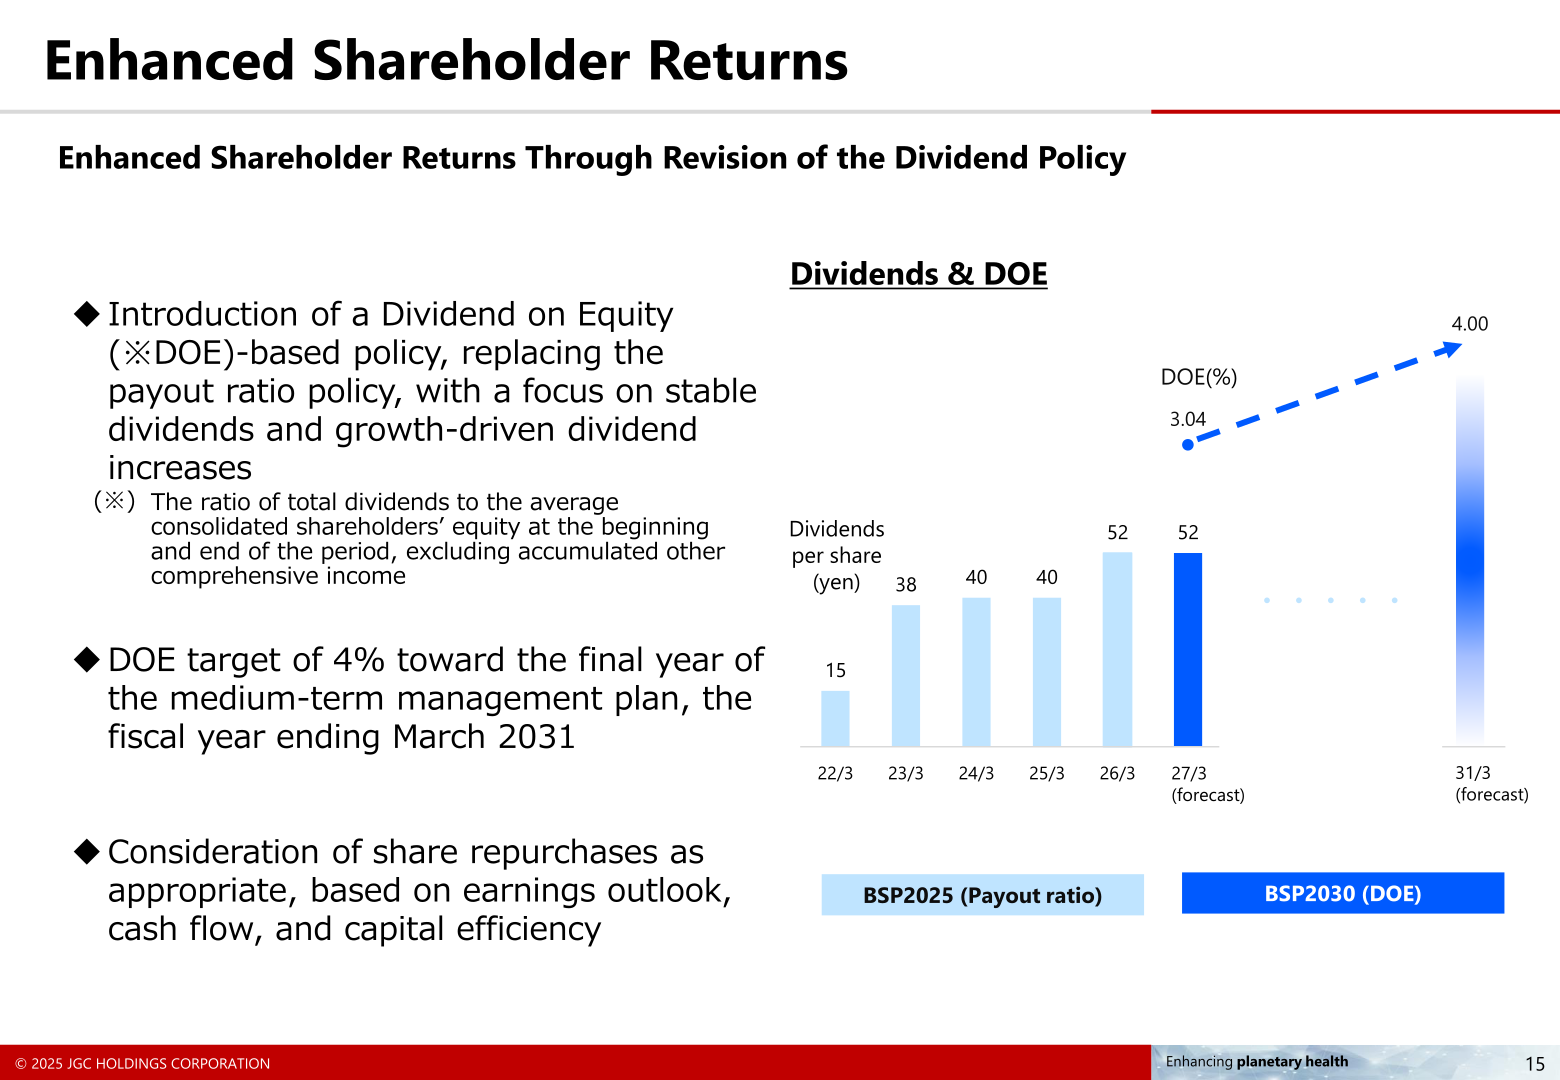
JGC introduced a Dividend on Equity (DOE)-based dividend policy, replacing its previous payout ratio policy, with a focus on stable dividends and growth-driven dividend increases. The company has set a DOE target of 4% toward the final year of its medium-term management plan, the fiscal year ending March 2031. It will also consider share repurchases as appropriate, based on earnings outlook, cash flow, and capital efficiency. For FY2025, the dividend per share was ¥52.00, ¥12.00 above the initial FY2025 forecast of ¥40.00, resulting in a payout ratio of 30%. The FY2026 forecast maintains the annual dividend at ¥52.00 per share.
Financial Position and Cash Flows
As of March 31, 2026, total assets were ¥838.7 billion, up ¥54.6 billion from ¥784.1 billion a year earlier, and total net assets were ¥431.1 billion, up ¥38.9 billion from ¥392.2 billion. The equity ratio improved to 51.2% from 49.8%. Off-balance-sheet JV cash (JGC’s portion) was ¥109.8 billion as of March 31, 2026, up ¥16.2 billion from ¥93.5 billion a year earlier. Cash flows from operating activities were ¥79.8 billion in FY2025, up ¥33.1 billion from ¥46.7 billion in FY2024. Cash flows from investing activities were △¥14.8 billion, an improvement of ¥6.3 billion from △¥21.1 billion, and cash flows from financing activities were △¥10.9 billion, an improvement of ¥4.0 billion from △¥15.0 billion. Cash and cash equivalents at the end of the period were ¥400.4 billion, up ¥67.7 billion from ¥332.7 billion a year earlier.
This article is an analysis based on publicly available information and is not a recommendation to buy or sell any specific securities. Investment decisions are your own responsibility.
![[Obayashi] Investors’ Guide 2026 — The Complete 24-Article Breakdown](https://japan-equity.com/wp-content/uploads/2026/07/hub_cover-1024x1024.png)
![[Obayashi] IR & SR Policy — Feeding Dialogue Back into Management](https://japan-equity.com/wp-content/uploads/2026/07/p32_sq-1024x1024.jpg)
![[Obayashi] Real Estate Development — 18.7% Margin, ¥287.7bn Unrealized Gains](https://japan-equity.com/wp-content/uploads/2026/07/p20_sq-1024x1024.jpg)
![[Obayashi] Domestic Civil Engineering — Resilience Spending Supports 9.6% Margin](https://japan-equity.com/wp-content/uploads/2026/07/p11_sq-1024x1024.jpg)
![[Obayashi] Share Price & External Ratings — vs TOPIX, ESG Index Inclusion](https://japan-equity.com/wp-content/uploads/2026/07/p40_sq-1024x1024.jpg)
![[Construction] ¥75.5tn Investment, Shrinking Workforce — Big-5 Market Share](https://japan-equity.com/wp-content/uploads/2026/07/p12_sq-1024x1024.jpg)



![[Obayashi] Capital Policy & Shareholder Returns — ROE 10%+, DOE ~5%, ¥100bn Buyback](https://japan-equity.com/wp-content/uploads/2026/07/p27_sq-1024x1024.jpg)
![[Obayashi] Reducing Cross-Shareholdings — ¥285.2bn Sold in Five Years](https://japan-equity.com/wp-content/uploads/2026/07/p29_sq-1024x1024.jpg)
![[Obayashi] ¥750bn Investment Plan — ¥300bn to Development, ¥190bn to Tech/DX](https://japan-equity.com/wp-content/uploads/2026/07/p30_sq-1024x1024.jpg)
![[Obayashi] MTP2022 KPIs — Operating Profit ~2x Target, ROE 14.4%](https://japan-equity.com/wp-content/uploads/2026/07/p25_sq-1024x1024.jpg)
![[Obayashi] Cash Allocation — ¥420bn Investment CF Over Five Years](https://japan-equity.com/wp-content/uploads/2026/07/p26_sq-1024x1024.jpg)
![[Obayashi] Green Energy — 44 Plants, 344MW, and the Green Hydrogen Challenge](https://japan-equity.com/wp-content/uploads/2026/07/p21_sq-1024x1024.jpg)
![[Obayashi] Tackling the Labor Shortage — Robotics Construction®](https://japan-equity.com/wp-content/uploads/2026/07/p14_sq-1024x1024.jpg)
