
This article is based on publicly available IR materials and is not a recommendation to buy or sell any specific securities.
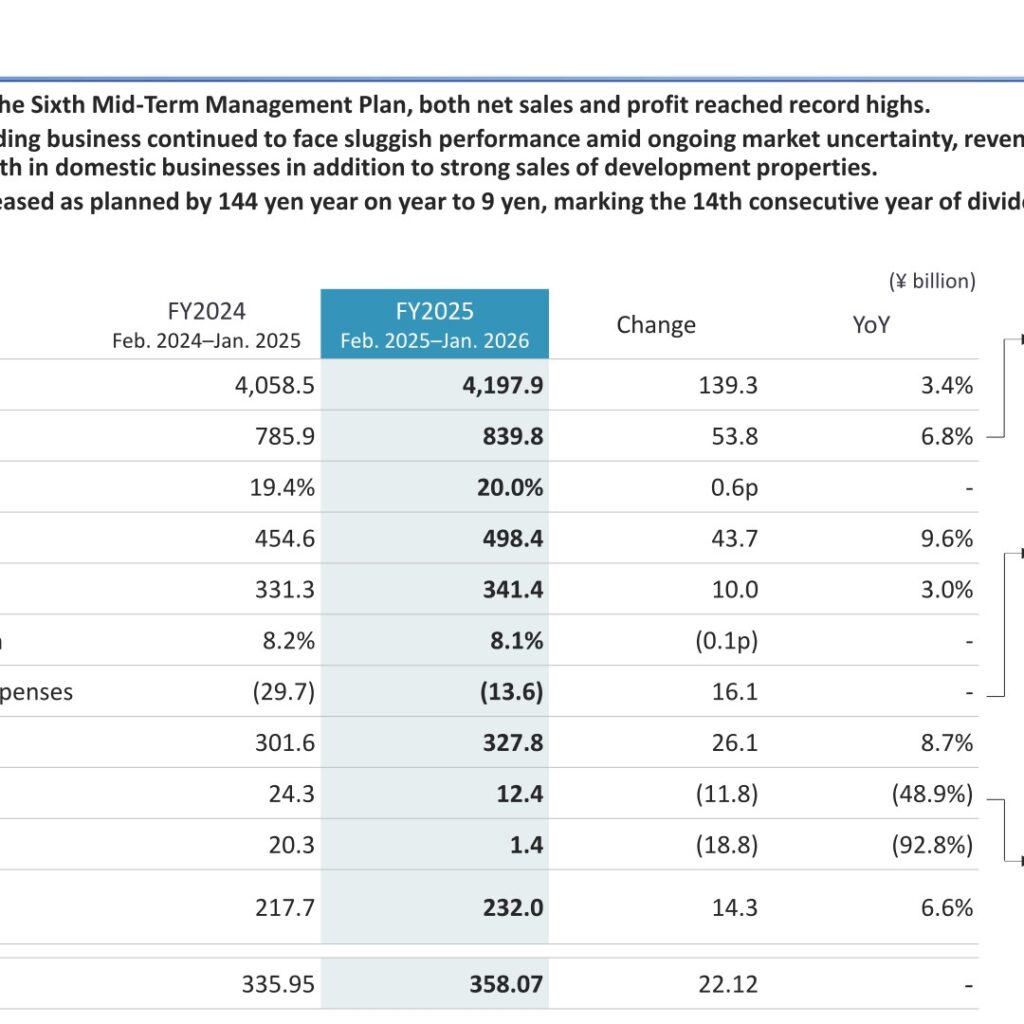
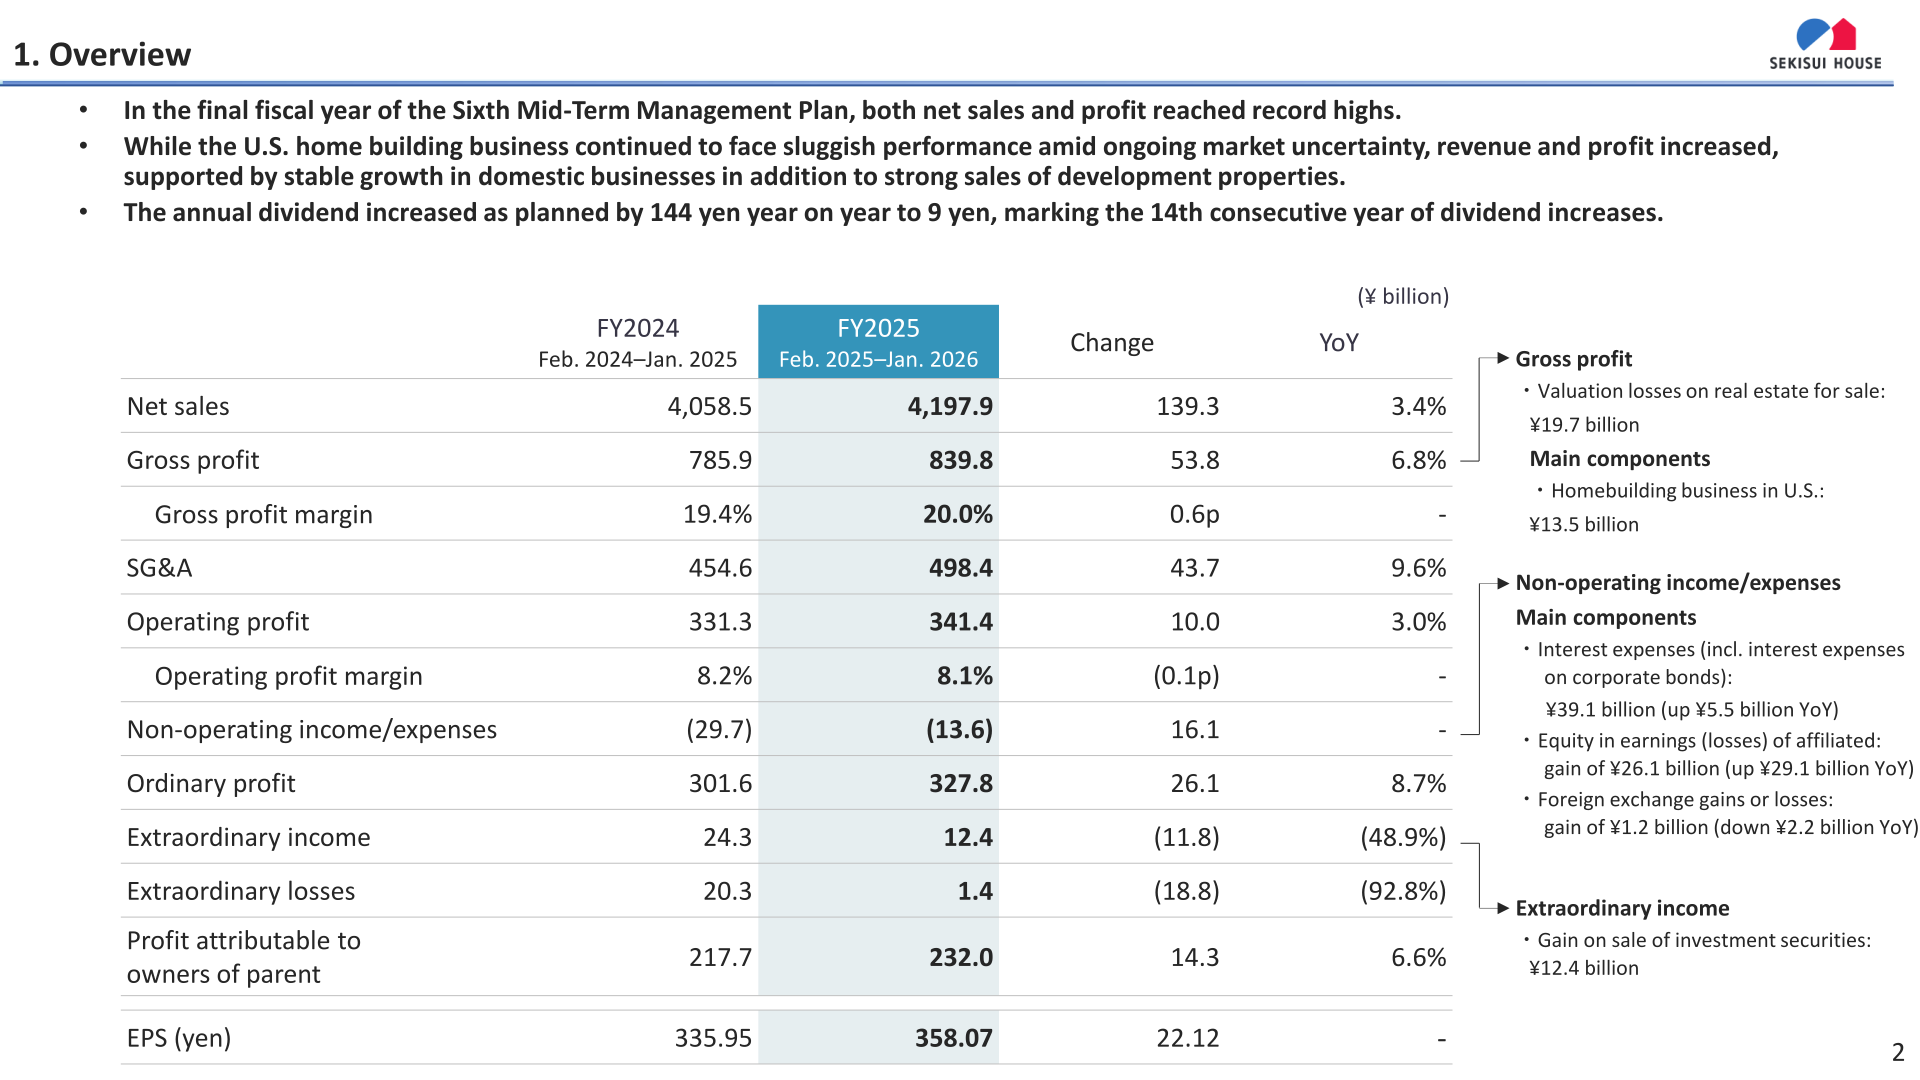
Note: Sekisui House’s fiscal year ended January 31, 2026; the company labels this period “FY2025” in its own materials, and the figures and tables below follow the company’s FY2025/FY2026 labels accordingly. In the final fiscal year of its Sixth Mid-Term Management Plan, Sekisui House, Ltd. achieved record highs in both net sales and profit at every income stage. Consolidated net sales rose to 4,197.9 billion yen (+139.3 billion yen, +3.4% year on year) and operating profit increased to 341.4 billion yen (+10.0 billion yen, +3.0%), while profit attributable to owners of parent rose to 232.0 billion yen (+14.3 billion yen, +6.6%). While the U.S. homebuilding business continued to face a sluggish, uncertain market, revenue and profit increased overall, supported by stable growth in domestic businesses and strong sales of development properties. The annual dividend for FY2025 was 144.00 yen per share, marking the 14th consecutive year of dividend increases.
Consolidated Results (Full-Year Actual)
Gross profit rose to 839.8 billion yen (+53.8 billion yen, +6.8% year on year), with the gross profit margin improving 0.6 point to 20.0%; gross profit reflected valuation losses on real estate for sale of 19.7 billion yen, of which 13.5 billion yen related to the U.S. homebuilding business. SG&A expenses increased 9.6% to 498.4 billion yen, and operating profit margin was 8.1% (down 0.1 point year on year). Non-operating income/expenses improved by 16.1 billion yen to a net expense of 13.6 billion yen, as a gain of 26.1 billion yen from equity in earnings of affiliated companies (up 29.1 billion yen year on year) was partly offset by interest expenses (including on corporate bonds) of 39.1 billion yen (up 5.5 billion yen). Ordinary profit rose 8.7% to 327.8 billion yen. Extraordinary income of 12.4 billion yen consisted of a gain on sale of investment securities, while extraordinary losses fell to 1.4 billion yen from 20.3 billion yen in FY2024. Profit attributable to owners of parent rose 6.6% to 232.0 billion yen, and EPS was 358.07 yen (+22.12 yen year on year). Compared with the FY2025 plan announced in September, net sales fell short by 133.0 billion yen (-3.1%), but operating profit, ordinary profit, and profit attributable to owners of parent all met or exceeded plan, with ROE of 11.3% versus a planned 11.9%.
| Item | FY2024 | FY2025 | YoY (Amount) | YoY (%) | FY2025 Plan (Sep.) | vs. Plan (Amount) | vs. Plan (%) |
|---|---|---|---|---|---|---|---|
| Net sales (¥ billion) | 4,058.5 | 4,197.9 | 139.3 | 3.4% | 4,331.0 | (133.0) | (3.1%) |
| Gross profit (¥ billion) | 785.9 | 839.8 | 53.8 | 6.8% | – | – | – |
| Gross profit margin | 19.4% | 20.0% | 0.6p | – | – | – | – |
| SG&A (¥ billion) | 454.6 | 498.4 | 43.7 | 9.6% | – | – | – |
| Operating profit (¥ billion) | 331.3 | 341.4 | 10.0 | 3.0% | 340.0 | 1.4 | 0.4% |
| Operating profit margin | 8.2% | 8.1% | (0.1p) | – | – | – | – |
| Ordinary profit (¥ billion) | 301.6 | 327.8 | 26.1 | 8.7% | 321.0 | 6.8 | 2.1% |
| Profit attributable to owners of parent (¥ billion) | 217.7 | 232.0 | 14.3 | 6.6% | 232.0 | 0.0 | 0.0% |
| EPS (yen) | 335.95 | 358.07 | 22.12 | – | – | – | – |
| ROE (%) | 11.7% | 11.3% | – | – | 11.9% | – | (0.6p) |
Financial Position and Cash Flow
Interest-bearing debt stood at 1,881.7 billion yen at fiscal year-end (+4.2 billion yen year on year), while the D/E ratio improved to 0.88 times (from 0.96 times; 0.80 times taking into account hybrid bonds, from 0.86 times) and the equity-to-asset ratio rose 1.9 point to 42.7%. Real estate for sale increased 195.3 billion yen to 3,034.6 billion yen, mainly reflecting growth in the Overseas segment (+159.6 billion yen). Cash flow from operating activities rose to 216.3 billion yen (+153.4 billion yen year on year), cash flow from investing activities improved to (73.1) billion yen, and free cash flow turned positive at 143.1 billion yen from (634.8) billion yen in FY2024. Cash and cash equivalents at fiscal year-end were 434.9 billion yen (+44.6 billion yen). Capital expenditures were 99.6 billion yen and depreciation was 42.7 billion yen in FY2025; the FY2026 plan calls for capital expenditures of 110.0 billion yen and depreciation of 43.5 billion yen.
Segment Results
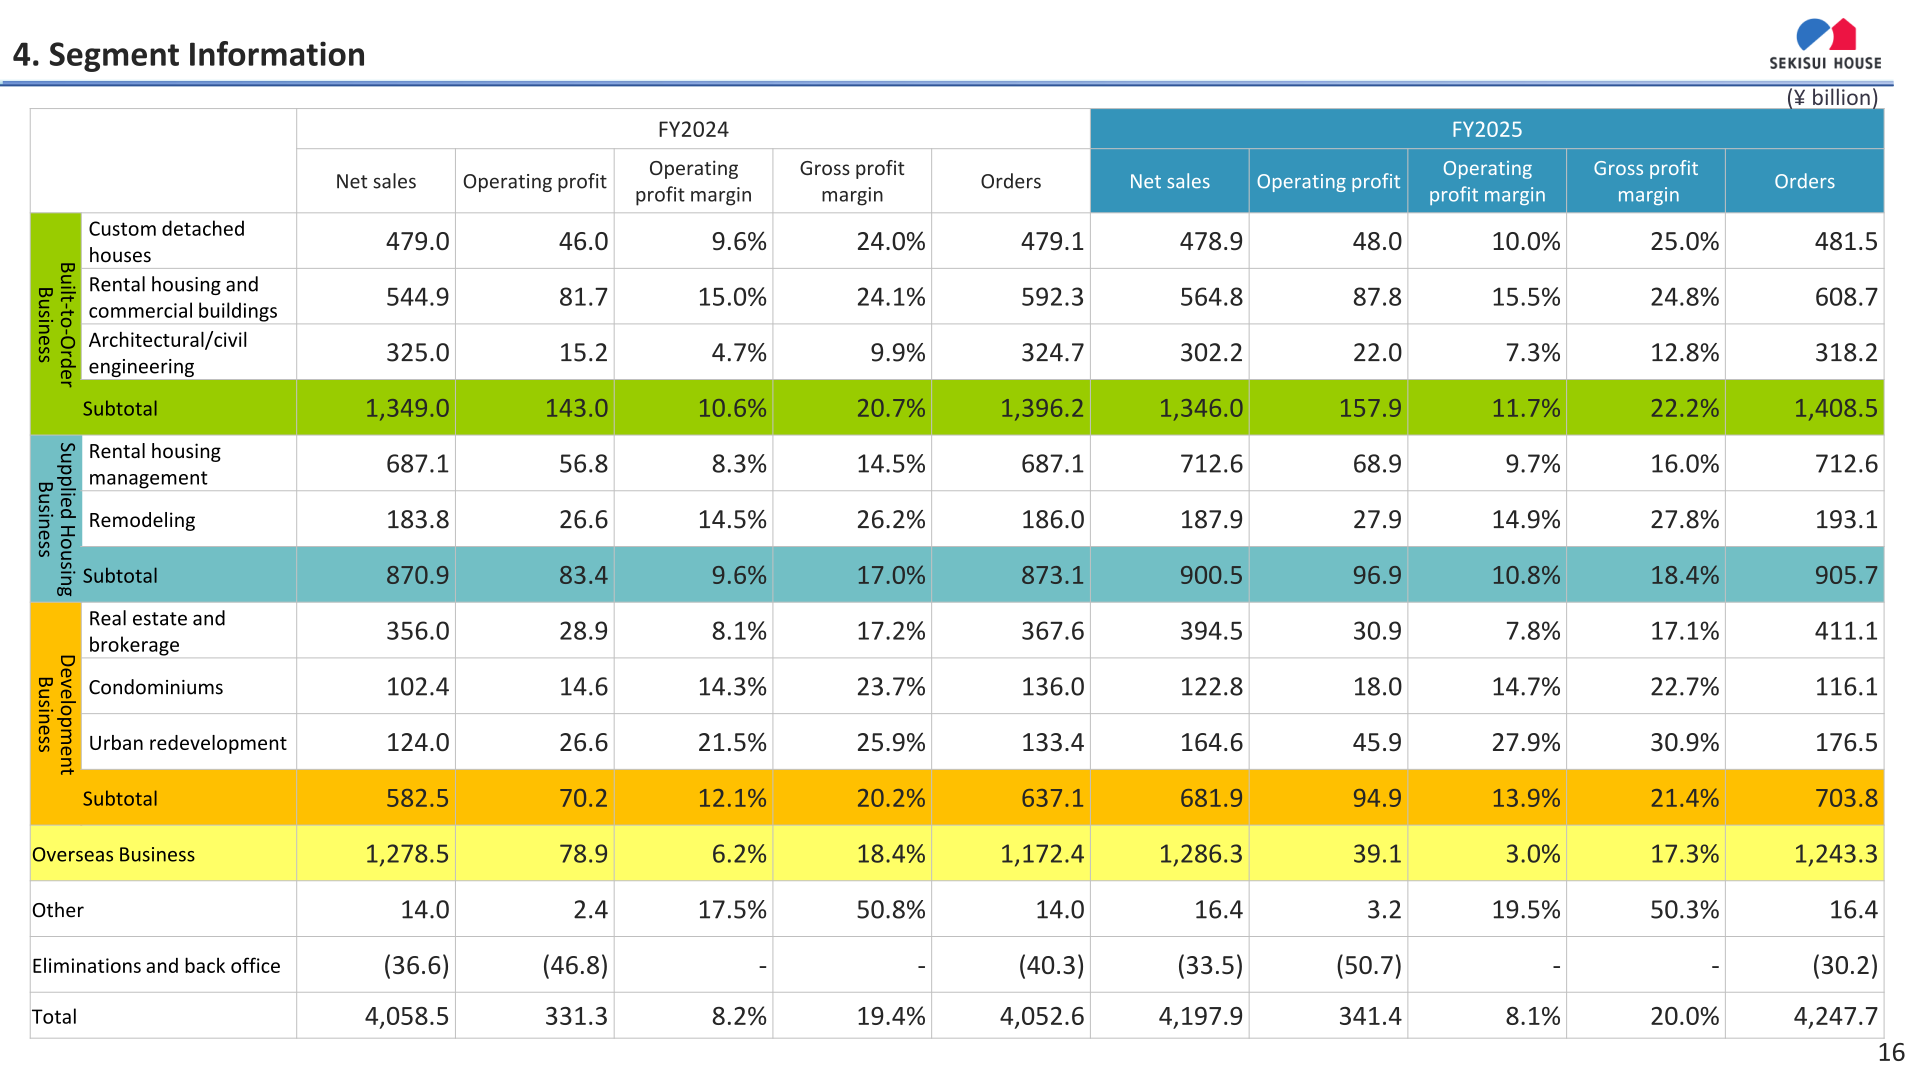
The Built-to-Order Business (custom detached houses, rental housing and commercial buildings, and architectural/civil engineering) recorded net sales of 1,346.0 billion yen (-2.9 billion yen, -0.2% year on year) but operating profit rose 10.4% to 157.9 billion yen, as high-value-added proposals and a shift toward higher-price segments in custom detached houses lifted average selling price and profitability, while the architectural/civil engineering business posted higher profit on lower sales due to the absence of prior-year large-scale projects and successful cost pass-through. The Supplied Housing Business (rental housing management and remodeling) posted net sales of 900.5 billion yen (+3.4%) and operating profit of 96.9 billion yen (+16.2%), supported by high occupancy rates, shortened vacancy periods, DX promotion in rental management, and strong remodeling orders following the establishment of Sekisui House Support Plus, Ltd. as a separate company. The Development Business (real estate and brokerage, condominiums, and urban redevelopment) achieved net sales of 681.9 billion yen (+17.1%) and operating profit of 94.9 billion yen (+35.1%), driven by growth in residential land sales via the newly established Sekisui House Real Estate, Ltd., smooth condominium deliveries, and urban redevelopment property sales that progressed ahead of plan. The Overseas Business posted net sales of 1,286.3 billion yen (+0.6%) but operating profit fell 50.5% to 39.1 billion yen, as the U.S. homebuilding business continued to face a challenging sales environment with increased incentives and valuation losses on real estate for sale, partly offset by increased sales and profit in the Master-planned community business and in Australia, where condominium deliveries progressed as planned.
| Segment | Metric | FY2024 | FY2025 | YoY (Amount) | YoY (%) |
|---|---|---|---|---|---|
| Built-to-Order Business | Net Sales (¥ billion) | 1,349.0 | 1,346.0 | (2.9) | (0.2%) |
| Built-to-Order Business | Operating Profit (¥ billion) | 143.0 | 157.9 | 14.8 | 10.4% |
| Supplied Housing Business | Net Sales (¥ billion) | 870.9 | 900.5 | 29.5 | 3.4% |
| Supplied Housing Business | Operating Profit (¥ billion) | 83.4 | 96.9 | 13.5 | 16.2% |
| Development Business | Net Sales (¥ billion) | 582.5 | 681.9 | 99.4 | 17.1% |
| Development Business | Operating Profit (¥ billion) | 70.2 | 94.9 | 24.6 | 35.1% |
| Overseas Business | Net Sales (¥ billion) | 1,278.5 | 1,286.3 | 7.8 | 0.6% |
| Overseas Business | Operating Profit (¥ billion) | 78.9 | 39.1 | (39.8) | (50.5%) |
| Total (Consolidated) | Net Sales (¥ billion) | 4,058.5 | 4,197.9 | 139.3 | 3.4% |
| Total (Consolidated) | Operating Profit (¥ billion) | 331.3 | 341.4 | 10.0 | 3.0% |
FY2026 Forecast
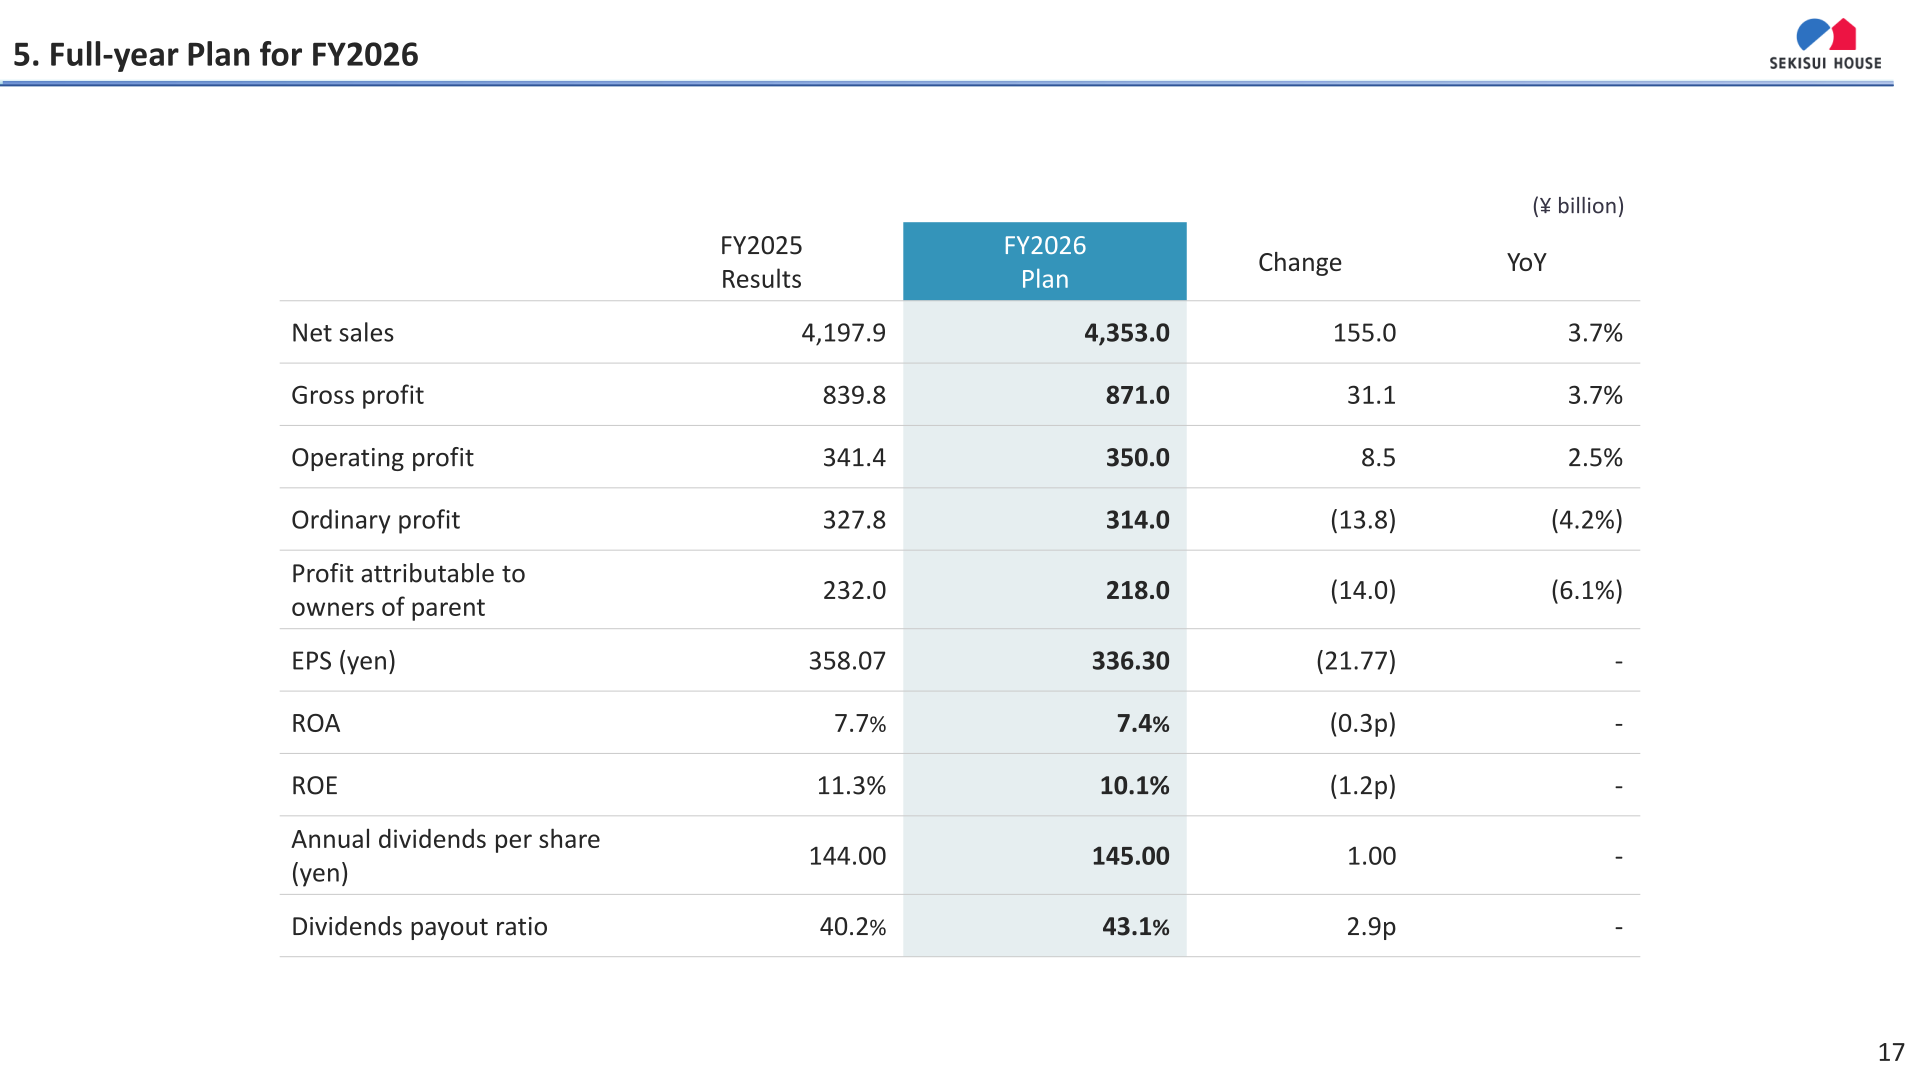
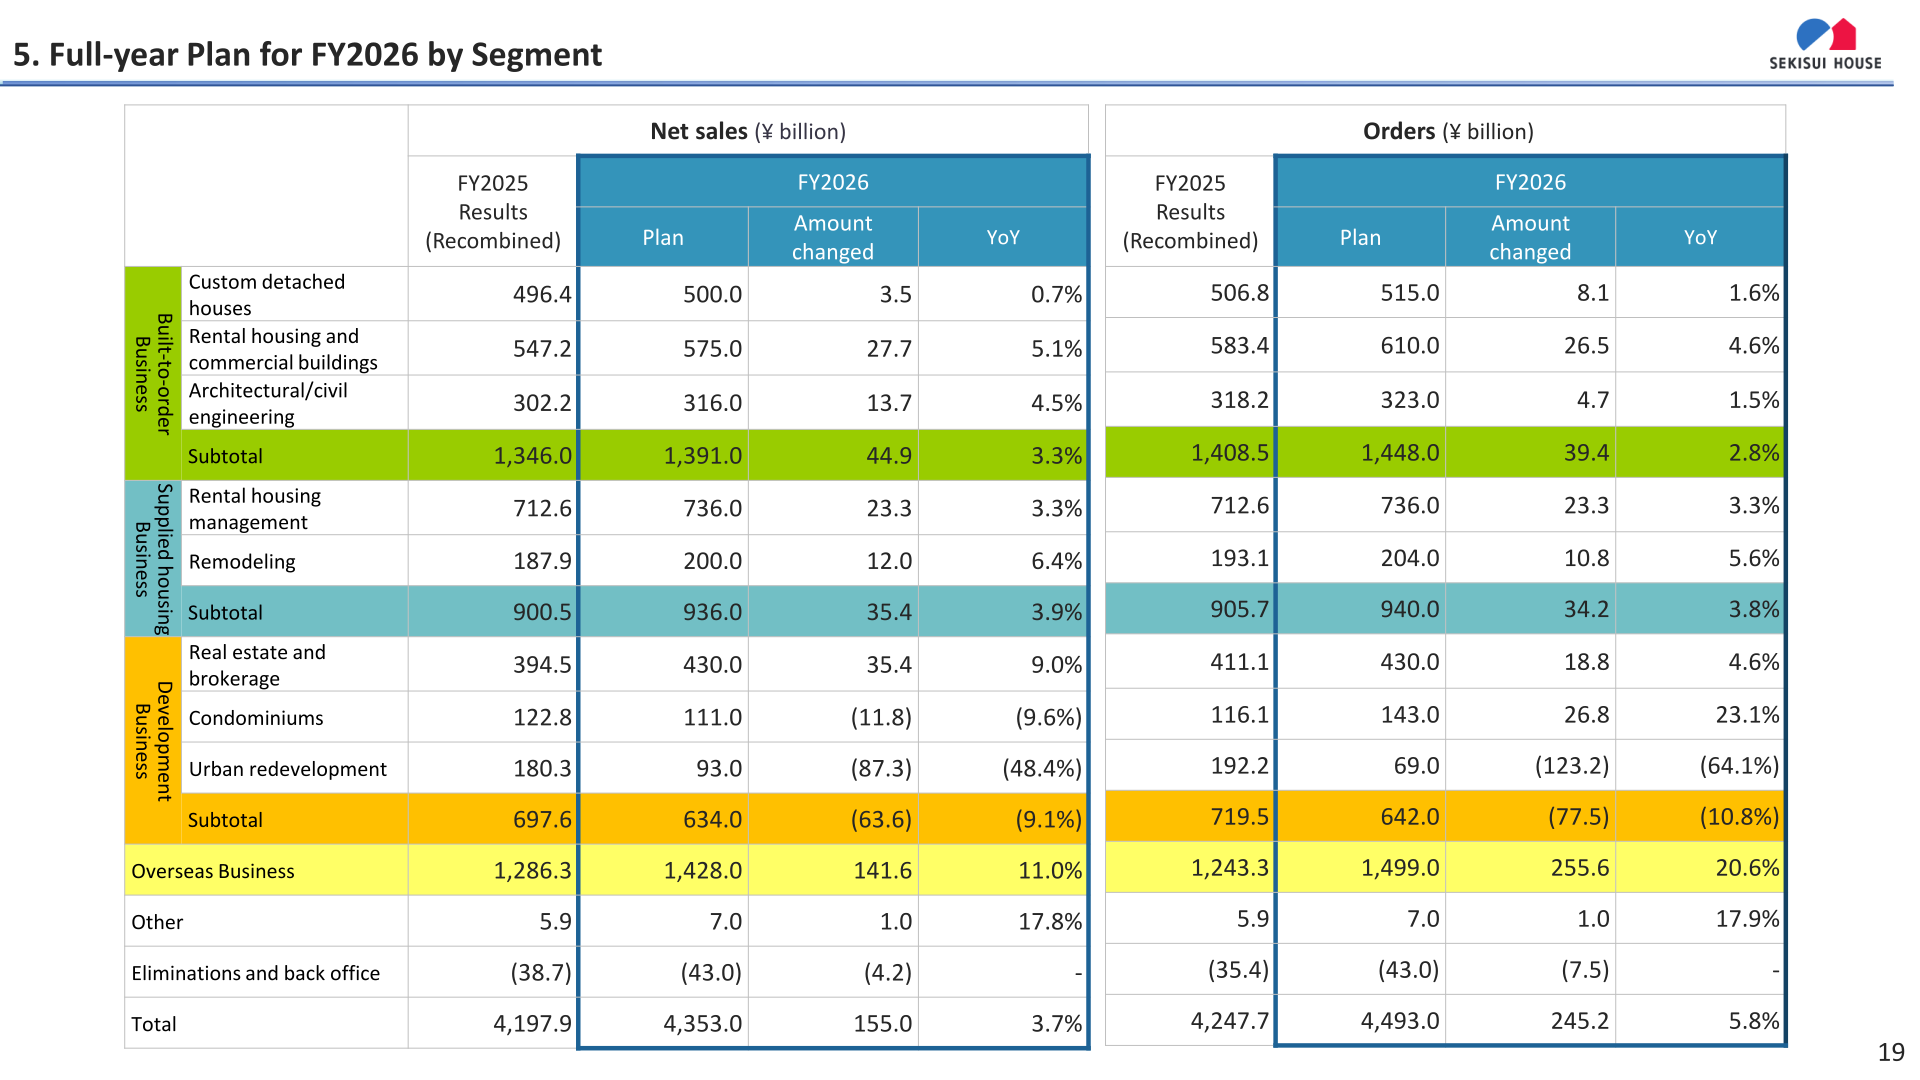
For FY2026, Sekisui House plans consolidated net sales of 4,353.0 billion yen (+155.0 billion yen, +3.7% year on year) and operating profit of 350.0 billion yen (+8.5 billion yen, +2.5%), while ordinary profit is planned to decline 4.2% to 314.0 billion yen and profit attributable to owners of parent is planned to decline 6.1% to 218.0 billion yen. Planned EPS is 336.30 yen, planned ROA is 7.4%, and planned ROE is 10.1%. Beginning in FY2026, the company will partially revise its disclosure segment structure to strengthen the linkage between business strategy and disclosure and to reinforce management by business unit: (1) clinics and other facilities ordered by branch offices responsible for custom detached houses will be reclassified from the rental housing and commercial buildings business to the custom detached houses business; (2) a portion of consolidated subsidiaries previously recorded under Other businesses will be reclassified under the urban redevelopment business; and (3) a portion of head office expenses previously recorded under Eliminations and back office will be allocated to the respective segments. On this recombined basis, the FY2026 plan calls for net sales of 1,391.0 billion yen in the Built-to-Order Business (+3.3%), 936.0 billion yen in the Supplied Housing Business (+3.9%), 634.0 billion yen in the Development Business (-9.1%, reflecting a planned decline in urban redevelopment property sales), and 1,428.0 billion yen in the Overseas Business (+11.0%), with Overseas Business operating profit planned to rise 47.3% to 56.5 billion yen on a recombined basis. The FY2026 plan assumes average foreign exchange rates of 145.00 yen to the U.S. dollar, 100.00 yen to the Australian dollar, and 110.00 yen to the Singapore dollar.
| Item | FY2025 (Actual) | FY2026 Plan | YoY (Amount) | YoY (%) |
|---|---|---|---|---|
| Net sales (¥ billion) | 4,197.9 | 4,353.0 | 155.0 | 3.7% |
| Gross profit (¥ billion) | 839.8 | 871.0 | 31.1 | 3.7% |
| Operating profit (¥ billion) | 341.4 | 350.0 | 8.5 | 2.5% |
| Ordinary profit (¥ billion) | 327.8 | 314.0 | (13.8) | (4.2%) |
| Profit attributable to owners of parent (¥ billion) | 232.0 | 218.0 | (14.0) | (6.1%) |
| EPS (yen) | 358.07 | 336.30 | (21.77) | – |
| ROA | 7.7% | 7.4% | (0.3p) | – |
| ROE | 11.3% | 10.1% | (1.2p) | – |
| Annual dividends per share (yen) | 144.00 | 145.00 | 1.00 | – |
| Dividends payout ratio | 40.2% | 43.1% | 2.9p | – |
Shareholder Returns
The annual dividend for FY2025 was 144.00 yen per share, an increase for the 14th consecutive year, with a dividend payout ratio of 40.2%. For FY2026, Sekisui House plans to increase the annual dividend by 1.00 yen to 145.00 yen per share, with a planned dividend payout ratio of 43.1%.
| Item | FY2025 (Actual) | FY2026 Plan |
|---|---|---|
| Annual dividends per share (yen) | 144.00 | 145.00 |
| Dividends payout ratio | 40.2% | 43.1% |
Medium-Term Plan / Topics
FY2025 was the final fiscal year of Sekisui House’s Sixth Mid-Term Management Plan, whose fundamental policy is “Stable Growth in Japan and Proactive Growth Overseas” under the company’s global vision to “Make home the happiest place in the world.” The plan describes the company’s core competencies as technical expertise, construction expertise, customer base, human capital, DX and data, and growth investments, and its aims include becoming a leading company in ESG management and making Sekisui House technologies the global de facto standard. Separately, M.D.C. Holdings, Inc., the company’s U.S. homebuilding subsidiary consolidated from April 2024, was renamed SEKISUI HOUSE U.S., Inc. in September 2025, though it continues to be labeled “MDC” in the company’s disclosure materials for convenience.
This article is an analysis based on publicly available information and is not a recommendation to buy or sell any specific securities. Investment decisions are your own responsibility.
![[Obayashi] Investors’ Guide 2026 — The Complete 24-Article Breakdown](https://japan-equity.com/wp-content/uploads/2026/07/hub_cover-1024x1024.png)
![[Obayashi] IR & SR Policy — Feeding Dialogue Back into Management](https://japan-equity.com/wp-content/uploads/2026/07/p32_sq-1024x1024.jpg)
![[Obayashi] Real Estate Development — 18.7% Margin, ¥287.7bn Unrealized Gains](https://japan-equity.com/wp-content/uploads/2026/07/p20_sq-1024x1024.jpg)
![[Obayashi] Domestic Civil Engineering — Resilience Spending Supports 9.6% Margin](https://japan-equity.com/wp-content/uploads/2026/07/p11_sq-1024x1024.jpg)
![[Obayashi] Share Price & External Ratings — vs TOPIX, ESG Index Inclusion](https://japan-equity.com/wp-content/uploads/2026/07/p40_sq-1024x1024.jpg)
![[Construction] ¥75.5tn Investment, Shrinking Workforce — Big-5 Market Share](https://japan-equity.com/wp-content/uploads/2026/07/p12_sq-1024x1024.jpg)



![[Obayashi] Capital Policy & Shareholder Returns — ROE 10%+, DOE ~5%, ¥100bn Buyback](https://japan-equity.com/wp-content/uploads/2026/07/p27_sq-1024x1024.jpg)
![[Obayashi] Reducing Cross-Shareholdings — ¥285.2bn Sold in Five Years](https://japan-equity.com/wp-content/uploads/2026/07/p29_sq-1024x1024.jpg)
![[Obayashi] ¥750bn Investment Plan — ¥300bn to Development, ¥190bn to Tech/DX](https://japan-equity.com/wp-content/uploads/2026/07/p30_sq-1024x1024.jpg)
![[Obayashi] MTP2022 KPIs — Operating Profit ~2x Target, ROE 14.4%](https://japan-equity.com/wp-content/uploads/2026/07/p25_sq-1024x1024.jpg)
![[Obayashi] Cash Allocation — ¥420bn Investment CF Over Five Years](https://japan-equity.com/wp-content/uploads/2026/07/p26_sq-1024x1024.jpg)
![[Obayashi] Green Energy — 44 Plants, 344MW, and the Green Hydrogen Challenge](https://japan-equity.com/wp-content/uploads/2026/07/p21_sq-1024x1024.jpg)
![[Obayashi] Tackling the Labor Shortage — Robotics Construction®](https://japan-equity.com/wp-content/uploads/2026/07/p14_sq-1024x1024.jpg)
