
This article is based on publicly available IR materials and is not a recommendation to buy or sell any specific securities.
AEON CO., LTD. reported consolidated results for FY2025 (fiscal year ended February 28, 2026), with operating revenue up 5.7% year on year to ¥10,715.3bn, a record high for the fifth consecutive year, and operating profit up 13.8% to ¥270.4bn, a record high for the first time in two years, leveraging the Group’s integrated strengths. Profit attributable to owners of the parent company rose 167.5% to ¥72.6bn, as one-off cost increases from accelerated business structure reforms were absorbed by extraordinary gains from step acquisitions related to the consolidation of TSURUHA Holdings. For FY2026, the company forecasts operating profit of ¥340.0bn (+25.7%), centered on growth and profitability improvements in the retail business, and plans an annual dividend of ¥15 per share, including a commemorative dividend for the 100th anniversary of incorporation.
Consolidated Results (Full-Year Actual)
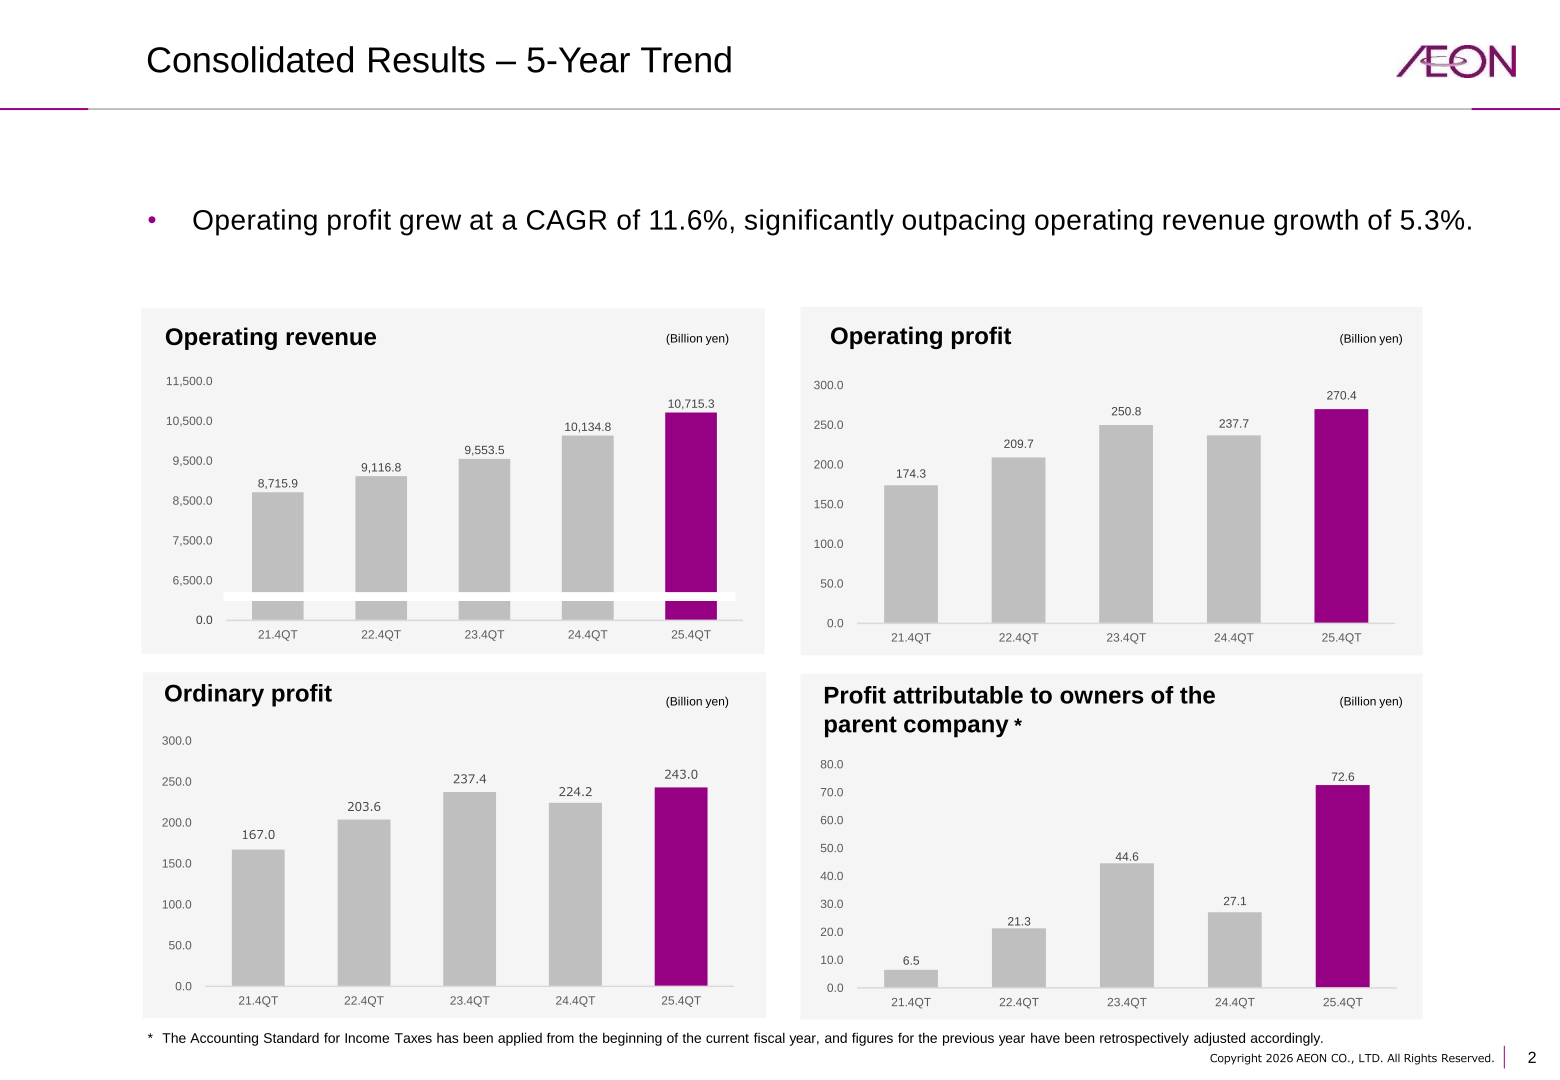
Operating profit grew at a CAGR of 11.6% over the five years from FY2021 to FY2025, significantly outpacing operating revenue growth of 5.3% over the same period. The Accounting Standard for Income Taxes has been applied from the beginning of the current fiscal year, and figures for the previous year have been retrospectively adjusted accordingly.
| Item | FY2025 | FY2024 | YoY Change |
|---|---|---|---|
| Operating revenue (Billion yen) | 10,715.3 | 10,134.8 | +580.4 (5.7%) |
| Operating profit (Billion yen) | 270.4 | 237.7 | +32.7 (13.8%) |
| Ordinary profit (Billion yen) | 243.0 | 224.2 | +18.8 (8.4%) |
| Profit attributable to owners of the parent company (Billion yen) | 72.6 | 27.1 | +45.5 (167.5%) |
Segment Results
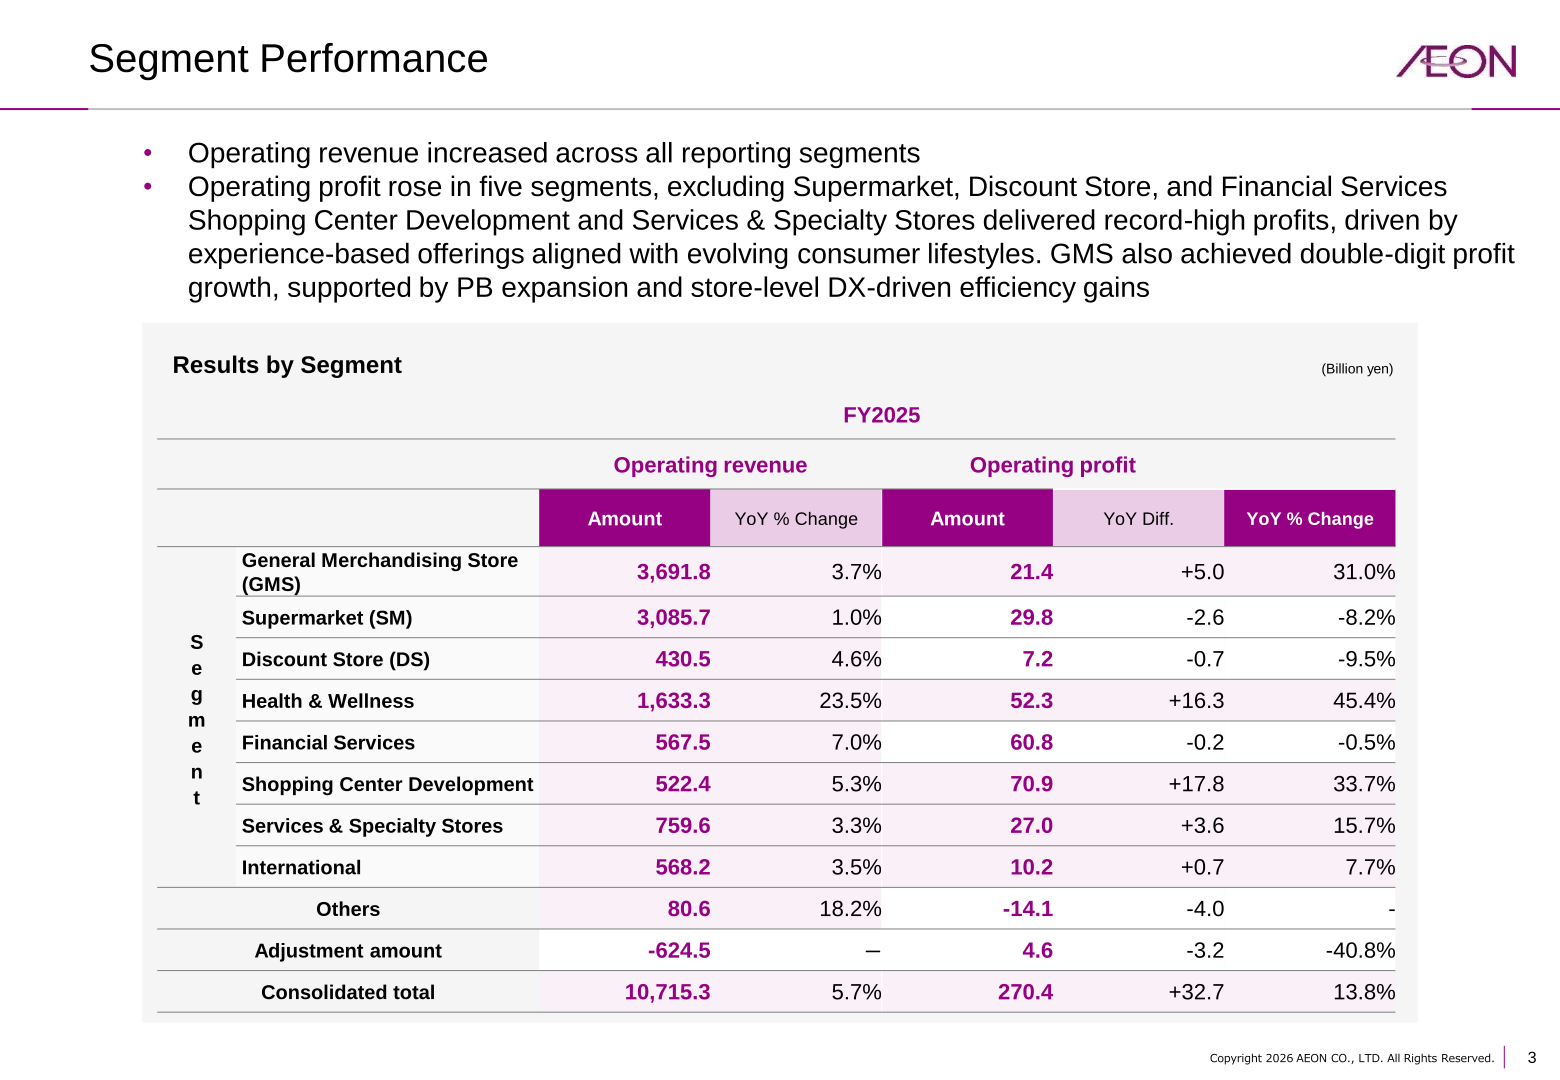
Operating revenue increased across all reporting segments. Operating profit rose in five segments, excluding Supermarket, Discount Store, and Financial Services. Shopping Center Development and Services & Specialty Stores delivered record-high profits, driven by experience-based offerings aligned with evolving consumer lifestyles, and General Merchandising Store (GMS) also achieved double-digit profit growth, supported by PB expansion and store-level DX-driven efficiency gains.
| Segment | Operating revenue (Bn yen) | Revenue YoY % | Operating profit (Bn yen) | Profit YoY Diff. | Profit YoY % |
|---|---|---|---|---|---|
| General Merchandising Store (GMS) | 3,691.8 | 3.7% | 21.4 | +5.0 | 31.0% |
| Supermarket (SM) | 3,085.7 | 1.0% | 29.8 | -2.6 | -8.2% |
| Discount Store (DS) | 430.5 | 4.6% | 7.2 | -0.7 | -9.5% |
| Health & Wellness | 1,633.3 | 23.5% | 52.3 | +16.3 | 45.4% |
| Financial Services | 567.5 | 7.0% | 60.8 | -0.2 | -0.5% |
| Shopping Center Development | 522.4 | 5.3% | 70.9 | +17.8 | 33.7% |
| Services & Specialty Stores | 759.6 | 3.3% | 27.0 | +3.6 | 15.7% |
| International | 568.2 | 3.5% | 10.2 | +0.7 | 7.7% |
| Others | 80.6 | 18.2% | -14.1 | -4.0 | – |
| Adjustment amount | -624.5 | ー | 4.6 | -3.2 | -40.8% |
| Consolidated total | 10,715.3 | 5.7% | 270.4 | +32.7 | 13.8% |
In the Health & Wellness segment, WELCIA achieved substantial profit growth through expanded dispensing pharmacy formats, higher food mix, and improved in-store operational efficiency. Following the management integration in December, PMI (post-merger integration) between TSURUHA and WELCIA progressed steadily toward early synergy realization. In the Shopping Center Development segment, AEON Mall achieved revenue and profit growth, renewing record-high operating profit, with increased foot traffic in Japan and solid specialty store sales in China and ASEAN.
FY2026 Forecast
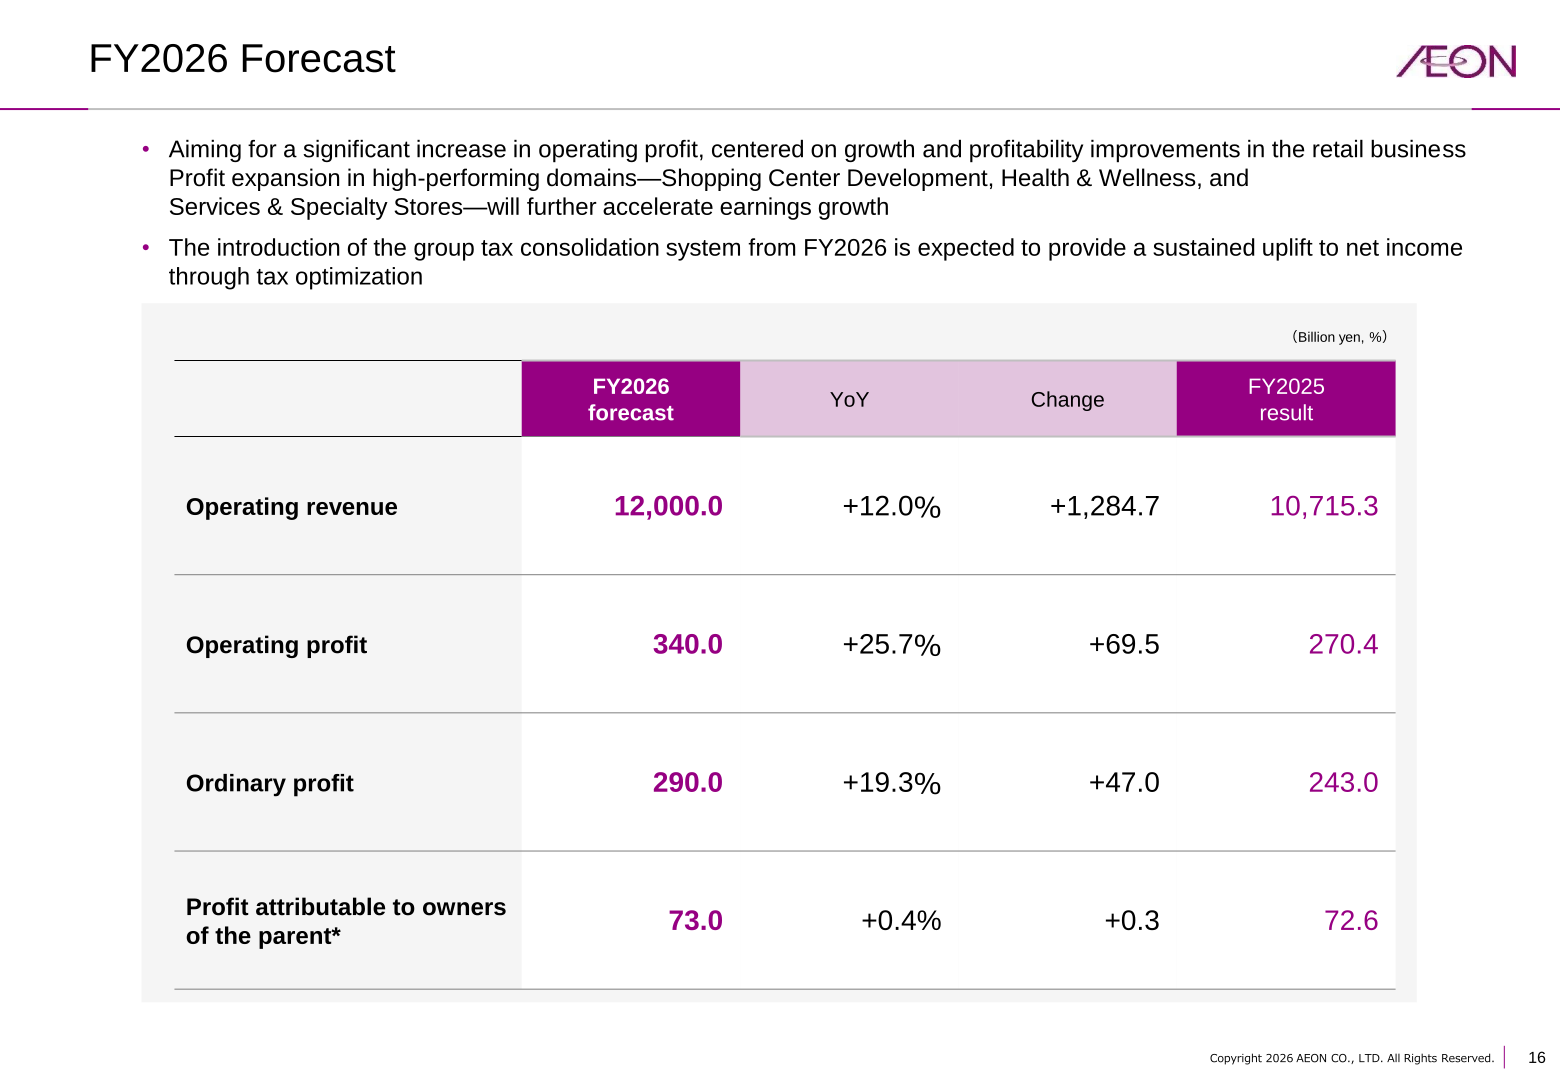
AEON aims for a significant increase in operating profit, centered on growth and profitability improvements in the retail business. Profit expansion in high-performing domains—Shopping Center Development, Health & Wellness, and Services & Specialty Stores—is expected to further accelerate earnings growth. The introduction of the group tax consolidation system from FY2026 is expected to provide a sustained uplift to net income through tax optimization.
| Item | FY2026 Forecast (Bn yen) | YoY % | YoY Change (Bn yen) | FY2025 Result (Bn yen) |
|---|---|---|---|---|
| Operating revenue | 12,000.0 | +12.0% | +1,284.7 | 10,715.3 |
| Operating profit | 340.0 | +25.7% | +69.5 | 270.4 |
| Ordinary profit | 290.0 | +19.3% | +47.0 | 243.0 |
| Profit attributable to owners of the parent* | 73.0 | +0.4% | +0.3 | 72.6 |
Shareholder Returns
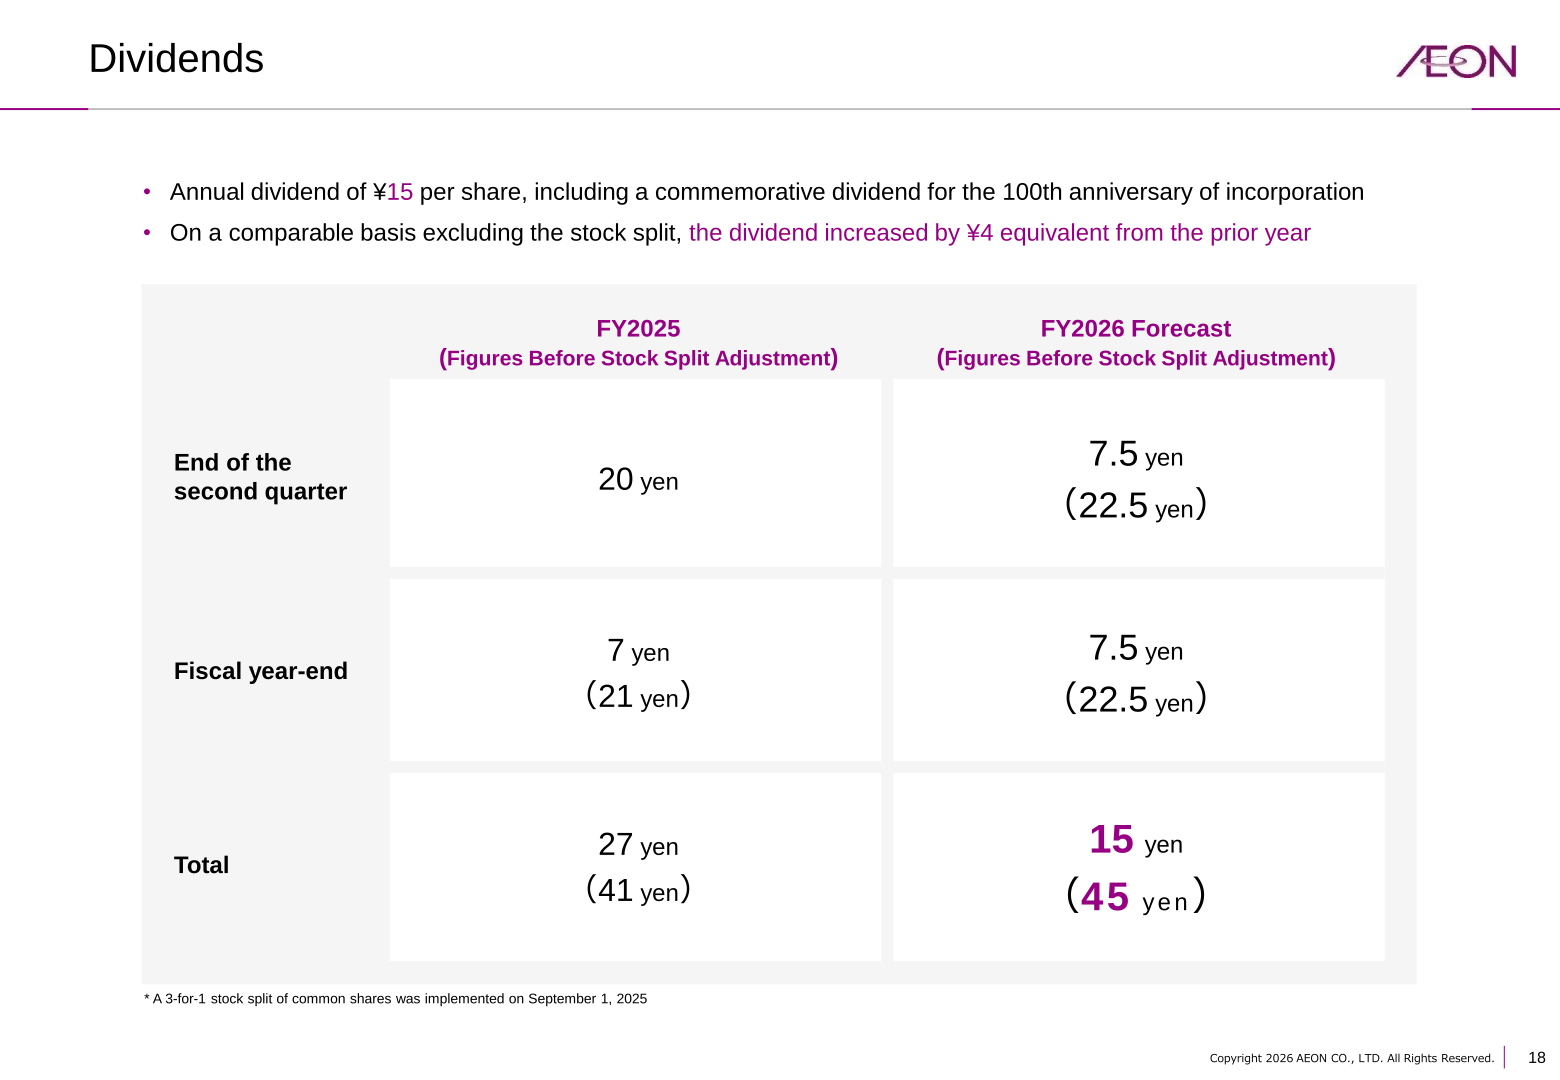
AEON plans an annual dividend of ¥15 per share for FY2026, including a commemorative dividend for the 100th anniversary of incorporation. On a comparable basis excluding the effect of the 3-for-1 stock split of common shares implemented on September 1, 2025, the dividend is set to increase by ¥4 equivalent from the prior year.
| Item | FY2025 (Actual, before stock split adjustment) | FY2026 (Forecast, before stock split adjustment) |
|---|---|---|
| End of the second quarter | 20 yen | 7.5 yen (22.5 yen) |
| Fiscal year-end | 7 yen (21 yen) | 7.5 yen (22.5 yen) |
| Total | 27 yen (41 yen) | 15 yen (45 yen) |
Investment Plan
AEON plans total investment of ¥580.0bn in FY2026. Priority investment areas include business expansion in Vietnam; supply chain management, process centers, and DX to improve retail profitability; effective utilization of existing assets; and accelerated store expansion of My Basket.
| Item | FY2026 Plan | FY2025 Result* | Average during last MTMP* |
|---|---|---|---|
| Investment total (Billion yen) | 580.0 | 528.5 | 400.0~450.0 |
| Stores (Japan) | 58% | 57% | 55% |
| Stores (Overseas) | 16% | 19% | 17% |
| Digital/Logistics | 27% | 24% | 28% |
This article is an analysis based on publicly available information and is not a recommendation to buy or sell any specific securities. Investment decisions are your own responsibility.
![[Obayashi] Investors’ Guide 2026 — The Complete 24-Article Breakdown](https://japan-equity.com/wp-content/uploads/2026/07/hub_cover-1024x1024.png)
![[Obayashi] IR & SR Policy — Feeding Dialogue Back into Management](https://japan-equity.com/wp-content/uploads/2026/07/p32_sq-1024x1024.jpg)
![[Obayashi] Real Estate Development — 18.7% Margin, ¥287.7bn Unrealized Gains](https://japan-equity.com/wp-content/uploads/2026/07/p20_sq-1024x1024.jpg)
![[Obayashi] Domestic Civil Engineering — Resilience Spending Supports 9.6% Margin](https://japan-equity.com/wp-content/uploads/2026/07/p11_sq-1024x1024.jpg)
![[Obayashi] Share Price & External Ratings — vs TOPIX, ESG Index Inclusion](https://japan-equity.com/wp-content/uploads/2026/07/p40_sq-1024x1024.jpg)
![[Construction] ¥75.5tn Investment, Shrinking Workforce — Big-5 Market Share](https://japan-equity.com/wp-content/uploads/2026/07/p12_sq-1024x1024.jpg)



![[Obayashi] Capital Policy & Shareholder Returns — ROE 10%+, DOE ~5%, ¥100bn Buyback](https://japan-equity.com/wp-content/uploads/2026/07/p27_sq-1024x1024.jpg)
![[Obayashi] Reducing Cross-Shareholdings — ¥285.2bn Sold in Five Years](https://japan-equity.com/wp-content/uploads/2026/07/p29_sq-1024x1024.jpg)
![[Obayashi] ¥750bn Investment Plan — ¥300bn to Development, ¥190bn to Tech/DX](https://japan-equity.com/wp-content/uploads/2026/07/p30_sq-1024x1024.jpg)
![[Obayashi] MTP2022 KPIs — Operating Profit ~2x Target, ROE 14.4%](https://japan-equity.com/wp-content/uploads/2026/07/p25_sq-1024x1024.jpg)
![[Obayashi] Cash Allocation — ¥420bn Investment CF Over Five Years](https://japan-equity.com/wp-content/uploads/2026/07/p26_sq-1024x1024.jpg)
![[Obayashi] Green Energy — 44 Plants, 344MW, and the Green Hydrogen Challenge](https://japan-equity.com/wp-content/uploads/2026/07/p21_sq-1024x1024.jpg)
![[Obayashi] Tackling the Labor Shortage — Robotics Construction®](https://japan-equity.com/wp-content/uploads/2026/07/p14_sq-1024x1024.jpg)
