
This article is based on publicly available IR materials and is not a recommendation to buy or sell any specific securities.
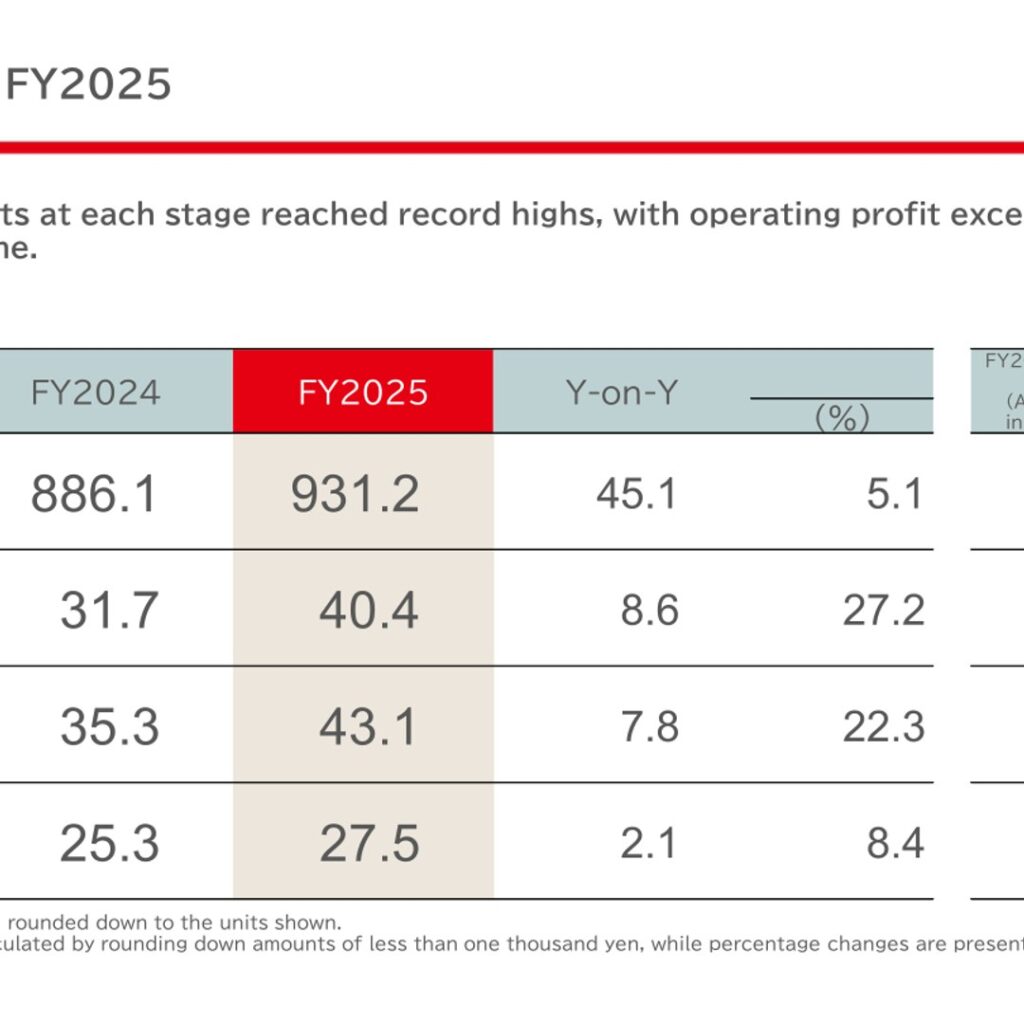
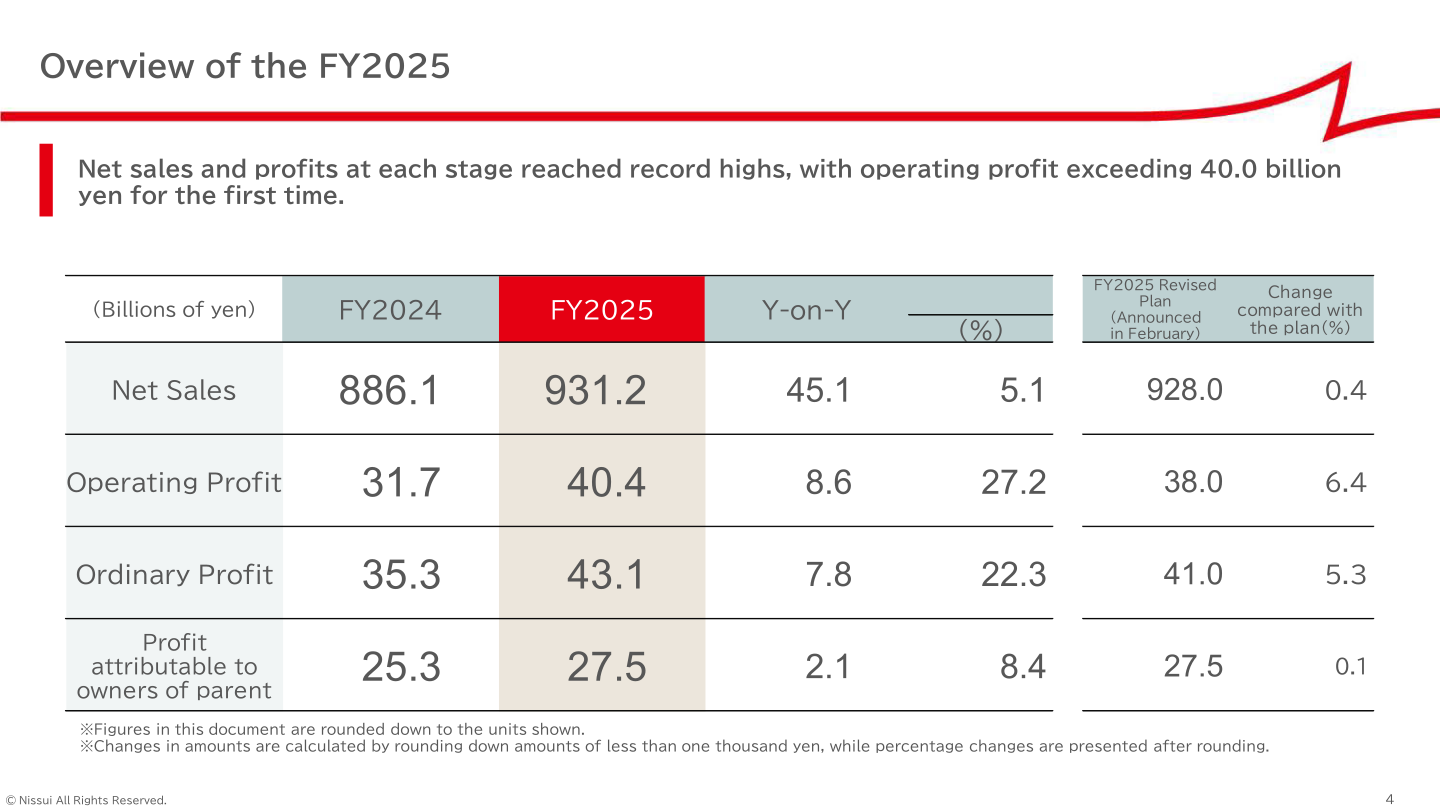
Nissui Corporation reported record net sales and profit at every income stage for FY2025 (fiscal year ended March 2026), with operating profit exceeding 40.0 billion yen for the first time. Consolidated net sales rose to 931.2 billion yen (+45.1 billion yen, +5.1% year on year), operating profit increased to 40.4 billion yen (+8.6 billion yen, +27.2%), and profit attributable to owners of parent rose to 27.5 billion yen (+2.1 billion yen, +8.4%). All four profit and sales lines exceeded the company’s revised plan announced in February, with operating profit topping the plan by 6.4%. For FY2026, Nissui forecasts continued sales growth to 980.0 billion yen but only modest operating profit growth to 42.5 billion yen, as new domestic plant costs offset gains in the Marine Products and Fine Chemicals businesses.
Consolidated Results (Full-Year Actual)
Net sales and profits at each stage reached record highs. Ordinary profit rose to 43.1 billion yen (+7.8 billion yen, +22.3% year on year), also exceeding the revised plan by 5.3%. ROIC was 5.9% (down 0.2pt year on year) and ROE was 9.5% (down 0.1pt), both affected by strategic investments, while the international net sales ratio rose to 41.2% (+0.9pt year on year). The net D/E ratio was 0.8, within the company’s 0.7-0.8 target range under its Medium-Term Management Plan through FY2027.
| Item | FY2024 | FY2025 | Y-on-Y (Amount) | Y-on-Y (%) | FY2025 Revised Plan (Feb) | vs. Plan (%) |
|---|---|---|---|---|---|---|
| Net Sales (billions of yen) | 886.1 | 931.2 | 45.1 | 5.1% | 928.0 | 0.4% |
| Operating Profit (billions of yen) | 31.7 | 40.4 | 8.6 | 27.2% | 38.0 | 6.4% |
| Ordinary Profit (billions of yen) | 35.3 | 43.1 | 7.8 | 22.3% | 41.0 | 5.3% |
| Profit attributable to owners of parent (billions of yen) | 25.3 | 27.5 | 2.1 | 8.4% | 27.5 | 0.1% |
Segment Results
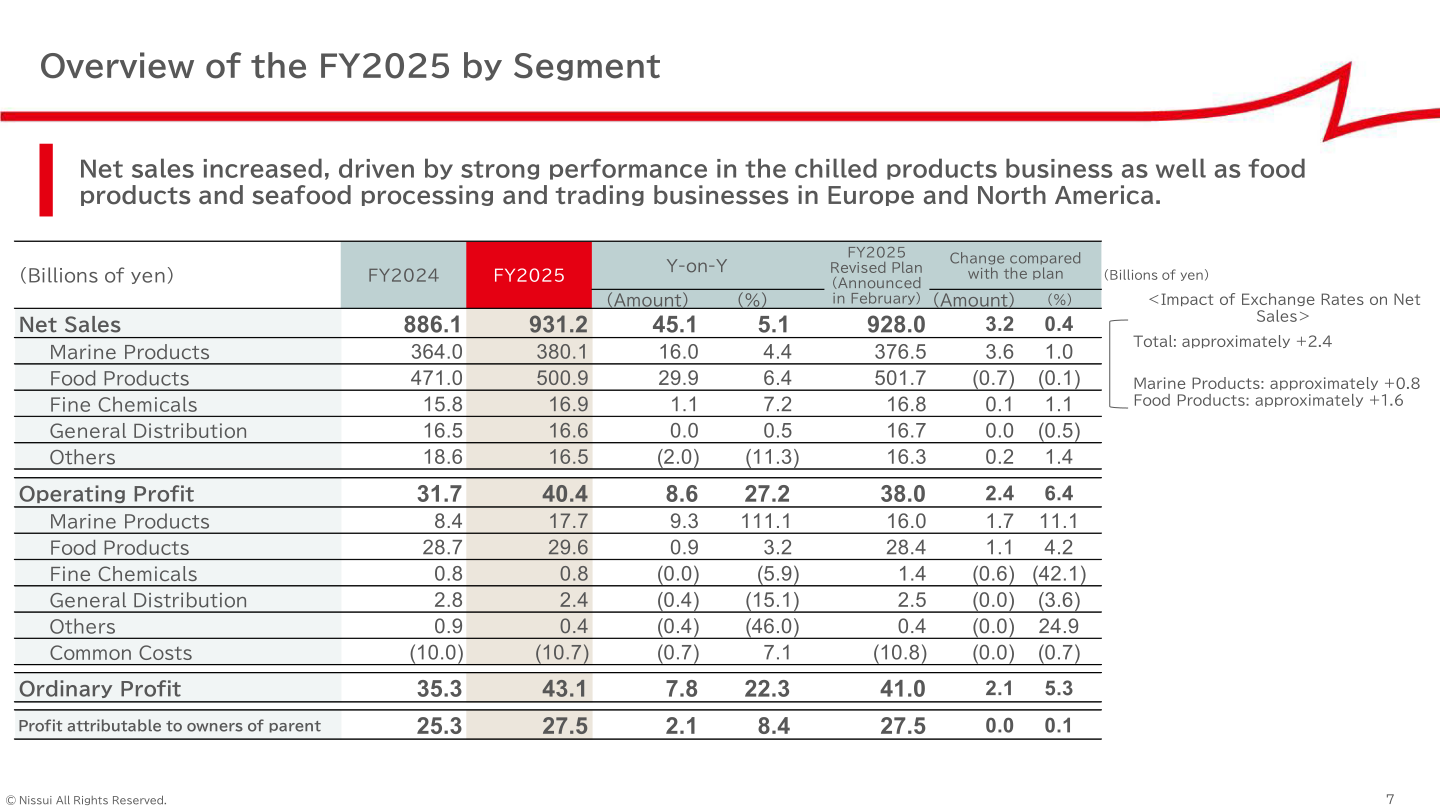
By segment, Marine Products net sales rose 4.4% to 380.1 billion yen with operating profit more than doubling to 17.7 billion yen (+9.3 billion yen, +111.1%), driven by strong domestic fishery and aquaculture performance, South American aquaculture, and overseas seafood processing and trading. Food Products net sales increased 6.4% to 500.9 billion yen with operating profit up 3.2% to 29.6 billion yen, as continued strength in the chilled products business offset rising raw material costs in Japan and overseas. Fine Chemicals net sales grew 7.2% to 16.9 billion yen while operating profit was roughly flat at 0.8 billion yen (-5.9%) due to higher costs. General Distribution operating profit declined 15.1% to 2.4 billion yen on higher personnel costs from active driver hiring. Net sales included an estimated foreign exchange impact of approximately +2.4 billion yen in total (Marine Products approximately +0.8 billion yen, Food Products approximately +1.6 billion yen).
| Segment | Metric | FY2024 | FY2025 | Y-on-Y (Amount) | Y-on-Y (%) |
|---|---|---|---|---|---|
| Marine Products | Net Sales (billions of yen) | 364.0 | 380.1 | 16.0 | 4.4% |
| Marine Products | Operating Profit (billions of yen) | 8.4 | 17.7 | 9.3 | 111.1% |
| Food Products | Net Sales (billions of yen) | 471.0 | 500.9 | 29.9 | 6.4% |
| Food Products | Operating Profit (billions of yen) | 28.7 | 29.6 | 0.9 | 3.2% |
| Fine Chemicals | Net Sales (billions of yen) | 15.8 | 16.9 | 1.1 | 7.2% |
| Fine Chemicals | Operating Profit (billions of yen) | 0.8 | 0.8 | (0.0) | (5.9%) |
| General Distribution | Net Sales (billions of yen) | 16.5 | 16.6 | 0.0 | 0.5% |
| General Distribution | Operating Profit (billions of yen) | 2.8 | 2.4 | (0.4) | (15.1%) |
| Others | Net Sales (billions of yen) | 18.6 | 16.5 | (2.0) | (11.3%) |
| Others | Operating Profit (billions of yen) | 0.9 | 0.4 | (0.4) | (46.0%) |
| Common Costs | Operating Profit (billions of yen) | (10.0) | (10.7) | (0.7) | 7.1% |
FY2026 Forecast
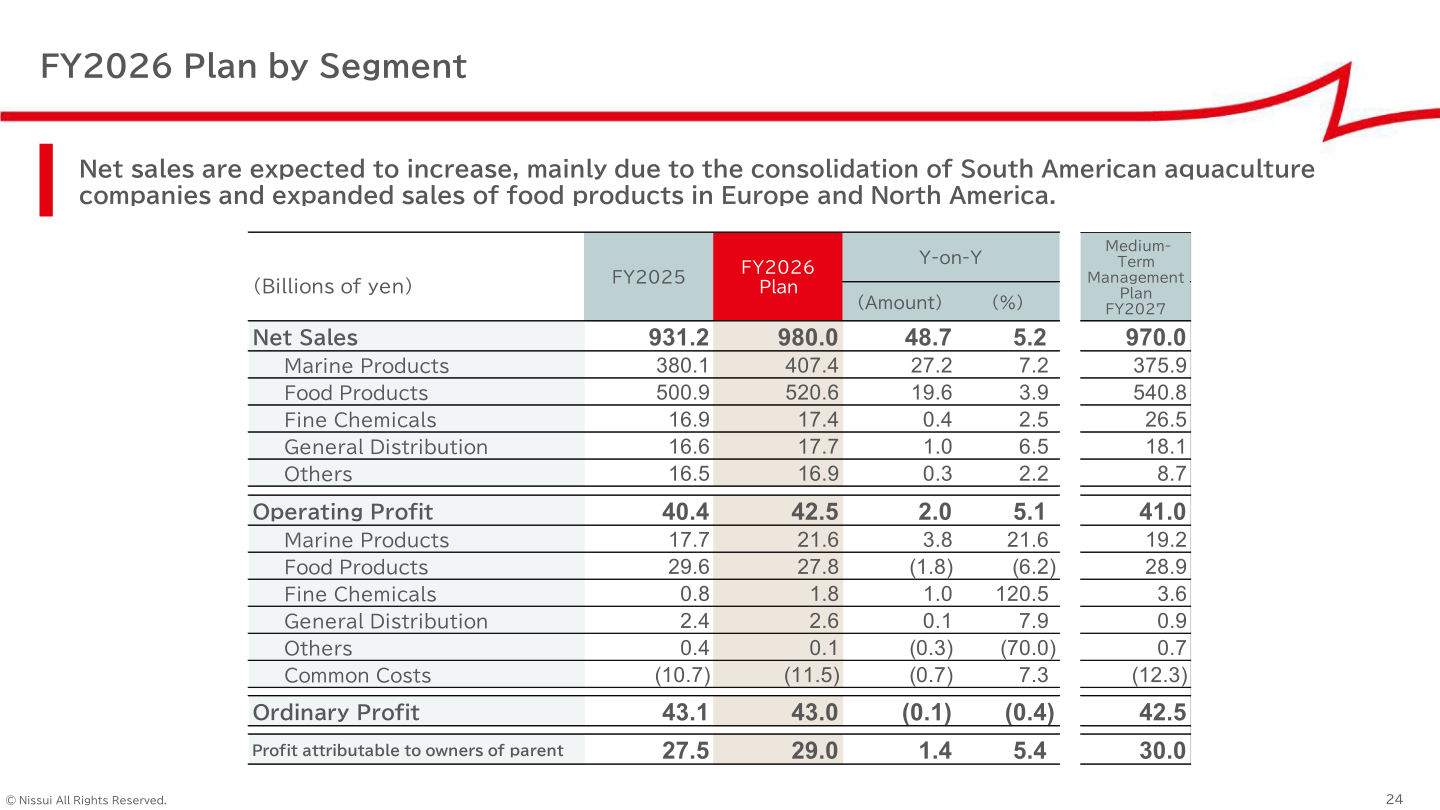
For FY2026, Nissui forecasts consolidated net sales of 980.0 billion yen (+48.7 billion yen, +5.2% year on year) and operating profit of 42.5 billion yen (+2.0 billion yen, +5.1%), while ordinary profit is planned to be roughly flat at 43.0 billion yen (-0.1 billion yen, -0.4%), reflecting higher interest expenses from growth investments. Profit attributable to owners of parent is forecast at 29.0 billion yen (+1.4 billion yen, +5.4%). By segment, Marine Products operating profit is planned to rise 21.6% to 21.6 billion yen on higher South American aquaculture harvest volume and improved earnings at acquired companies, while Food Products operating profit is planned to decline 6.2% to 27.8 billion yen due to new domestic plant-related expenses. Fine Chemicals operating profit is planned to more than double to 1.8 billion yen (+120.5%) on expanded pharmaceutical raw material sales. The plan assumes an exchange rate of 1 USD = 150.00 JPY and does not factor in the potential impact of the situation in the Middle East, which the company states cannot be reasonably estimated at this time.
| Item | FY2025 (Actual) | FY2026 Plan | Y-on-Y (Amount) | Y-on-Y (%) | Medium-Term Plan FY2027 |
|---|---|---|---|---|---|
| Net Sales (billions of yen) | 931.2 | 980.0 | 48.7 | 5.2% | 970.0 |
| Operating Profit (billions of yen) | 40.4 | 42.5 | 2.0 | 5.1% | 41.0 |
| Ordinary Profit (billions of yen) | 43.1 | 43.0 | (0.1) | (0.4%) | 42.5 |
| Profit attributable to owners of parent (billions of yen) | 27.5 | 29.0 | 1.4 | 5.4% | 30.0 |
Shareholder Returns
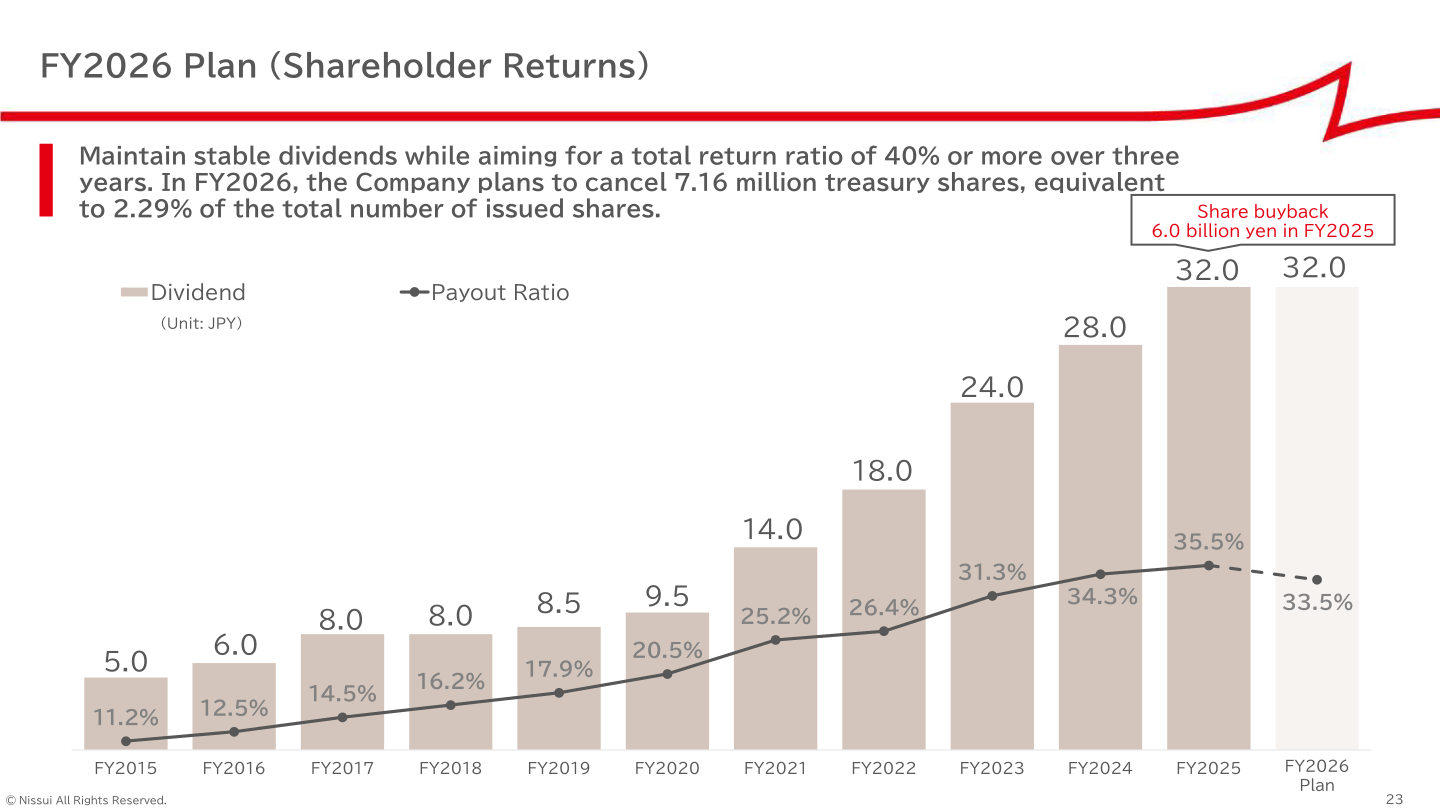
Nissui aims to maintain stable dividends while targeting a total return ratio of 40% or more over three years under its Medium-Term Management Plan through FY2027. The FY2025 total return ratio was 57.4% (up from 34.3% in FY2024), reflecting both a dividend increase and a 6.0 billion yen share buyback during the year; the FY2026 plan total return ratio is 33.5%. The FY2025 dividend payout ratio was 35.5%, and the FY2026 plan dividend payout ratio is 33.5%. In FY2026, the company plans to cancel 7.16 million treasury shares, equivalent to 2.29% of the total number of issued shares.
| Item | FY2024 | FY2025 | FY2026 Plan |
|---|---|---|---|
| Dividend per Share (yen) | 28.0 | 32.0 | 32.0 |
| Dividend Payout Ratio | 34.3% | 35.5% | 33.5% |
| Total Return Ratio | 34.3% | 57.4% | 33.5% |
| Share Buyback (billions of yen) | This cannot be confirmed from the materials. | 6.0 | This cannot be confirmed from the materials. |
Medium-Term Plan / Topics
Under its Medium-Term Management Plan through FY2027, Nissui targets ROIC of 6.0%, ROE of 10.0%, an international net sales ratio of 43.0%, a net D/E ratio of 0.7-0.8, and a total return ratio of 40.0% or more over three years. In the Marine Products Business, the company is expanding its South American aquaculture operations, targeting a production scale of over 80,000 MT (from approximately 30,000 MT) through synergies with the acquired company, with a positive profit impact of approximately USD 40-50 million expected by FY2030 in addition to a recovery from losses. Domestic salmon and trout aquaculture, rebranded as “Nissui Salmon,” is targeted to expand production from approximately 4,100 tons in 2025 to approximately 10,000 tons in 2030, while Japanese amberjack production is targeted to grow from approximately 9,400 tons in 2025 to approximately 16,000 tons in 2030. In the Food Products Business, the company plans capital investment of approximately 35.0 billion yen in a new Kitakyushu plant, with profits expected to recover to pre-investment levels by 2030. FY2026 planned investment totals approximately 83.6 billion yen, up from approximately 64.3 billion yen in FY2025.
This article is an analysis based on publicly available information and is not a recommendation to buy or sell any specific securities. Investment decisions are your own responsibility.
![[Obayashi] Investors’ Guide 2026 — The Complete 24-Article Breakdown](https://japan-equity.com/wp-content/uploads/2026/07/hub_cover-1024x1024.png)
![[Obayashi] IR & SR Policy — Feeding Dialogue Back into Management](https://japan-equity.com/wp-content/uploads/2026/07/p32_sq-1024x1024.jpg)
![[Obayashi] Real Estate Development — 18.7% Margin, ¥287.7bn Unrealized Gains](https://japan-equity.com/wp-content/uploads/2026/07/p20_sq-1024x1024.jpg)
![[Obayashi] Domestic Civil Engineering — Resilience Spending Supports 9.6% Margin](https://japan-equity.com/wp-content/uploads/2026/07/p11_sq-1024x1024.jpg)
![[Obayashi] Share Price & External Ratings — vs TOPIX, ESG Index Inclusion](https://japan-equity.com/wp-content/uploads/2026/07/p40_sq-1024x1024.jpg)
![[Construction] ¥75.5tn Investment, Shrinking Workforce — Big-5 Market Share](https://japan-equity.com/wp-content/uploads/2026/07/p12_sq-1024x1024.jpg)



![[Obayashi] Capital Policy & Shareholder Returns — ROE 10%+, DOE ~5%, ¥100bn Buyback](https://japan-equity.com/wp-content/uploads/2026/07/p27_sq-1024x1024.jpg)
![[Obayashi] Reducing Cross-Shareholdings — ¥285.2bn Sold in Five Years](https://japan-equity.com/wp-content/uploads/2026/07/p29_sq-1024x1024.jpg)
![[Obayashi] ¥750bn Investment Plan — ¥300bn to Development, ¥190bn to Tech/DX](https://japan-equity.com/wp-content/uploads/2026/07/p30_sq-1024x1024.jpg)
![[Obayashi] MTP2022 KPIs — Operating Profit ~2x Target, ROE 14.4%](https://japan-equity.com/wp-content/uploads/2026/07/p25_sq-1024x1024.jpg)
![[Obayashi] Cash Allocation — ¥420bn Investment CF Over Five Years](https://japan-equity.com/wp-content/uploads/2026/07/p26_sq-1024x1024.jpg)
![[Obayashi] Green Energy — 44 Plants, 344MW, and the Green Hydrogen Challenge](https://japan-equity.com/wp-content/uploads/2026/07/p21_sq-1024x1024.jpg)
![[Obayashi] Tackling the Labor Shortage — Robotics Construction®](https://japan-equity.com/wp-content/uploads/2026/07/p14_sq-1024x1024.jpg)
