
This article is based on publicly available IR materials and is not a recommendation to buy or sell any specific securities.
Note: Sundrug’s results presentation labels the fiscal year ended March 2026 as “FY3/26” (and also as “FY2025” on its medium-term plan slide); this article classifies that year as FY2025 in line with our site convention, while all tables and figures below retain the labels used in the source materials.
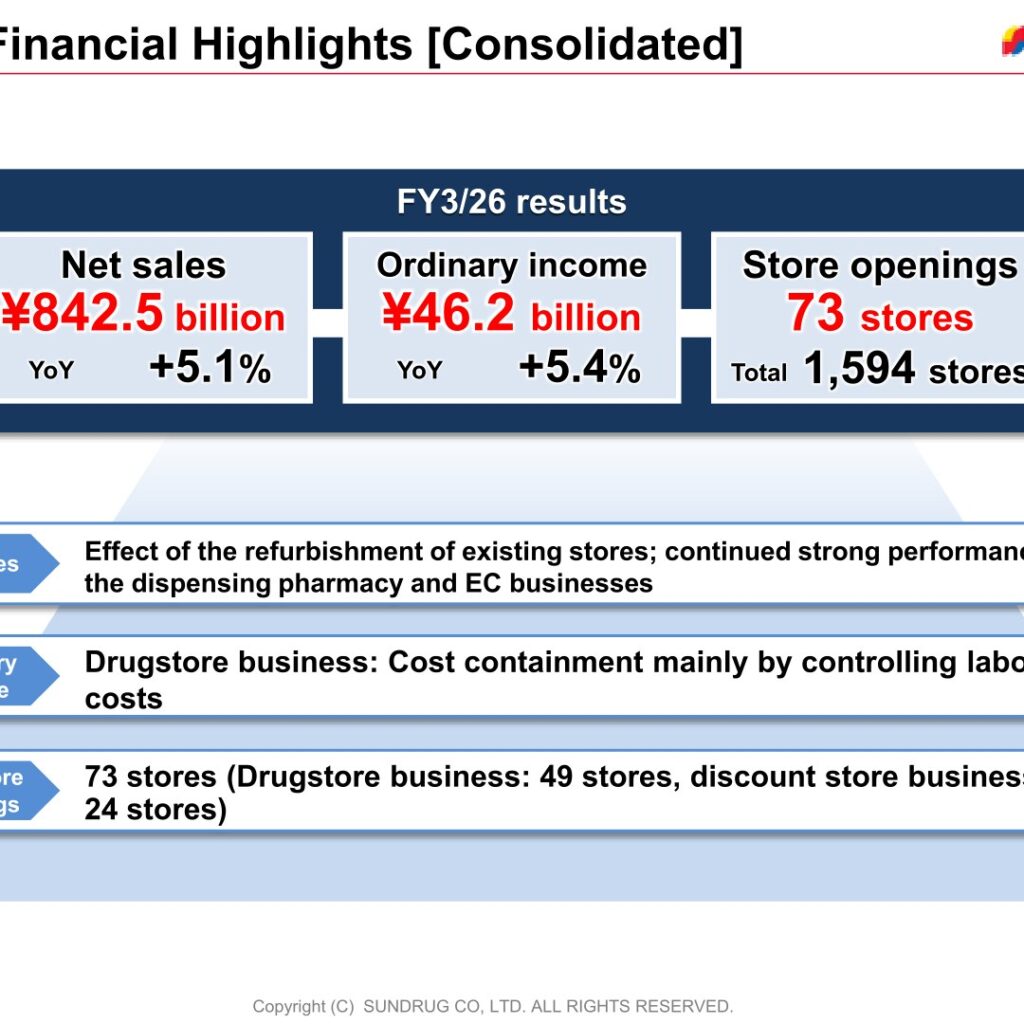
SUNDRUG CO., LTD. reported FY3/26 consolidated net sales of ¥842.5 billion, up 5.1% year on year, and ordinary income of ¥46.2 billion, up 5.4%. The presentation attributes the sales growth to the effect of the refurbishment of existing stores together with continued strong performance in the dispensing pharmacy and EC businesses, while the drugstore business contained costs mainly by controlling labor costs. The Group opened 73 stores during the year (drugstore business 49, discount store business 24) to reach a total of 1,594 stores. For FY3/27 the company guides for net sales of ¥876.0 billion (+4.0%) and operating income of ¥48.8 billion (+4.2%), and plans an annual dividend of ¥132 with the aim of increasing for the 25th consecutive year.
Consolidated Results (Full-Year Actual)
Gross profit rose 5.9% to ¥216,170 million, with the gross margin improving 0.2 pt year on year to 25.7% on improved trade terms since the end of the previous fiscal year. SG&A expenses increased 6.1% to ¥169,338 million, of which labor cost rose 7.4% to ¥72,826 million while selling cost declined 2.6% to ¥4,235 million. Operating income rose 5.2% to ¥46,831 million, ordinary income rose 5.4% to ¥46,220 million, and net income rose 2.1% to ¥31,392 million. Net sales, gross profit and operating income all came in below the company’s own guidance, while ordinary income exceeded it.
| Item (millions of yen) | FY3/26 Results | FY3/25 Results | YoY change | FY3/26 Guidance | Vs. guidance |
|---|---|---|---|---|---|
| Net sales | 842,512 | 801,811 | 5.1% | 850,000 | -0.9% |
| Gross profit | 216,170 | 204,087 | 5.9% | 219,200 | -1.4% |
| SG&A expenses | 169,338 | 159,591 | 6.1% | 171,900 | -1.5% |
| Labor cost | 72,826 | 67,780 | 7.4% | 73,820 | -1.3% |
| Selling cost | 4,235 | 4,349 | -2.6% | 4,560 | -7.1% |
| Administrative expenses | 92,276 | 87,460 | 5.5% | 93,520 | -1.3% |
| Operating income | 46,831 | 44,496 | 5.2% | 47,300 | -1.0% |
| Ordinary income | 46,220 | 43,835 | 5.4% | 46,000 | 0.5% |
| Net income | 31,392 | 30,750 | 2.1% | 31,700 | -1.0% |
Total assets stood at ¥475,505 million at the end of FY3/26 with an equity ratio of 60.1%, against ¥444,007 million and 60.7% a year earlier, as inventories rose ¥11,651 million and tangible fixed assets rose ¥11,781 million. Operating cash flows were ¥43,297 million, investing cash flows -¥32,076 million and financing cash flows -¥5,653 million, lifting the closing cash balance to ¥70,523 million from ¥64,956 million. Capital investment was ¥28,577 million and depreciation and amortization ¥18,875 million.
Results by Business Segment
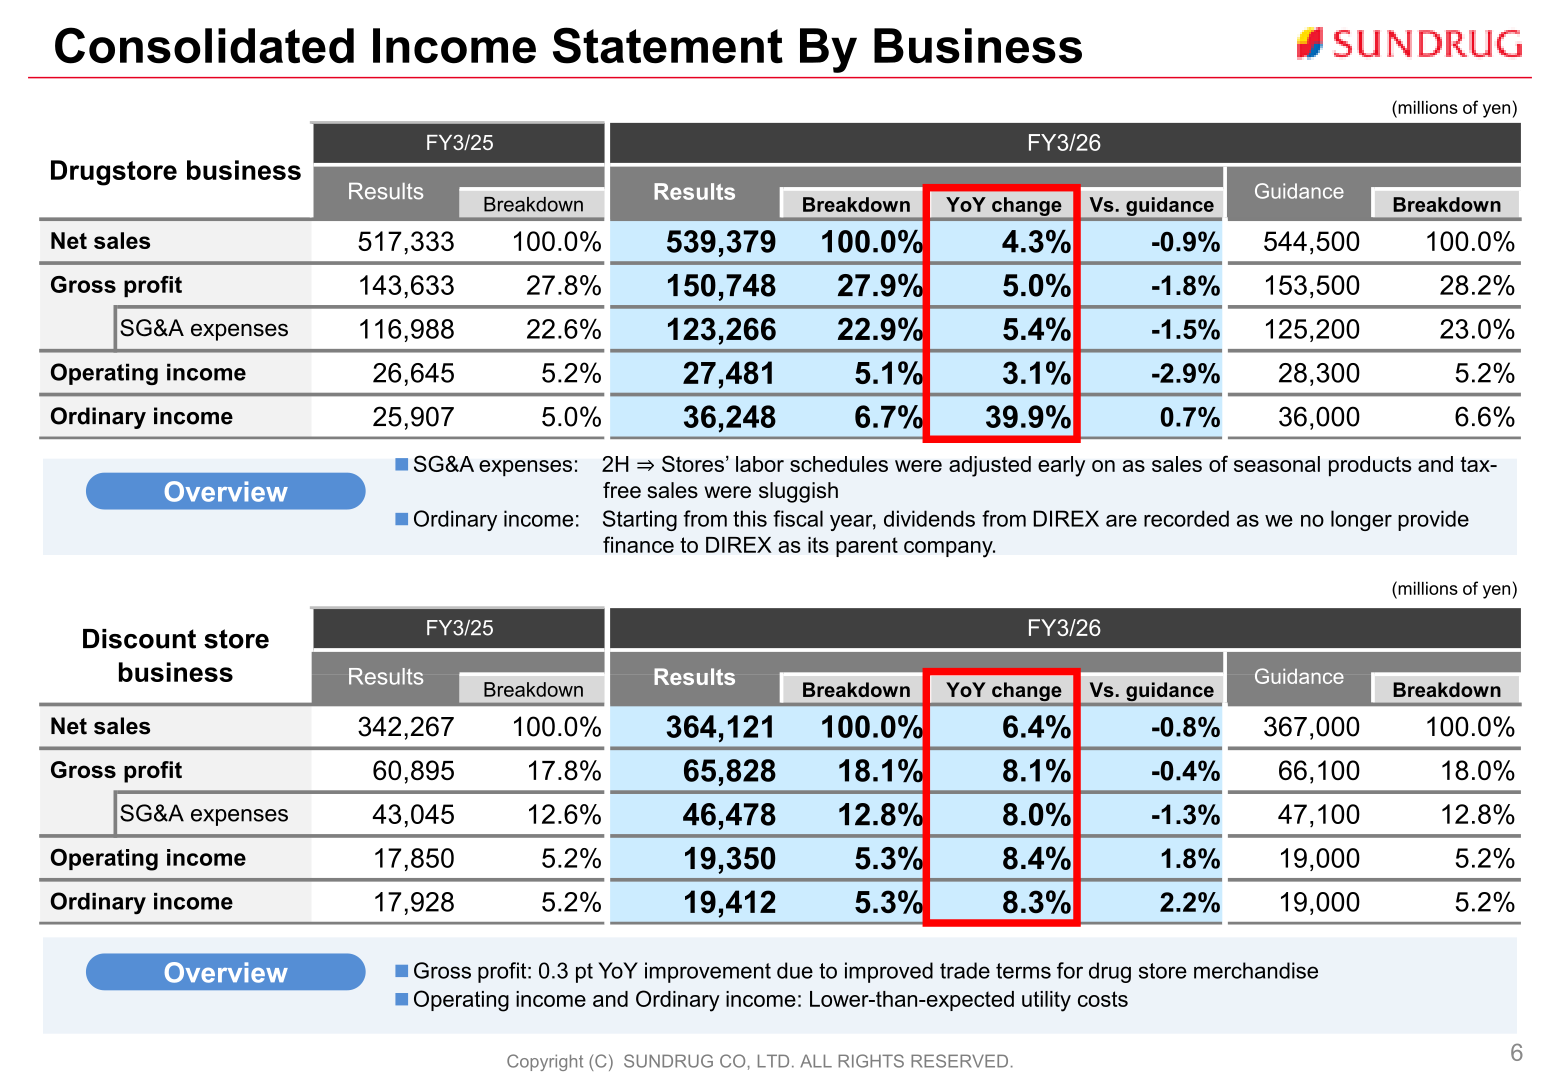
The drugstore business posted net sales of ¥539,379 million (+4.3%) and operating income of ¥27,481 million (+3.1%). Ordinary income jumped 39.9% to ¥36,248 million because, starting from this fiscal year, dividends from DIREX are recorded as the company no longer provides finance to DIREX as its parent company. On SG&A, the presentation notes that in the second half stores’ labor schedules were adjusted early on as sales of seasonal products and tax-free sales were sluggish. The discount store business posted net sales of ¥364,121 million (+6.4%) and operating income of ¥19,350 million (+8.4%), with gross profit improving 0.3 pt year on year on improved trade terms for drug store merchandise, and operating and ordinary income benefiting from lower-than-expected utility costs.
| Business | Item (millions of yen) | FY3/26 Results | FY3/25 Results | YoY change |
|---|---|---|---|---|
| Drugstore business | Net sales | 539,379 | 517,333 | 4.3% |
| Drugstore business | Gross profit | 150,748 | 143,633 | 5.0% |
| Drugstore business | SG&A expenses | 123,266 | 116,988 | 5.4% |
| Drugstore business | Operating income | 27,481 | 26,645 | 3.1% |
| Drugstore business | Ordinary income | 36,248 | 25,907 | 39.9% |
| Discount store business | Net sales | 364,121 | 342,267 | 6.4% |
| Discount store business | Gross profit | 65,828 | 60,895 | 8.1% |
| Discount store business | SG&A expenses | 46,478 | 43,045 | 8.0% |
| Discount store business | Operating income | 19,350 | 17,850 | 8.4% |
| Discount store business | Ordinary income | 19,412 | 17,928 | 8.3% |
By category, drugstore business net sales were led by Beauty care at ¥156,188 million (29.0% of the business) and Health care at ¥144,974 million (26.9%), while Food grew fastest at ¥100,242 million (+9.4%) and Other rose 7.0% to ¥25,149 million as an expanded product category sold online, including pet supplies and home appliances, contributed to net sales. In the discount store business, Food accounted for ¥249,136 million (68.4% of the business, +8.0%), within which groceries, daily foods and frozen foods rose 9.3% to ¥187,282 million and alcohol rose 4.3% to ¥61,854 million, supported by continued strong performance of rice and luxury grocery items such as coffee and tea.
Store Network and Same-Store Sales
The Group opened 73 stores and closed 21 during FY3/26, for a net increase of 52 stores to 1,594 (drugstore business 1,155, discount store business 439). Closures comprised 4 relocated stores, 2 consolidations, 2 trial stores and 2 stores that changed business categories, among others. Same-store sales for the Group rose 1.2% for the full year (1H: +1.6, 2H: +0.8). The drugstore business gained 0.8% (1H: +0.7, 2H: +0.9), helped by the refurbishment effect and strong performance in the dispensing pharmacy business and the food sector, including strong sales of rice from Japan’s national stockpile, though December was held back by weak sales of cold medicine and other winter seasonal products due to the warm winter. The discount store business gained 1.7% (1H: +2.8, 2H: +0.7) on continued strong performance in the food sector.
FY3/27 Full-Year Guidance
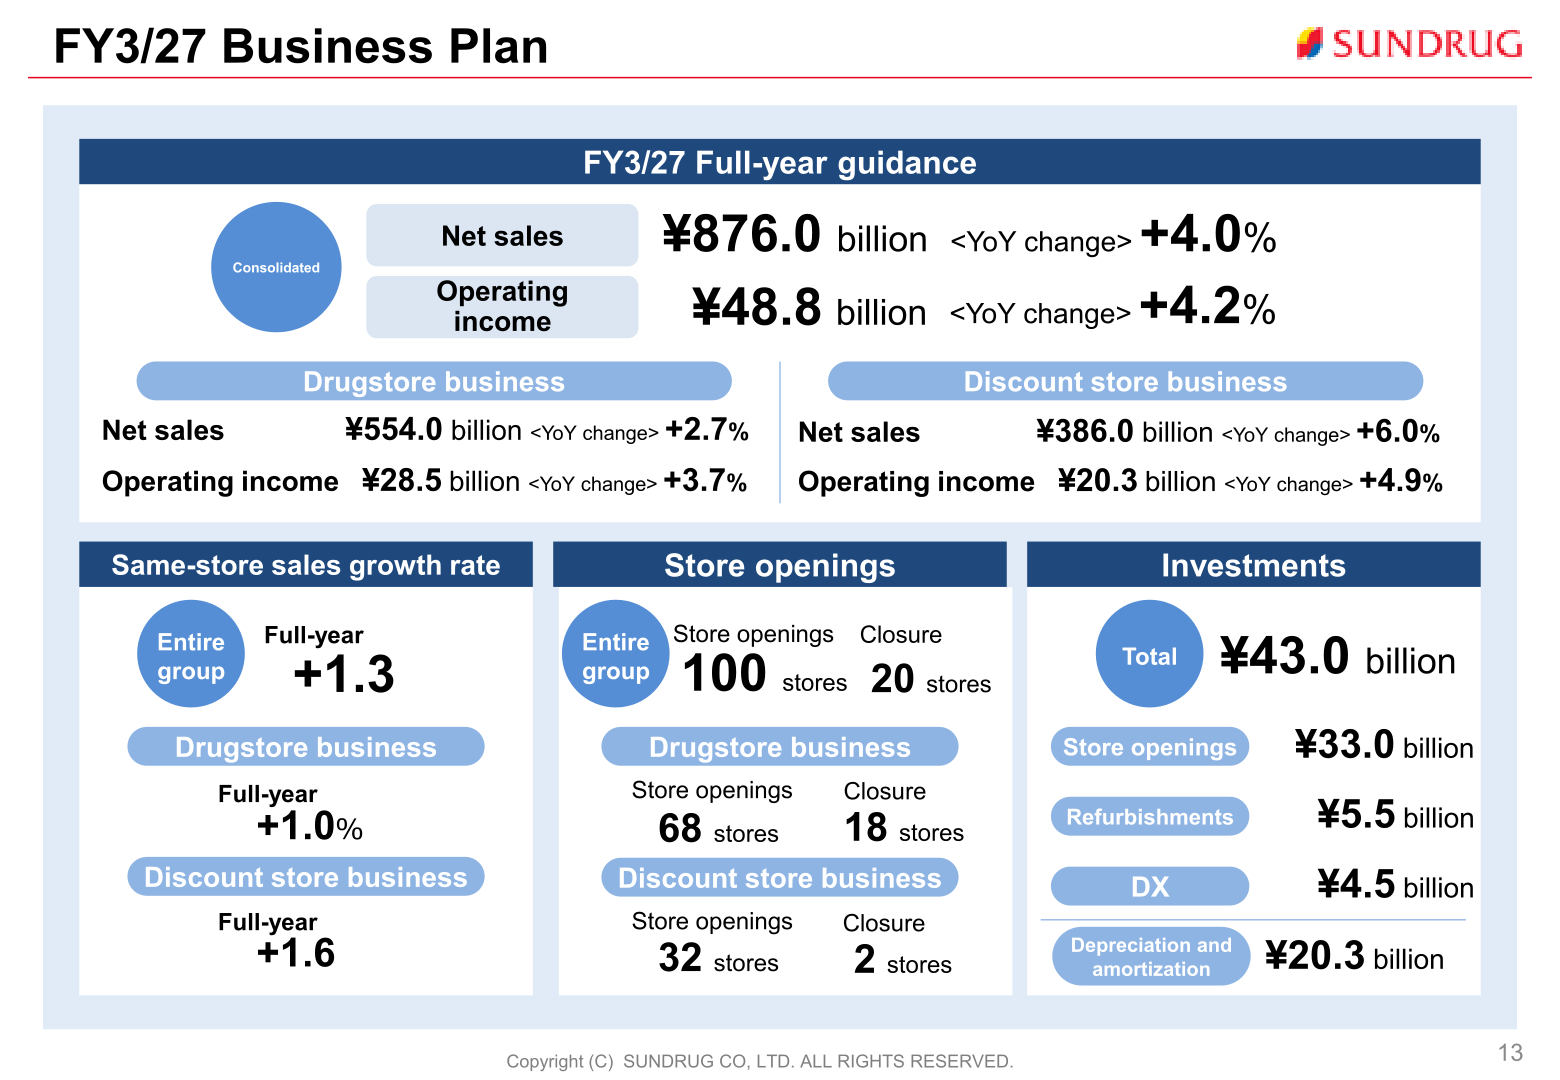
For FY3/27 Sundrug guides for consolidated net sales of ¥876.0 billion and operating income of ¥48.8 billion. Guidance for ordinary income and net income cannot be confirmed from the materials. The company assumes same-store sales growth of +1.3 for the entire group (drugstore business +1.0%, discount store business +1.6) and plans 100 store openings against 20 closures (drugstore business 68 openings and 18 closures; discount store business 32 openings and 2 closures), which the store-openings slide shows reaching 1,205 drugstores and 469 discount stores for a Group total of 1,674 at a net growth rate of 80.0%. Total investment is planned at ¥43.0 billion, comprising ¥33.0 billion for store openings, ¥5.5 billion for refurbishments and ¥4.5 billion for DX, with depreciation and amortization of ¥20.3 billion.
| Item | FY3/27 Guidance | YoY change |
|---|---|---|
| Consolidated net sales | ¥876.0 billion | +4.0% |
| Consolidated operating income | ¥48.8 billion | +4.2% |
| Drugstore business net sales | ¥554.0 billion | +2.7% |
| Drugstore business operating income | ¥28.5 billion | +3.7% |
| Discount store business net sales | ¥386.0 billion | +6.0% |
| Discount store business operating income | ¥20.3 billion | +4.9% |
Shareholder Returns
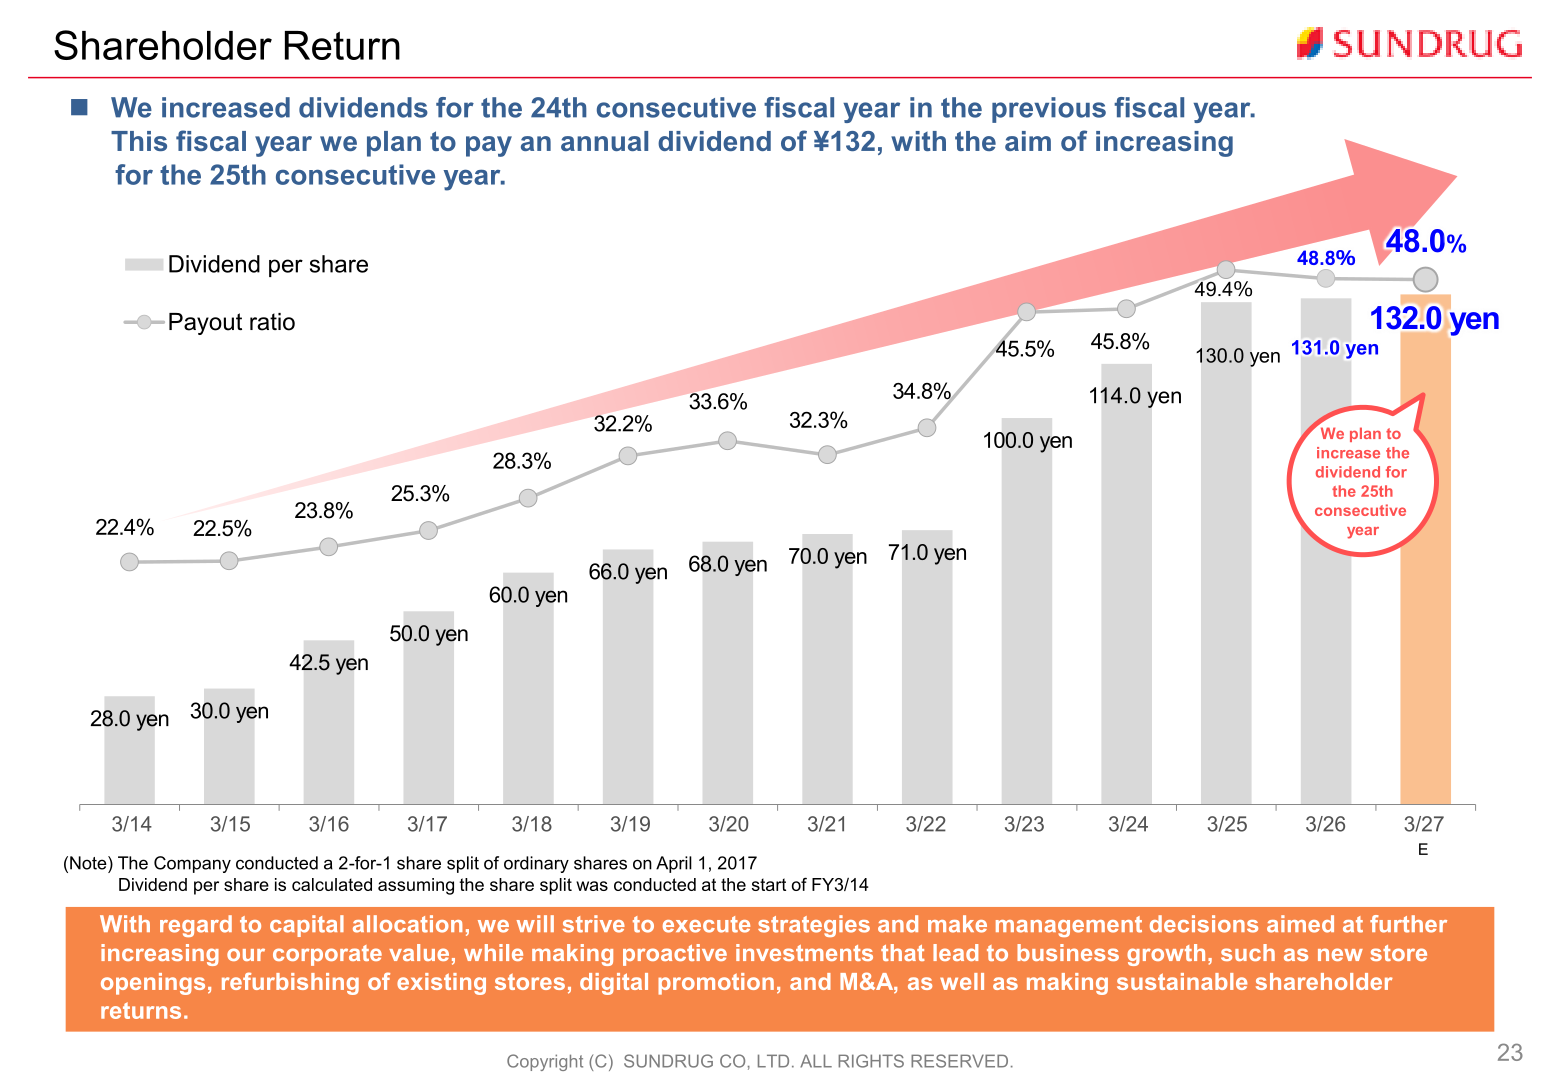
Sundrug increased its dividend for the 24th consecutive fiscal year in FY3/26, paying ¥131.0 per share for a payout ratio of 48.8%. For FY3/27 the company plans an annual dividend of ¥132, with the aim of increasing for the 25th consecutive year, implying a payout ratio of 48.0%. On capital allocation, the company states it will strive to execute strategies and make management decisions aimed at further increasing corporate value, while making proactive investments that lead to business growth, such as new store openings, refurbishing of existing stores, digital promotion and M&A, as well as making sustainable shareholder returns. Note that dividends per share are calculated assuming the 2-for-1 share split of ordinary shares conducted on April 1, 2017 was carried out at the start of FY3/14.
| Fiscal year | Dividend per share | Payout ratio |
|---|---|---|
| FY3/23 | 100.0 yen | 45.5% |
| FY3/24 | 114.0 yen | 45.8% |
| FY3/25 | 130.0 yen | 49.4% |
| FY3/26 | 131.0 yen | 48.8% |
| FY3/27 (E) | 132.0 yen | 48.0% |
Medium-Term Business Plan
Reviewing the previous medium-term business plan, the company reported FY3/26 Group net sales of ¥983.5 billion, Group operating income of ¥50.3 billion, a Group operating margin of 5.1% (5.6% when excluding its capital and business alliance partner) and 2,026 Group stores, where “Group” includes its capital and business alliance partner. Over the five years the plan covered, net sales increased 55.1%, operating income increased 34.9% and the number of stores increased 66.6%, supported by organic growth, the Daiya acquisition and the capital and business alliance with Kirindo Holdings, whose synergies are expected to be realized during the next medium-term business plan. Group net sales nearly reached the ¥1 trillion target, an achievement rate of 99.4% based on the assumptions made when the plan was formulated, while net sales of station-front stores were 70% of the pre-COVID level (a ¥10.0 billion decrease). The operating margin of 5.6% improves to 5.8% if the ¥1.5 billion decrease from station-front stores is excluded, falling short of the 6.0% target by 0.2 pt, and the achievement rate for the number of Group stores including the alliance partner was 115.8%.
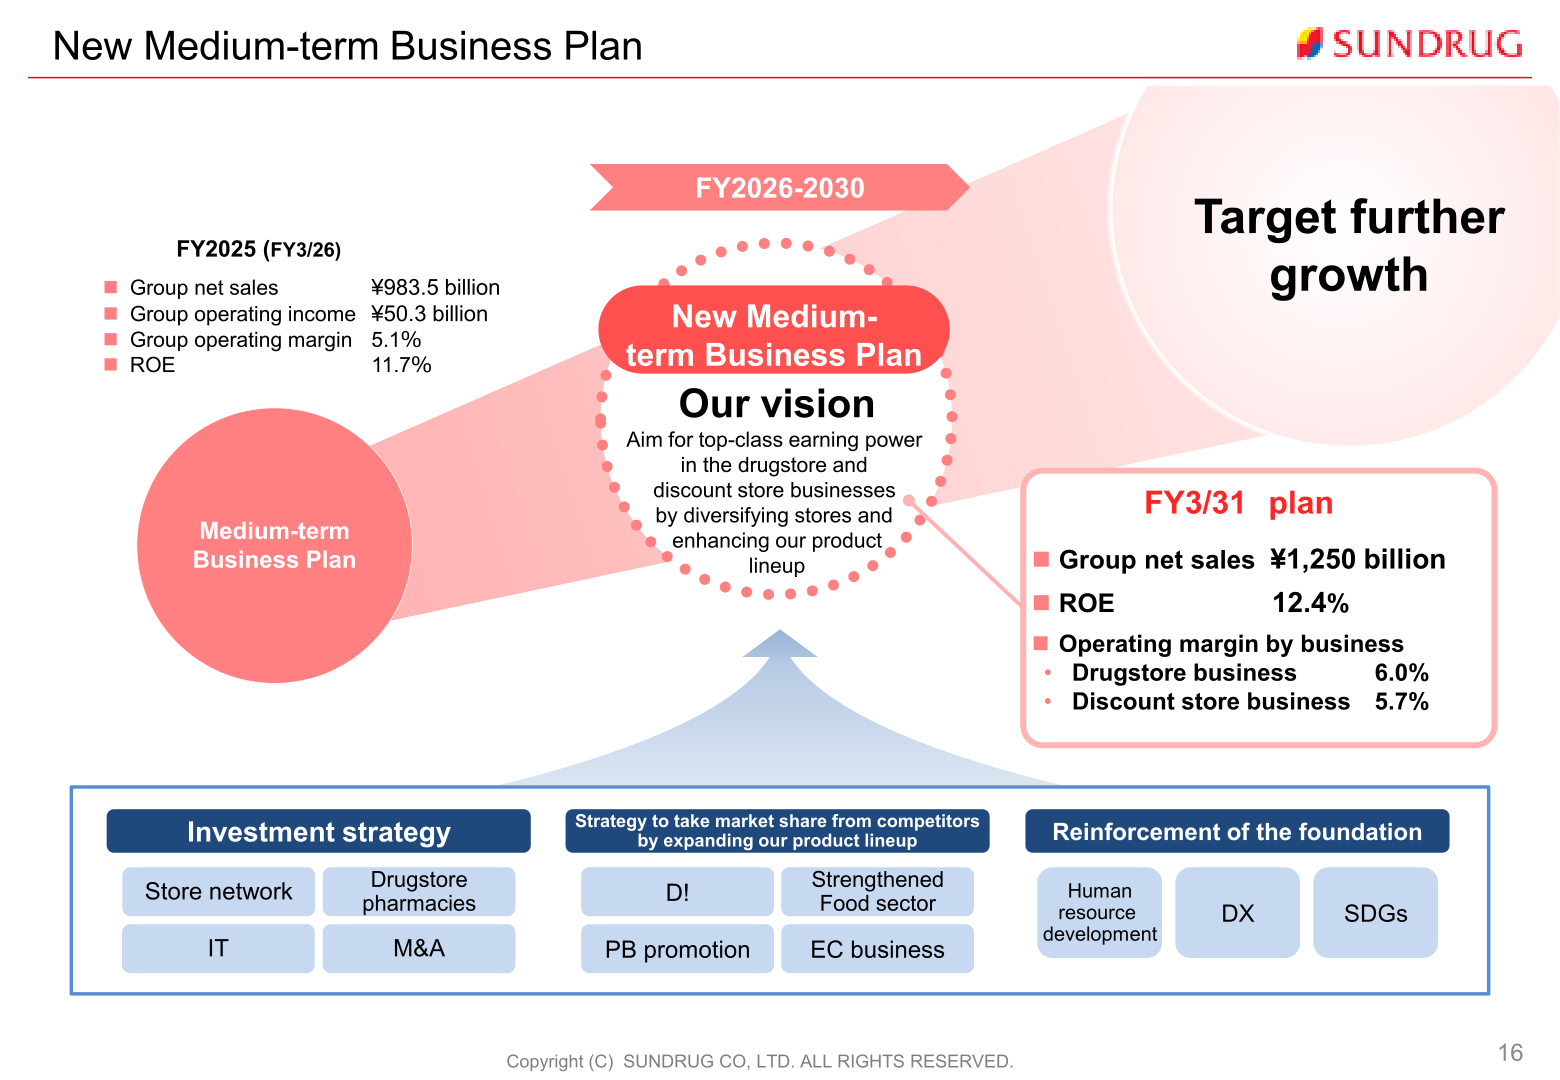
The new medium-term business plan covers FY2026-2030. Against a FY2025 (FY3/26) base of Group net sales of ¥983.5 billion, Group operating income of ¥50.3 billion, a Group operating margin of 5.1% and ROE of 11.7%, the FY3/31 plan targets Group net sales of ¥1,250 billion, ROE of 12.4% and operating margins of 6.0% in the drugstore business and 5.7% in the discount store business. Cash allocation assumes operating cash flows of ¥280.0 billion funding growth investment of ¥220.0 billion alongside shareholder returns and M&A, under a progressive dividend policy with a target payout ratio of 50%. The capital investment plan calls for 60 drugstore openings and 85 refurbishments per year and 40 discount store openings and 15 refurbishments per year, with IT investment including electronic shelf labels at 130 stores per year.
Topics: EC and Dispensing Pharmacy
EC sales were ¥16,811 million in FY3/26 (breakdown 2.0%), up 17.6% year on year, with the number of SKUs handled reaching 74,455, up 26.7%, as the lineup was expanded to include pet supplies, DIY goods and home appliances. The same-day shipping rate was 41.7% and the percentage of deliveries with a drop-off location specified was 37.9% at the main online store, while in-store pickup rose 27.0% year on year. In the dispensing pharmacy business, prescription drug sales were ¥18,918 million (breakdown 2.3%), up 16.8%, and the number of prescriptions reached 2,108,134, up 10.2%, supported by an e-prescription system, a prescription submission app on LINE MINI App and the SOKUYAKU online medication counseling system.
This article is an analysis based on publicly available information and is not a recommendation to buy or sell any specific securities. Investment decisions are your own responsibility.
![[Obayashi] Investors’ Guide 2026 — The Complete 24-Article Breakdown](https://japan-equity.com/wp-content/uploads/2026/07/hub_cover-1024x1024.png)
![[Obayashi] IR & SR Policy — Feeding Dialogue Back into Management](https://japan-equity.com/wp-content/uploads/2026/07/p32_sq-1024x1024.jpg)
![[Obayashi] Real Estate Development — 18.7% Margin, ¥287.7bn Unrealized Gains](https://japan-equity.com/wp-content/uploads/2026/07/p20_sq-1024x1024.jpg)
![[Obayashi] Domestic Civil Engineering — Resilience Spending Supports 9.6% Margin](https://japan-equity.com/wp-content/uploads/2026/07/p11_sq-1024x1024.jpg)
![[Obayashi] Share Price & External Ratings — vs TOPIX, ESG Index Inclusion](https://japan-equity.com/wp-content/uploads/2026/07/p40_sq-1024x1024.jpg)
![[Construction] ¥75.5tn Investment, Shrinking Workforce — Big-5 Market Share](https://japan-equity.com/wp-content/uploads/2026/07/p12_sq-1024x1024.jpg)



![[Obayashi] Capital Policy & Shareholder Returns — ROE 10%+, DOE ~5%, ¥100bn Buyback](https://japan-equity.com/wp-content/uploads/2026/07/p27_sq-1024x1024.jpg)
![[Obayashi] Reducing Cross-Shareholdings — ¥285.2bn Sold in Five Years](https://japan-equity.com/wp-content/uploads/2026/07/p29_sq-1024x1024.jpg)
![[Obayashi] ¥750bn Investment Plan — ¥300bn to Development, ¥190bn to Tech/DX](https://japan-equity.com/wp-content/uploads/2026/07/p30_sq-1024x1024.jpg)
![[Obayashi] MTP2022 KPIs — Operating Profit ~2x Target, ROE 14.4%](https://japan-equity.com/wp-content/uploads/2026/07/p25_sq-1024x1024.jpg)
![[Obayashi] Cash Allocation — ¥420bn Investment CF Over Five Years](https://japan-equity.com/wp-content/uploads/2026/07/p26_sq-1024x1024.jpg)
![[Obayashi] Green Energy — 44 Plants, 344MW, and the Green Hydrogen Challenge](https://japan-equity.com/wp-content/uploads/2026/07/p21_sq-1024x1024.jpg)
![[Obayashi] Tackling the Labor Shortage — Robotics Construction®](https://japan-equity.com/wp-content/uploads/2026/07/p14_sq-1024x1024.jpg)
