
This article is based on publicly available IR materials and is not a recommendation to buy or sell any specific securities.
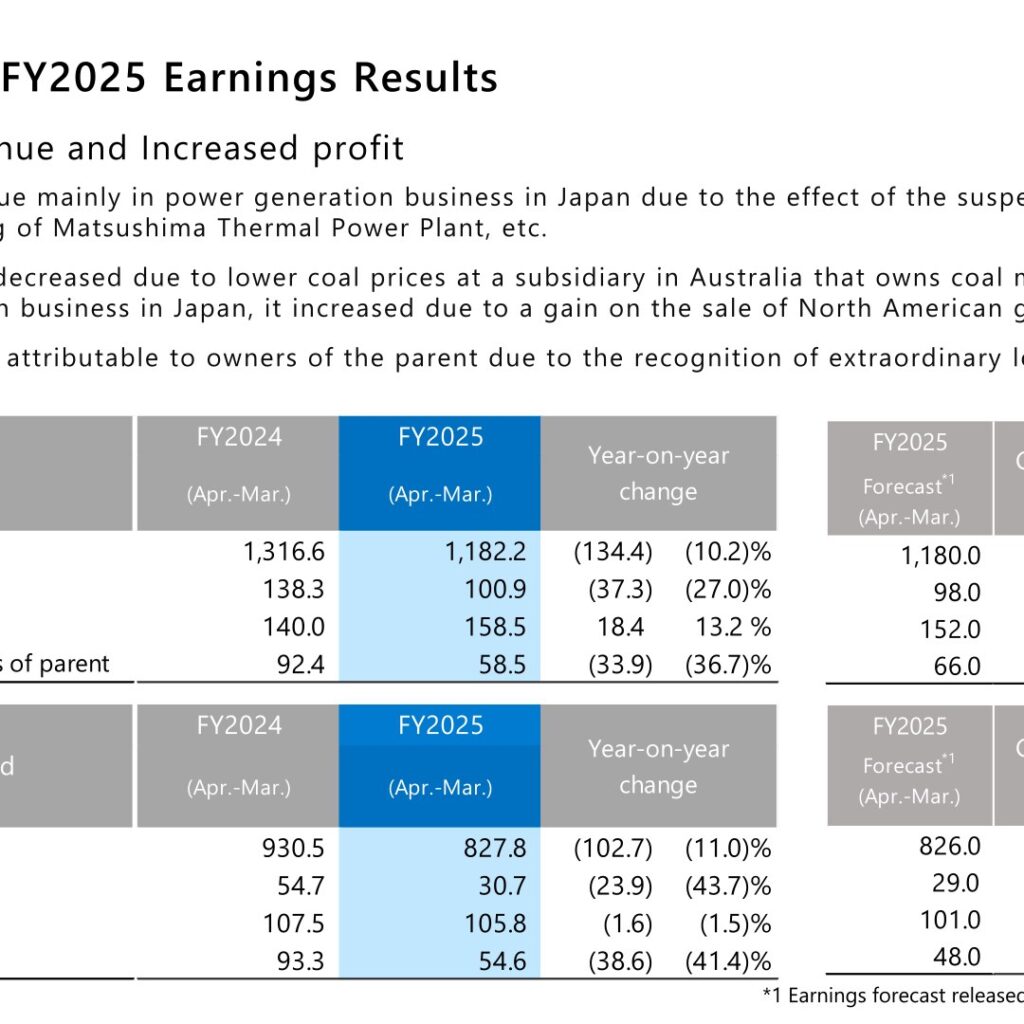
J-POWER (Electric Power Development Co., Ltd.) reported consolidated operating revenue of 1,182.2 billion yen for FY2025 (April 2025 to March 2026), down 134.4 billion yen or 10.2% year on year, with operating profit of 100.9 billion yen, down 27.0%. Ordinary profit rose 13.2% to 158.5 billion yen, while profit attributable to owners of parent fell 36.7% to 58.5 billion yen. The company describes the year as “Decreased revenue and Increased profit”: revenue declined mainly in the domestic power generation business due to the effect of the suspension and decommissioning of the Matsushima Thermal Power Plant, while ordinary profit was lifted by a gain on the sale of North American gas-fired power equity.
Consolidated Results (Full-Year Actual)
All figures are consolidated unless stated otherwise, and are shown in billion yen. The presentation notes that amounts of less than 100 million yen and electric power sales volume of less than 100 million kWh in the consolidated financial data have been rounded down, so the sum of individual amounts may not agree with the totals. Results came in ahead of the forecast released on March 31, 2026 at the revenue, operating profit and ordinary profit lines, but below it for profit attributable to owners of parent.
| Item (billion yen) | FY2024 (Apr.-Mar.) | FY2025 (Apr.-Mar.) | Year-on-year change | FY2025 Forecast (released March 31, 2026) | Comparison with the forecast |
|---|---|---|---|---|---|
| Operating Revenue | 1,316.6 | 1,182.2 | (134.4) / (10.2)% | 1,180.0 | 2.2 / 0.2 % |
| Operating Profit | 138.3 | 100.9 | (37.3) / (27.0)% | 98.0 | 2.9 / 3.1 % |
| Ordinary Profit | 140.0 | 158.5 | 18.4 / 13.2 % | 152.0 | 6.5 / 4.3 % |
| Profit attributable to owners of parent | 92.4 | 58.5 | (33.9) / (36.7)% | 66.0 | (7.4) / (11.3)% |
On a non-consolidated basis, operating revenue was 827.8 billion yen (down 11.0%), operating profit 30.7 billion yen (down 43.7%), ordinary profit 105.8 billion yen (down 1.5%) and profit 54.6 billion yen (down 41.4%). In the consolidated revenue and expense comparison, non-operating revenue increased 57.4 billion yen to 97.3 billion yen, of which share of profit of entities accounted for using equity method rose to 63.8 billion yen from 14.4 billion yen. Extraordinary losses of 51.8 billion yen were recorded in FY2025 against none in FY2024, which the company cites as the reason profit attributable to owners of parent declined.
Electric Power Sales
Electric power sales volume is disclosed separately from the financial figures. Sales volume in the power generation business was 66.7 TWh, down 1.7% year on year, while overseas business volume (consolidated subsidiaries only; electric power sales volume of equity method affiliated companies is not included) fell 19.5% to 14.4 TWh.
| Electric Power Sales (TWh) | FY2024 (Apr.-Mar.) | FY2025 (Apr.-Mar.) | Year-on-year change |
|---|---|---|---|
| Power generation business | 67.8 | 66.7 | (1.1) / (1.7)% |
| Renewable Energy | 10.0 | 9.8 | (0.2) / (2.6)% |
| Hydroelectric Power | 8.6 | 8.3 | (0.3) / (3.5)% |
| Wind Power | 1.3 | 1.3 | 0.0 / 0.3 % |
| Geothermal Power and Solar Power | 0.1 | 0.1 | 0.0 / 41.9 % |
| Thermal Power | 41.2 | 41.8 | 0.6 / 1.5 % |
| Other (procured from wholesale electricity market, etc.) | 16.5 | 15.0 | (1.5) / (9.3)% |
| Overseas business (consolidated subsidiaries) | 17.9 | 14.4 | (3.5) / (19.5)% |
| Water supply rate | 91% | 88% | (3points) |
| Load factor | 58% | 67% | +9points |
Segment Results
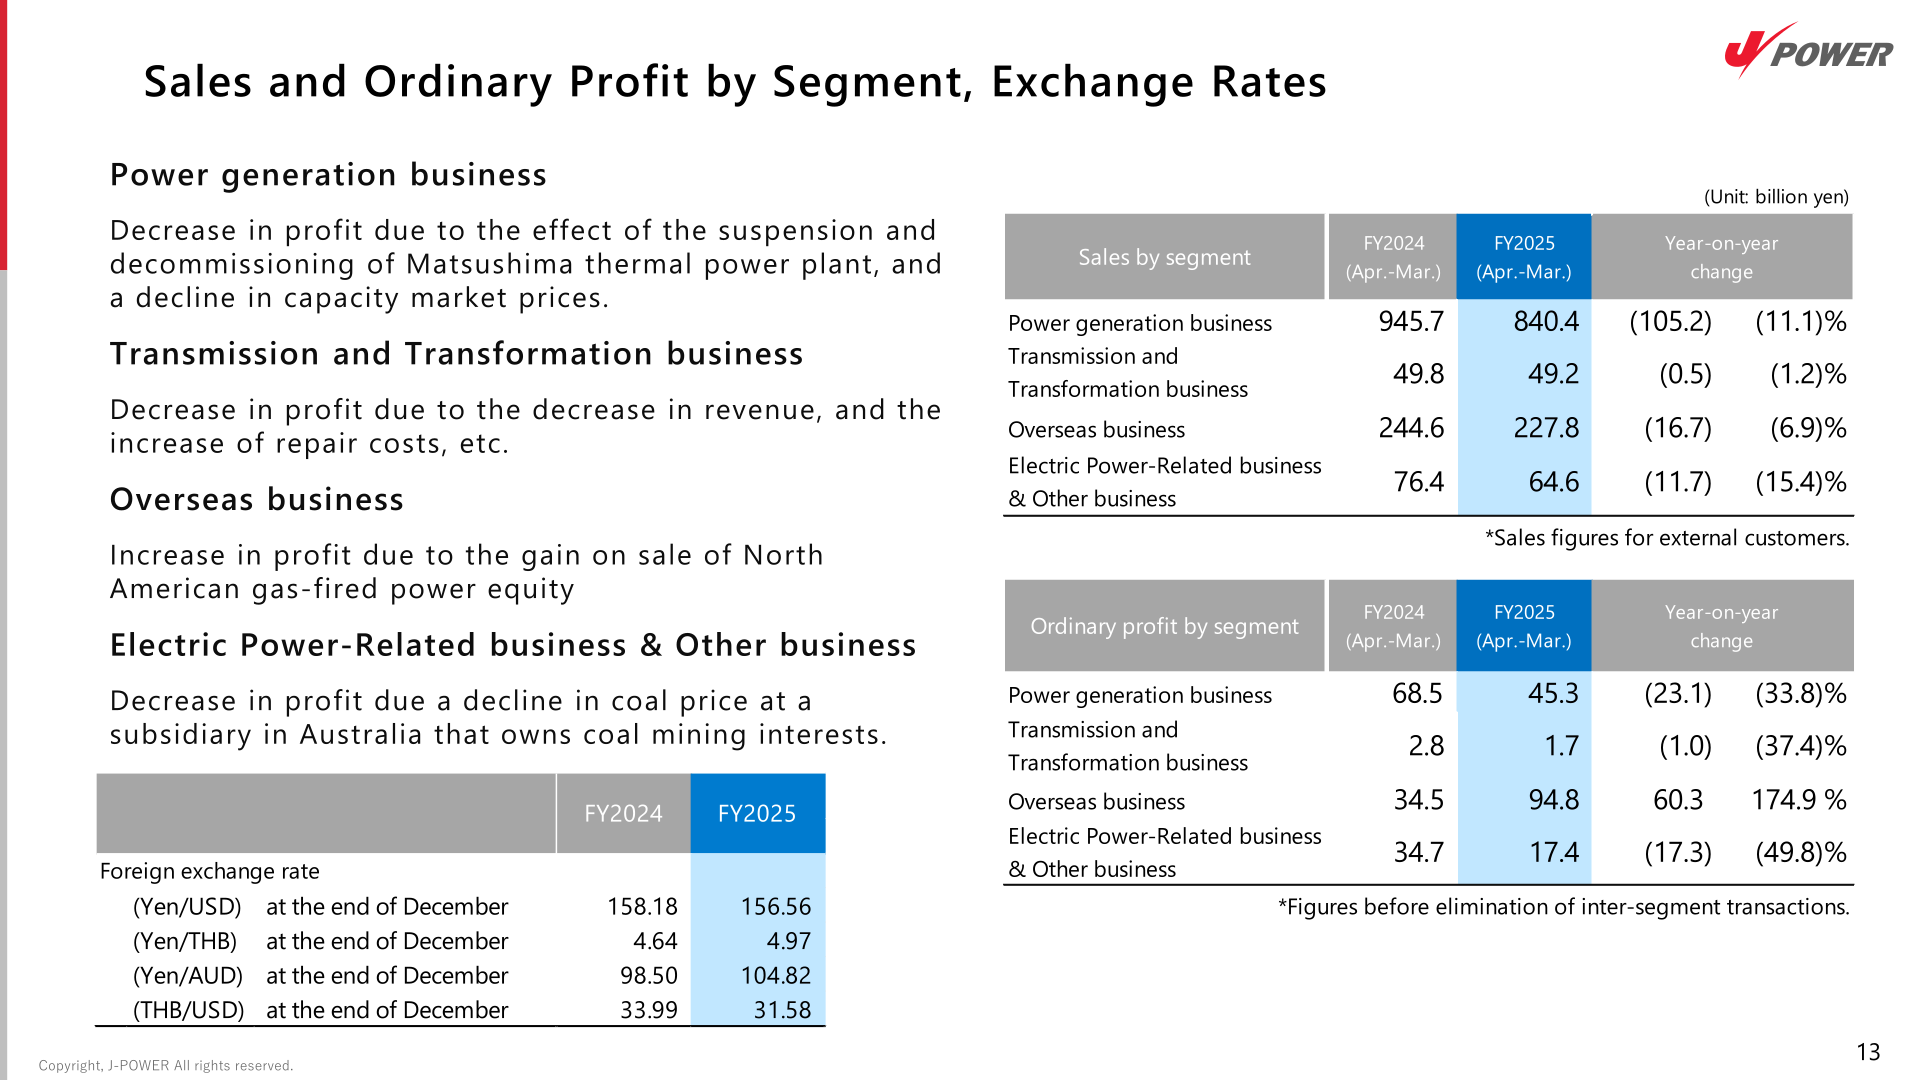
Sales figures below are for external customers and ordinary profit figures are before elimination of inter-segment transactions. Power generation profit fell on the suspension and decommissioning of the Matsushima thermal power plant and a decline in capacity market prices; the transmission and transformation business declined on lower revenue and higher repair costs; the overseas business rose sharply on the gain on sale of North American gas-fired power equity; and the electric power-related and other businesses fell on a decline in coal price at a subsidiary in Australia that owns coal mining interests.
| Segment (billion yen) | Sales FY2024 | Sales FY2025 | Ordinary profit FY2024 | Ordinary profit FY2025 |
|---|---|---|---|---|
| Power generation business | 945.7 | 840.4 | 68.5 | 45.3 |
| Transmission and Transformation business | 49.8 | 49.2 | 2.8 | 1.7 |
| Overseas business | 244.6 | 227.8 | 34.5 | 94.8 |
| Electric Power-Related business & Other business | 76.4 | 64.6 | 34.7 | 17.4 |
The breakdown of the increase and decrease factors of consolidated ordinary profit shows the overseas business contributing +55.0 billion yen, within which share of profit of entities accounted for using equity method added +53.0 billion yen, including +58.0 billion yen from the gain on sale of North American gas-fired power equity and (5.0) billion yen from Batang, Triton Knoll and others. Offsetting items included the power generation business (“Thermal Power” and “Other”) at (18.0) billion yen, power generation business other expenses at (11.0) billion yen, and electric power-related business, other business and consolidated adjustments at (14.0) billion yen on lower coal sales prices at the Australian coal-mining subsidiary. Foreign exchange gains or losses added +9.0 billion yen. For reference, the presentation cites a JEPX average price of approximately 12 yen/kWh in FY2024 versus approximately 11 yen/kWh in FY2025, and an Australian thermal coal spot price of approximately USD135/t versus approximately USD105/t.
Financial Position
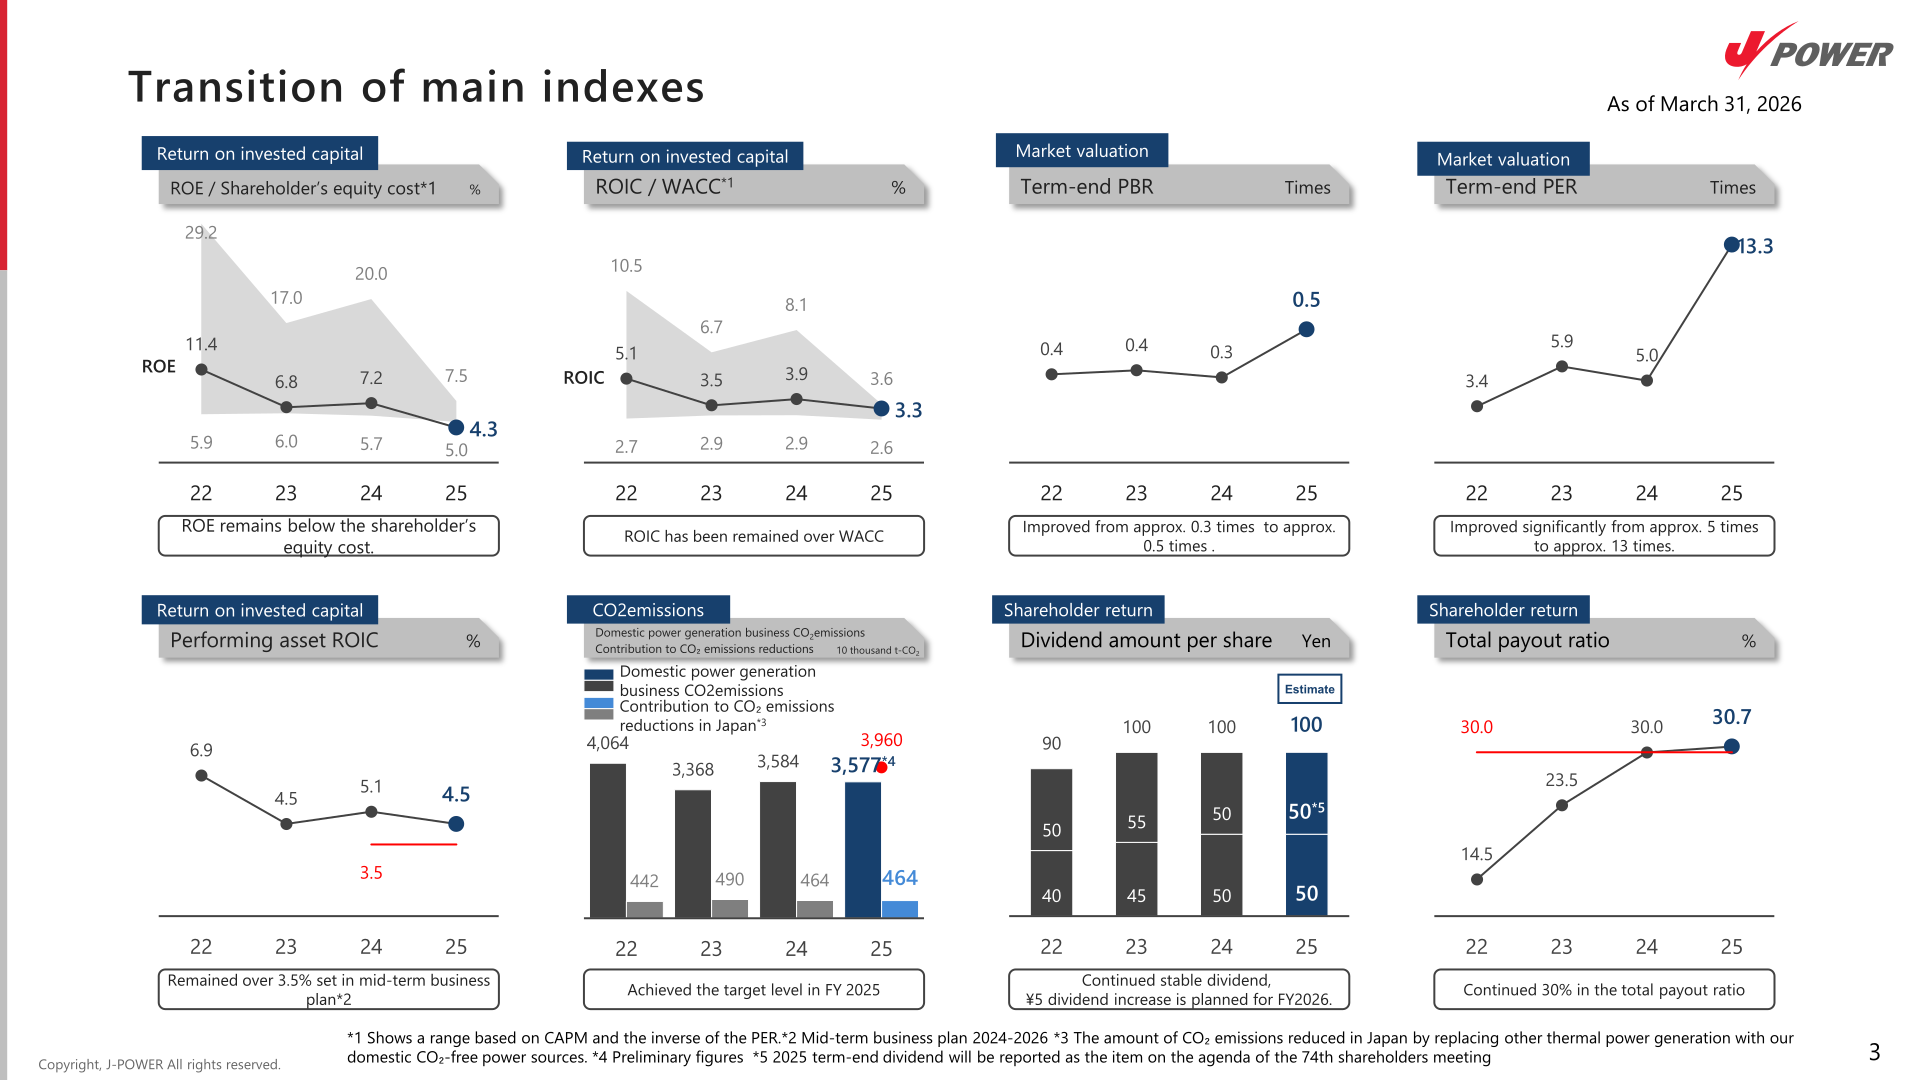
Total assets stood at 3,739.7 billion yen at the end of FY2025, up 70.9 billion yen from the prior year end, with construction in progress rising 81.5 billion yen to 774.9 billion yen and nuclear fuel at 78.3 billion yen. Interest-bearing debt was 1,883.2 billion yen and total net assets 1,534.4 billion yen. The D/E ratio improved to 1.3 times from 1.4 times and the shareholders equity ratio to 37.6% from 36.4%. Key ratios for FY2025 include ROE of 4.3%, EPS of 325.51 yen, BPS of 7,985.24 yen and performing assets ROIC of 4.5%.
FY2026 Forecast
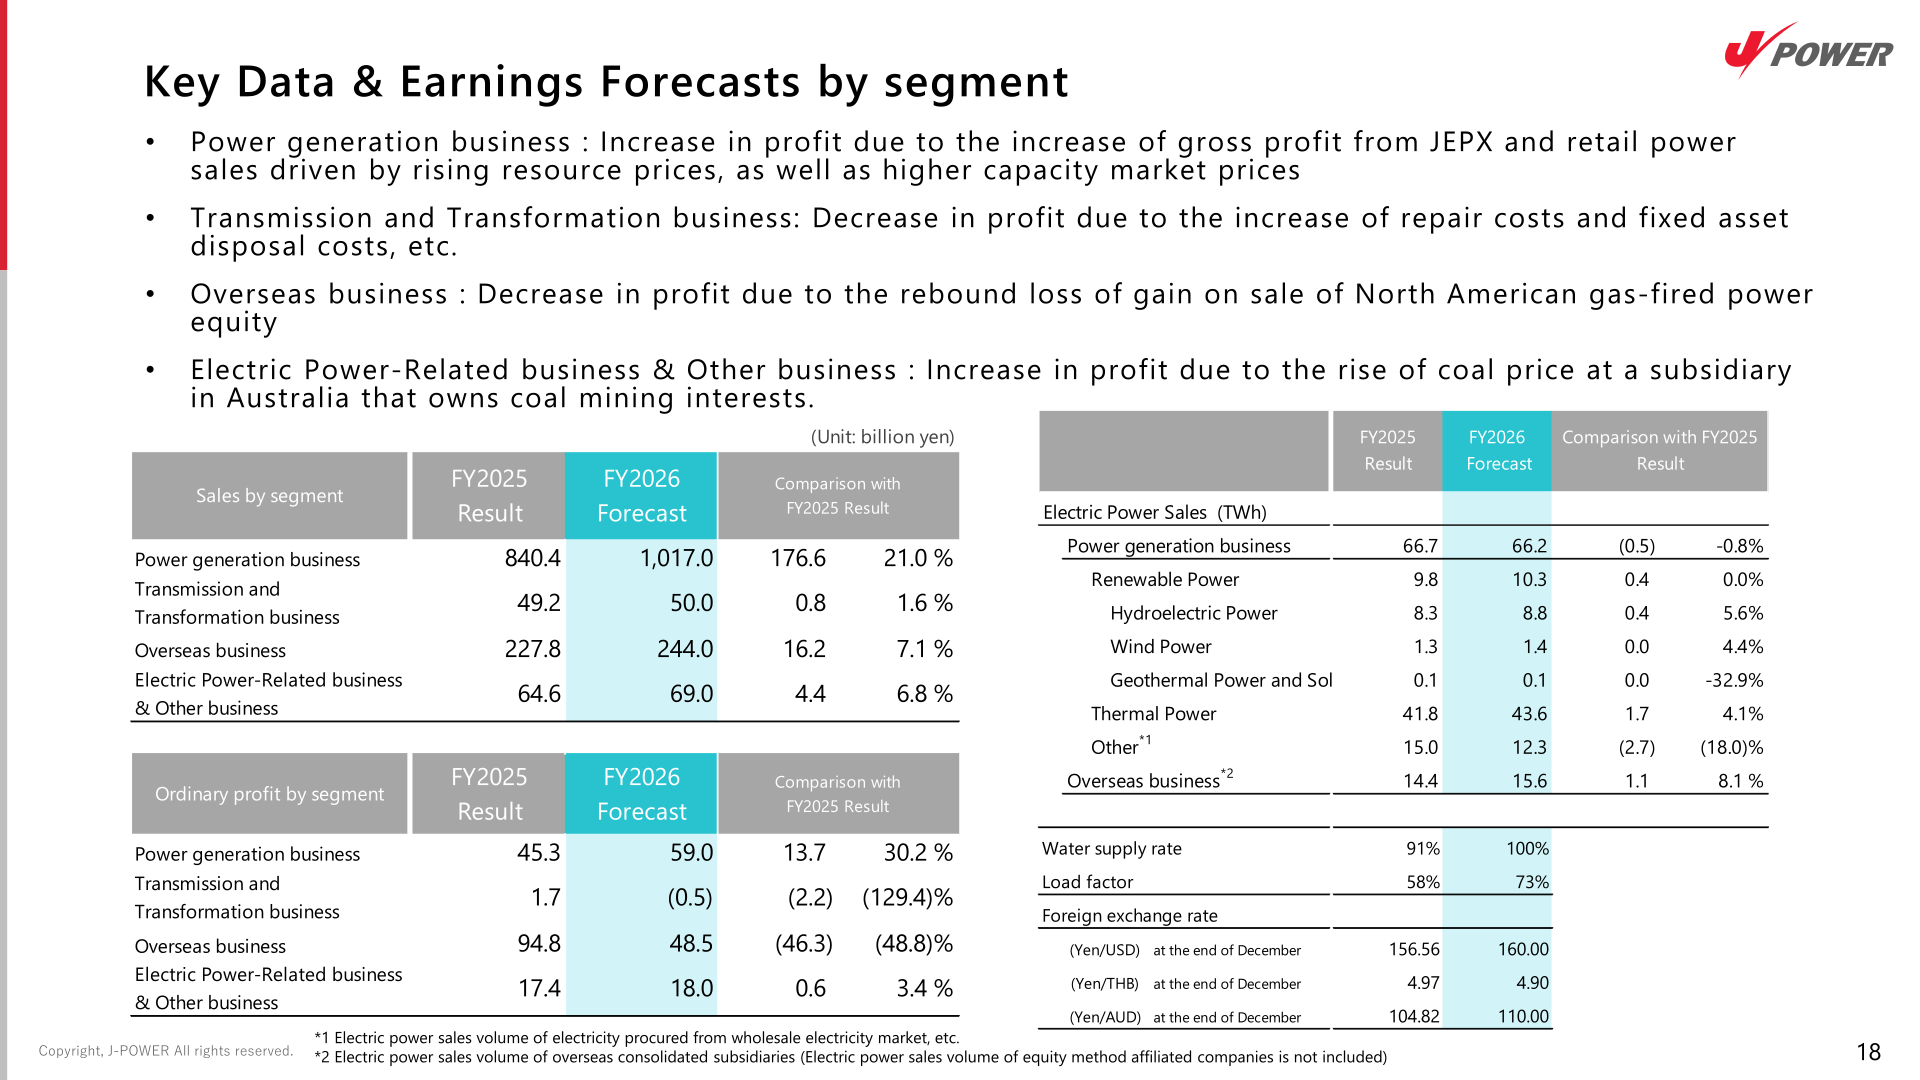
For FY2026 the company forecasts higher revenue and higher operating profit but lower ordinary profit, as the gain on the sale of the North American gas-fired power equity interest does not recur, while profit is expected to increase driven by rising commodity prices in the domestic power generation business and at the subsidiary in Australia that owns coal mining interests. Profit attributable to owners of parent is forecast to rise to 81.0 billion yen.
| Item (billion yen) | FY2025 Result | FY2026 Forecast | Change |
|---|---|---|---|
| Operating Revenue | 1,182.2 | 1,380.0 | 197.7 / 16.7 % |
| Operating Profit | 100.9 | 125.0 | 24.0 / 23.8 % |
| Ordinary Profit | 158.5 | 125.0 | (33.5) / (21.2)% |
| Profit attributable to owners of parent | 58.5 | 81.0 | 22.4 / 38.4 % |
| Ordinary profit – Power generation business | 45.3 | 59.0 | 13.7 / 30.2 % |
| Ordinary profit – Transmission and Transformation business | 1.7 | (0.5) | (2.2) / (129.4)% |
| Ordinary profit – Overseas business | 94.8 | 48.5 | (46.3) / (48.8)% |
| Ordinary profit – Electric Power-Related business & Other business | 17.4 | 18.0 | 0.6 / 3.4 % |
Electric power sales in the power generation business are forecast at 66.2 TWh against 66.7 TWh in FY2025, with thermal power at 43.6 TWh, renewable power at 10.3 TWh and overseas business at 15.6 TWh. Assumed foreign exchange rates at the end of December are 160.00 yen/USD, 4.90 yen/THB and 110.00 yen/AUD. The reference assumptions are a JEPX average price of approximately 14 to 20 yen/kWh and an Australian thermal coal spot price of approximately USD140/t. The largest negative swing factor for ordinary profit is the overseas business at (40.0) billion yen, reflecting the rebound loss of the gain on sale of North American gas-fired power equity of (53.5) billion yen, partly offset by +13.0 billion yen from renewable energy in the power generation business and +9.0 billion yen from thermal power and other.
Shareholder Returns
The dividend amount per share for FY2025 is shown as 100 yen, consisting of an interim dividend of 50 yen and a term-end dividend of 50 yen; the presentation notes that the FY2025 term-end dividend will be reported as an item on the agenda of the 74th shareholders meeting. The total payout ratio was 30.7%, and the company states it has continued a 30% total payout ratio. The presentation also states that a stable dividend has been continued and that a 5 yen dividend increase is planned for FY2026. J-POWER has posted a revised version of this presentation after identifying an error in the FY2026 dividend forecast; the figures used here are from that revised version.
| Item | FY2022 | FY2023 | FY2024 | FY2025 |
|---|---|---|---|---|
| Interim dividend (yen) | 40 | 45 | 50 | 50 |
| Term-end dividend (yen) | 50 | 55 | 50 | 50 |
| Dividend amount per share (yen) | 90 | 100 | 100 | 100 |
| Total payout ratio (%) | 14.5 | 23.5 | 30.0 | 30.7 |
Capital Allocation and Corporate Value Initiatives
The allocation planning for 2024-2026 was updated from the May 9, 2025 version. Cash in now comprises business cash flow of 6,900 hundred million yen (down 300), including the sales profit of gas fired power plants in the North America, and financing etc. of 900 hundred million yen (up 500). Cash out comprises investing cash flow of 7,050 hundred million yen (up 200) and shareholder return of 750 hundred million yen (unchanged). Within the investing cash flow breakdown, strategic investment covers global renewable energy development at 2,500 hundred million yen (up 200), electric power network enhancement at 950 hundred million yen (up 300) and thermal power transition at 50 hundred million yen (down 250), alongside hydro/thermal power and transmission-transformation replacement investment and others at 2,400 hundred million yen (unchanged) and nuclear power at 1,150 hundred million yen (down 50).
On corporate value, the company states that ROE was below the shareholders equity cost in FY2025 while ROIC has remained over WACC, that term-end PBR improved from approximately 0.3 times to approximately 0.5 times, and that term-end PER improved significantly from approximately 5 times to approximately 13 times. Total ROIC was 3.3% in FY2025 against 3.9% in FY2024, with segment ROIC of 4.7% for the power generation business, 2.0% for transmission-transformation of electric energy, 9.9% for business related to electric power, 8.9% for the overseas business and 9.8% for other businesses. Domestic power generation business CO2 emissions were 3,577 ten thousand t-CO2 on a preliminary basis, and the contribution to CO2 emissions reductions in Japan was 464 ten thousand t-CO2.
Ohma Nuclear Power Project
The Ohma Nuclear Power Plant is located in Ohma-machi, Shimokita-gun, Aomori Prefecture, uses enriched uranium and mixed uranium-plutonium oxide (MOX) fuel, has electric-generating power of 1,383 MW and is an Advanced Boiling Water Reactor (ABWR). The time of starting operation is not yet determined. The company is dealing with the plant inspection under the conformity inspection, which started in June 2025, and at the site preparatory construction such as site development is underway within the scope unaffected by the new regulatory standards as of the end of March 2026. J-POWER states it aims to commence safety enhancement construction at an early stage by correctly dealing with the conformity inspection, and is promoting the project while giving the highest priority to the security of safety, taking into consideration the use of the long-term decarbonized power source auction system. Toward the next management plan, the company plans to disclose as comprehensively as possible the investment scale, construction period, financial impact during the construction period and earnings contribution after starting of operation.
This article is an analysis based on publicly available information and is not a recommendation to buy or sell any specific securities. Investment decisions are your own responsibility.
![[Obayashi] Investors’ Guide 2026 — The Complete 24-Article Breakdown](https://japan-equity.com/wp-content/uploads/2026/07/hub_cover-1024x1024.png)
![[Obayashi] IR & SR Policy — Feeding Dialogue Back into Management](https://japan-equity.com/wp-content/uploads/2026/07/p32_sq-1024x1024.jpg)
![[Obayashi] Real Estate Development — 18.7% Margin, ¥287.7bn Unrealized Gains](https://japan-equity.com/wp-content/uploads/2026/07/p20_sq-1024x1024.jpg)
![[Obayashi] Domestic Civil Engineering — Resilience Spending Supports 9.6% Margin](https://japan-equity.com/wp-content/uploads/2026/07/p11_sq-1024x1024.jpg)
![[Obayashi] Share Price & External Ratings — vs TOPIX, ESG Index Inclusion](https://japan-equity.com/wp-content/uploads/2026/07/p40_sq-1024x1024.jpg)
![[Construction] ¥75.5tn Investment, Shrinking Workforce — Big-5 Market Share](https://japan-equity.com/wp-content/uploads/2026/07/p12_sq-1024x1024.jpg)



![[Obayashi] Capital Policy & Shareholder Returns — ROE 10%+, DOE ~5%, ¥100bn Buyback](https://japan-equity.com/wp-content/uploads/2026/07/p27_sq-1024x1024.jpg)
![[Obayashi] Reducing Cross-Shareholdings — ¥285.2bn Sold in Five Years](https://japan-equity.com/wp-content/uploads/2026/07/p29_sq-1024x1024.jpg)
![[Obayashi] ¥750bn Investment Plan — ¥300bn to Development, ¥190bn to Tech/DX](https://japan-equity.com/wp-content/uploads/2026/07/p30_sq-1024x1024.jpg)
![[Obayashi] MTP2022 KPIs — Operating Profit ~2x Target, ROE 14.4%](https://japan-equity.com/wp-content/uploads/2026/07/p25_sq-1024x1024.jpg)
![[Obayashi] Cash Allocation — ¥420bn Investment CF Over Five Years](https://japan-equity.com/wp-content/uploads/2026/07/p26_sq-1024x1024.jpg)
![[Obayashi] Green Energy — 44 Plants, 344MW, and the Green Hydrogen Challenge](https://japan-equity.com/wp-content/uploads/2026/07/p21_sq-1024x1024.jpg)
![[Obayashi] Tackling the Labor Shortage — Robotics Construction®](https://japan-equity.com/wp-content/uploads/2026/07/p14_sq-1024x1024.jpg)
