
This article is based on publicly available IR materials and is not a recommendation to buy or sell any specific securities.
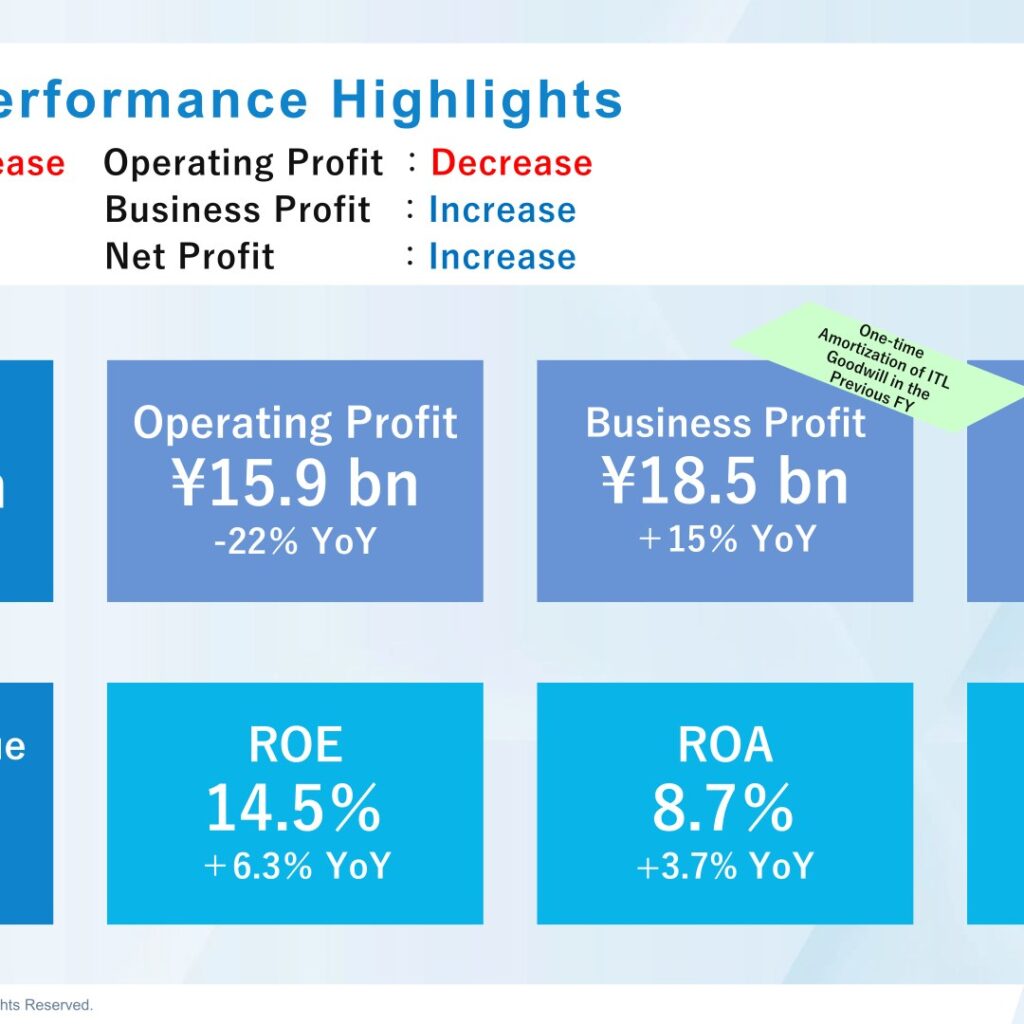
Mitsubishi Logistics Corporation reported FY2025 revenue of ¥273.4 bn, down 4% year on year, and operating profit of ¥15.9 bn, down 22%. Business profit rose 15% to ¥18.5 bn and profit attributable to owners of parent rose 72% to ¥54.7 bn, which the company attributes mainly to sales of cross-shareholdings. Results came in at 98% of the revenue forecast and 110% of the net profit forecast announced on Jan 31, 2026. The company describes FY2025 as “a year of taking on challenges” and the launch of its Business Plan [2025-2030].
Consolidated Results (Full-Year Actual)
Revenue and operating profit declined while business profit, ordinary profit and net profit increased. The company cites equity in net income of affiliates of +¥8.2 bn as the main positive factor behind ordinary profit, against operating profit of -¥4.3 bn, foreign exchange of -¥0.5 bn and dividend income of -¥0.4 bn. For net profit, the sale of investment securities added +¥37.2 bn (FY2024 ¥29.9 bn, FY2025 ¥67.2 bn), offset by income taxes of -¥8.0 bn, an impairment loss of -¥5.3 bn and disposal of fixed assets of -¥1.4 bn.
| Item (billion yen) | FY2024 | FY2025 | YoY | FY2025 Forecast* | vs. forecast |
|---|---|---|---|---|---|
| Revenue | 284.0 | 273.4 | -10.6 / -4% | 280 | 98% |
| Operating Profit | 20.3 | 15.9 | -4.3 / -22% | 16 | 100% |
| Business Profit | 16.1 | 18.5 | +2.4 / +15% | 18.3 | 102% |
| Ordinary Profit | 18.6 | 21.5 | +2.9 / +16% | 20.6 | 105% |
| Profit Attributable to Owners of Parent | 31.8 | 54.7 | +22.9 / +72% | 50 | 110% |
*Forecast announced on Jan 31, 2026. Other FY2025 highlights disclosed by the company include overseas revenue of ¥54.4 bn (-10% YoY), ROE of 14.5% (+6.3% YoY), ROA of 8.7% (+3.7% YoY) and an equity ratio of 59.3% (-0.5% YoY). Total assets stood at ¥639.7 bn at the end of FY2025, up ¥13.7 bn (+2%), and net assets at ¥384.5 bn, up ¥5.2 bn (+1%).
Segment Results
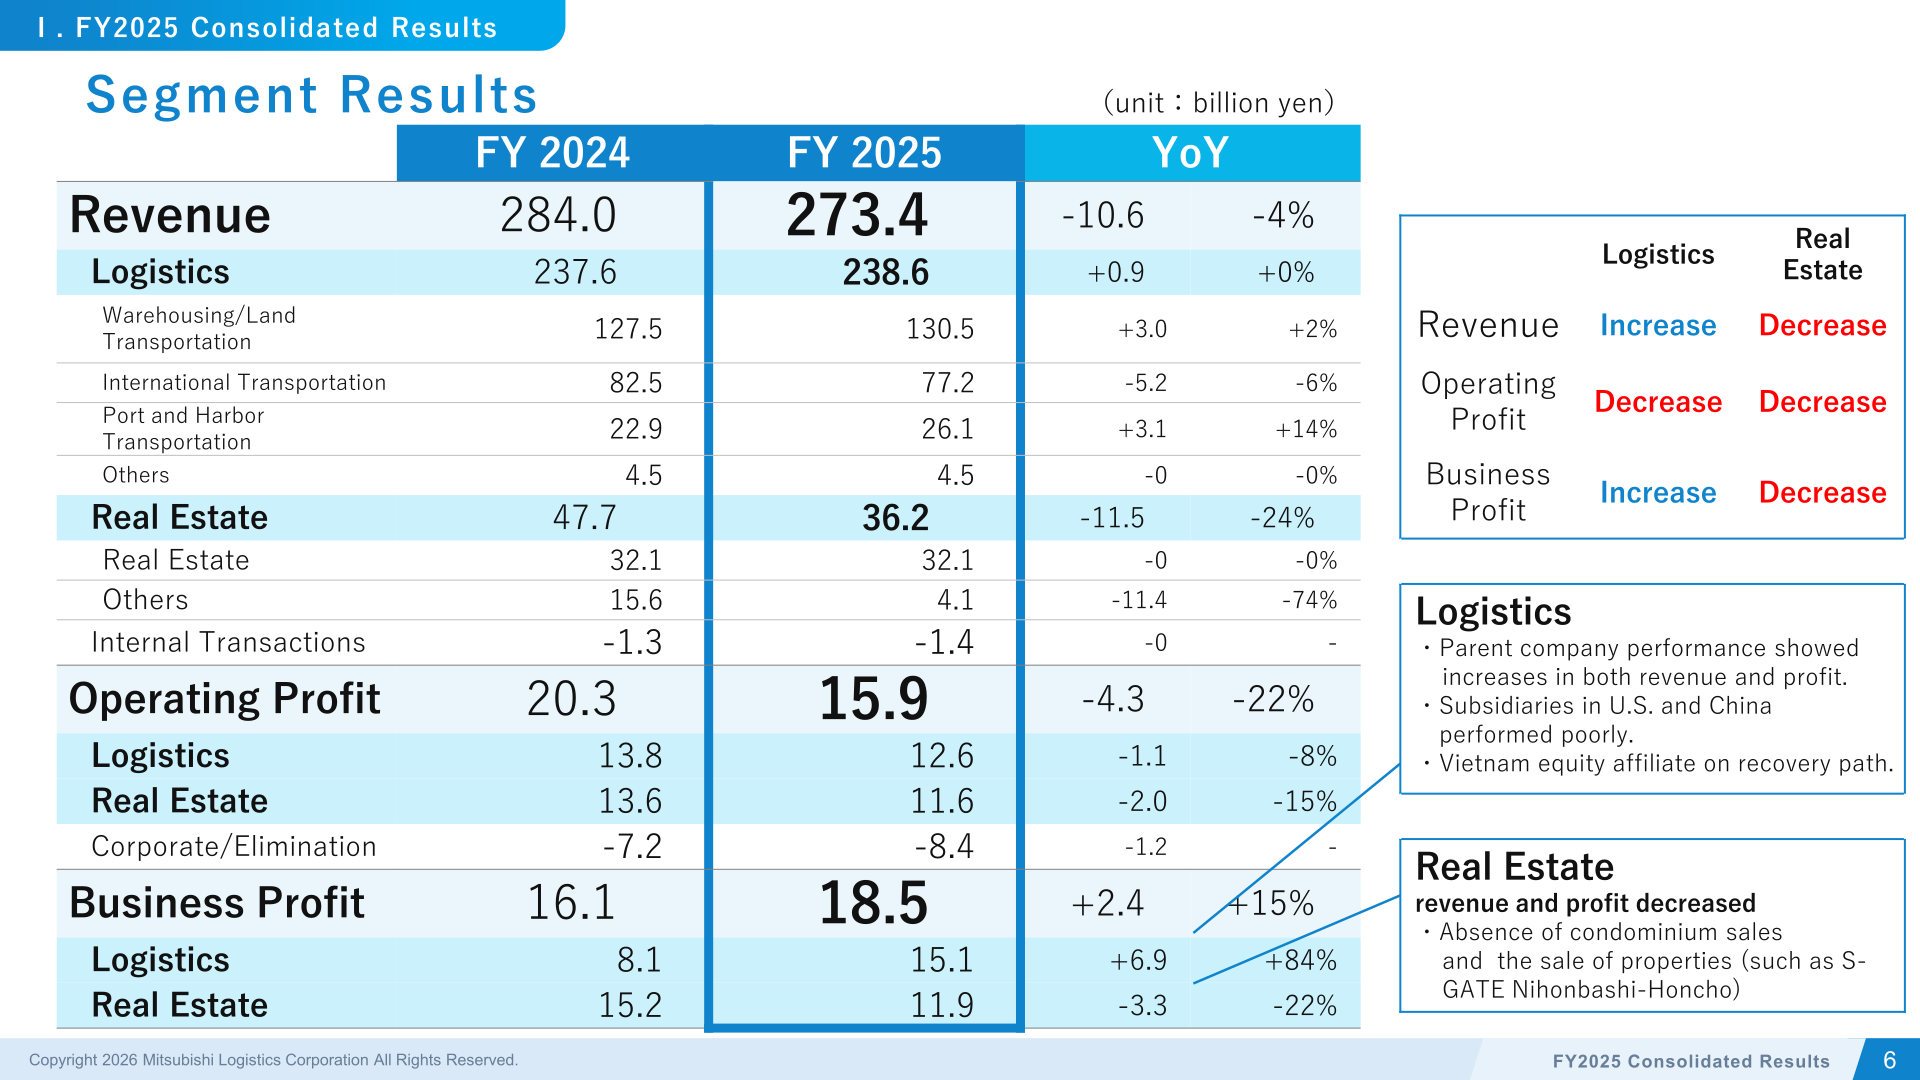
The Group reports two segments, Logistics and Real Estate. Logistics revenue increased while operating profit decreased and business profit increased; Real Estate revenue and profit both decreased. For Logistics, the company notes that parent company performance showed increases in both revenue and profit, that subsidiaries in the U.S. and China performed poorly, and that its Vietnam equity affiliate is on a recovery path. For Real Estate, the decline is attributed to the absence of condominium sales and the sale of properties (such as S-GATE Nihonbashi-Honcho).
| Item (billion yen) | FY2024 | FY2025 | YoY |
|---|---|---|---|
| Revenue – Logistics | 237.6 | 238.6 | +0.9 (+0%) |
| Warehousing/Land Transportation | 127.5 | 130.5 | +3.0 (+2%) |
| International Transportation | 82.5 | 77.2 | -5.2 (-6%) |
| Port and Harbor Transportation | 22.9 | 26.1 | +3.1 (+14%) |
| Others | 4.5 | 4.5 | -0 (-0%) |
| Revenue – Real Estate | 47.7 | 36.2 | -11.5 (-24%) |
| Real Estate | 32.1 | 32.1 | -0 (-0%) |
| Others | 15.6 | 4.1 | -11.4 (-74%) |
| Internal Transactions | -1.3 | -1.4 | -0 |
| Operating Profit – Logistics | 13.8 | 12.6 | -1.1 (-8%) |
| Operating Profit – Real Estate | 13.6 | 11.6 | -2.0 (-15%) |
| Operating Profit – Corporate/Elimination | -7.2 | -8.4 | -1.2 |
| Business Profit – Logistics | 8.1 | 15.1 | +6.9 (+84%) |
| Business Profit – Real Estate | 15.2 | 11.9 | -3.3 (-22%) |
On the business profit bridge, the company lists Logistics factors of -¥1.3 bn at the Cavalier Logistics group (reduced cargo handling due to U.S. government policy changes and a delay in intake at the new warehouse) and -¥0.3 bn at Shanghai Linghua Logistics on China’s economic slowdown, together with +¥8.0 bn from increased equity in net income of affiliates, mainly ITL Corporation (Vietnam). Real Estate factors include a -¥1.9 bn decrease in condominium sales and a +¥0.2 bn full-year contribution from “Kobe Suma Sea World” operations.
FY2026 Forecast
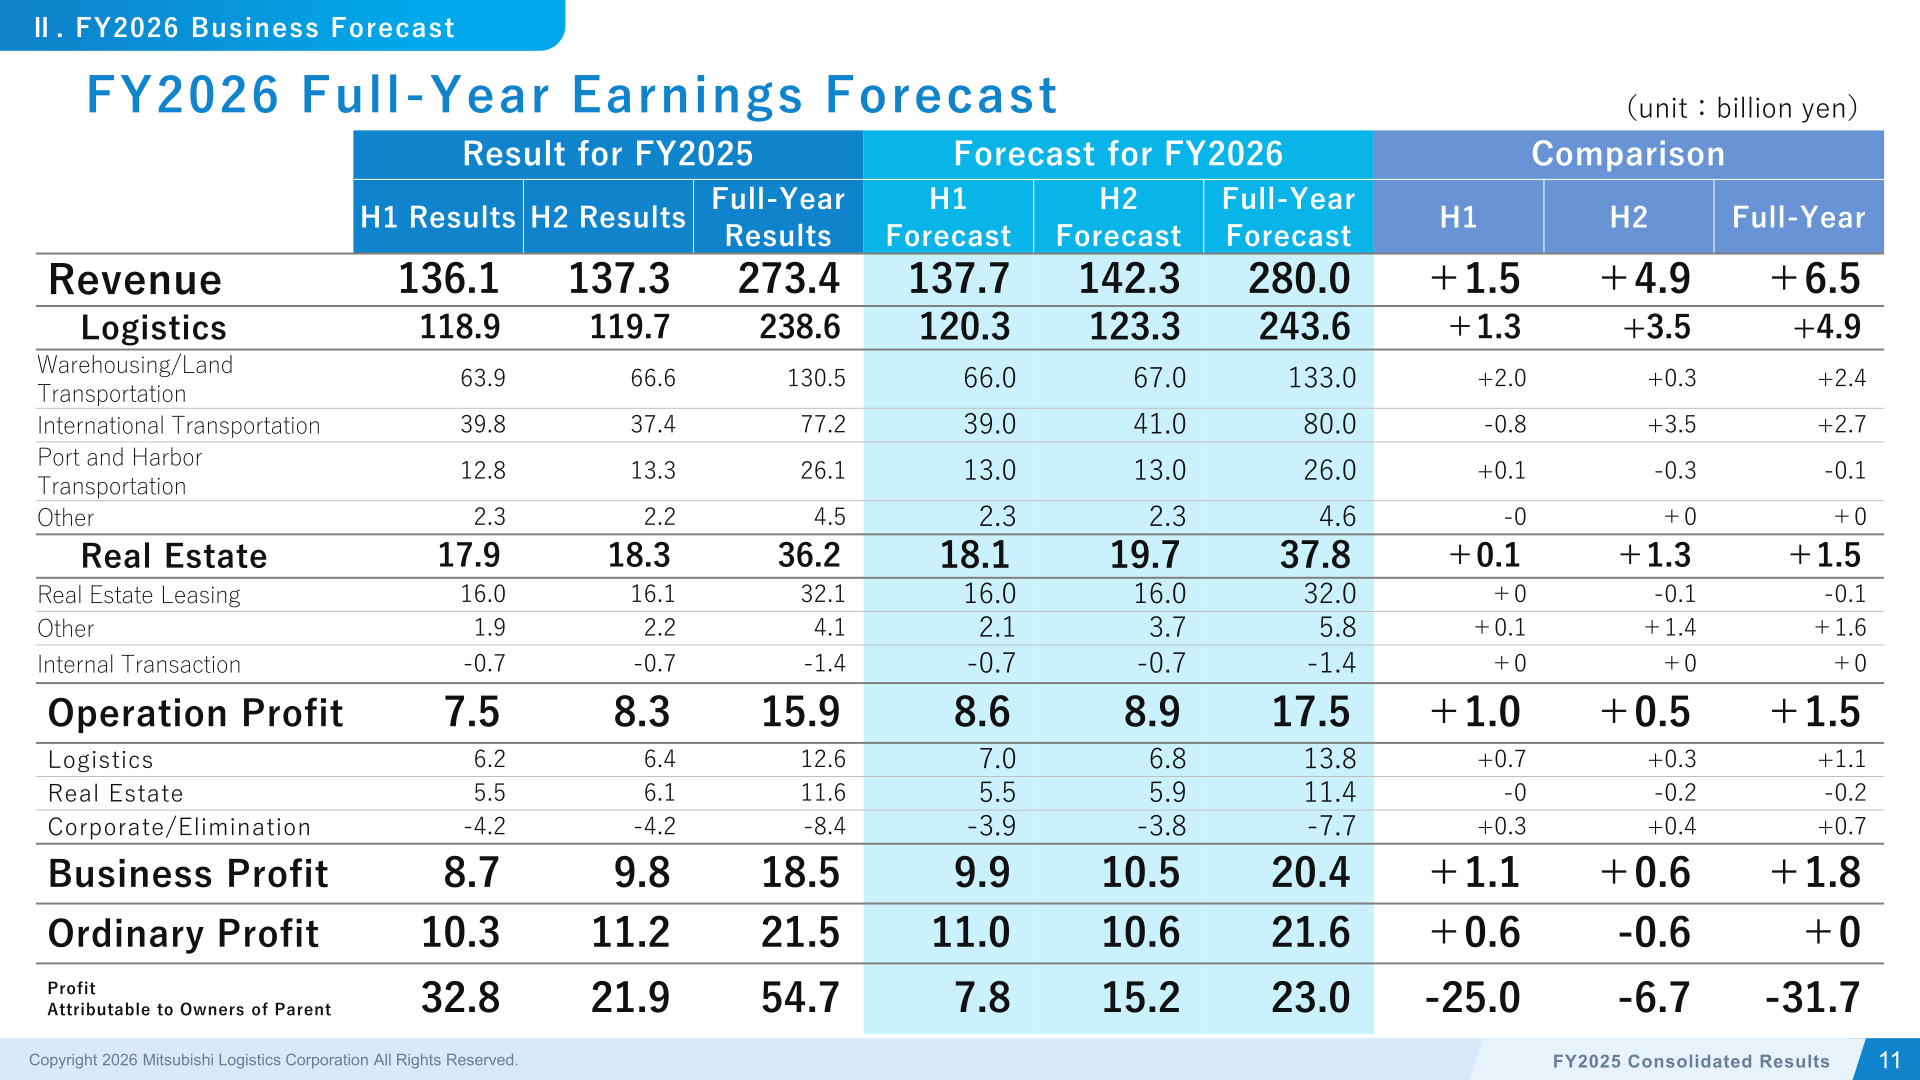
For FY2026 the company forecasts revenue of ¥280.0 bn (+6.5), operating profit of ¥17.5 bn (+1.5), business profit of ¥20.4 bn (+1.8) and ordinary profit of ¥21.6 bn (+0). Profit attributable to owners of parent is forecast at ¥23.0 bn, down ¥31.7 bn, reflecting a decrease in gains on sales of investment securities (-¥37 bn) and a reversal of the impairment loss on Cavalier Logistics (+¥5.0 bn), among other items.
| Item (billion yen) | FY2025 Full-Year Results | FY2026 Full-Year Forecast | Comparison |
|---|---|---|---|
| Revenue | 273.4 | 280.0 | +6.5 |
| Logistics | 238.6 | 243.6 | +4.9 |
| Warehousing/Land Transportation | 130.5 | 133.0 | +2.4 |
| International Transportation | 77.2 | 80.0 | +2.7 |
| Port and Harbor Transportation | 26.1 | 26.0 | -0.1 |
| Other | 4.5 | 4.6 | +0 |
| Real Estate | 36.2 | 37.8 | +1.5 |
| Real Estate Leasing | 32.1 | 32.0 | -0.1 |
| Other | 4.1 | 5.8 | +1.6 |
| Operation Profit | 15.9 | 17.5 | +1.5 |
| Logistics | 12.6 | 13.8 | +1.1 |
| Real Estate | 11.6 | 11.4 | -0.2 |
| Corporate/Elimination | -8.4 | -7.7 | +0.7 |
| Business Profit | 18.5 | 20.4 | +1.8 |
| Ordinary Profit | 21.5 | 21.6 | +0 |
| Profit Attributable to Owners of Parent | 54.7 | 23.0 | -31.7 |
Shareholder Returns
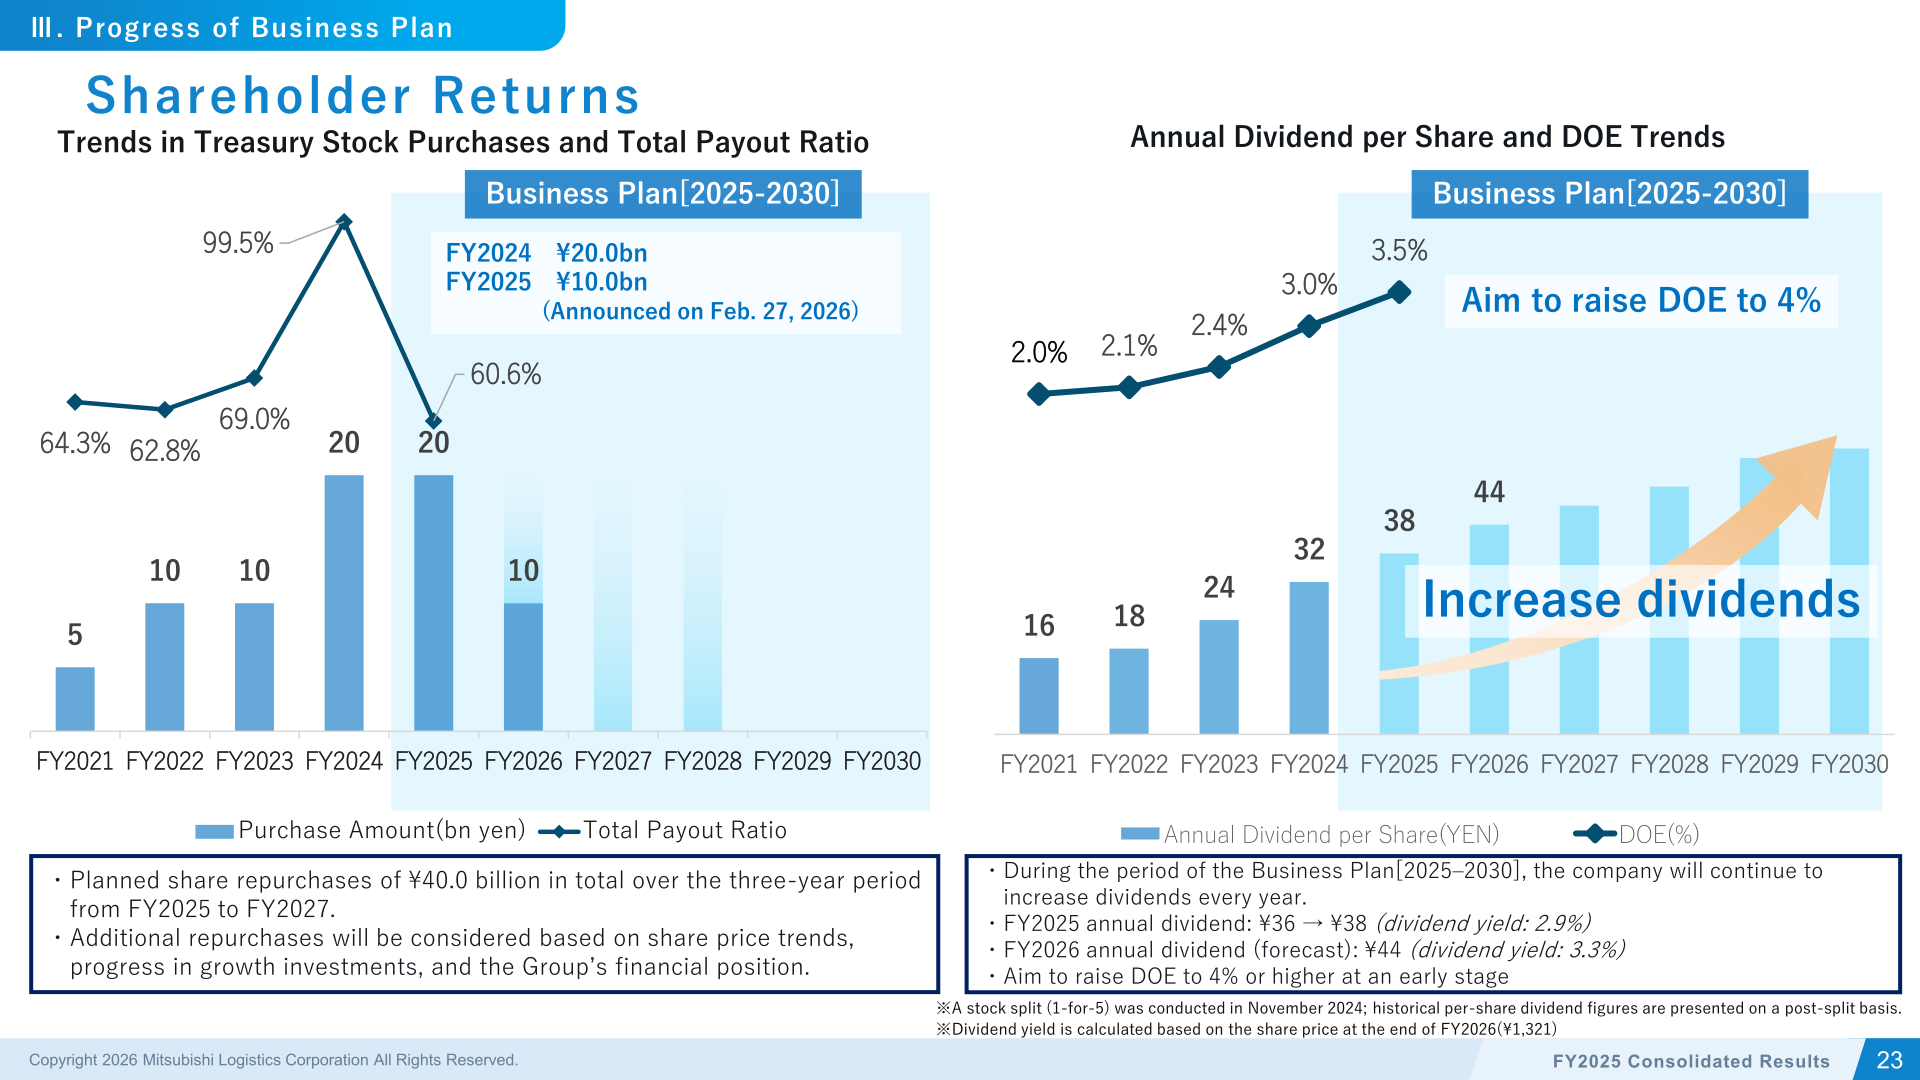
The company states that it will continue to increase dividends every year during the period of the Business Plan [2025-2030]. The FY2025 annual dividend was raised from ¥36 to ¥38 (dividend yield: 2.9%), and the FY2026 annual dividend is forecast at ¥44 (dividend yield: 3.3%). Dividend yield is calculated based on the share price at the end of FY2026 (¥1,321). The company aims to raise DOE to 4% or higher at an early stage. A stock split (1-for-5) was conducted in November 2024, and historical per-share dividend figures are presented on a post-split basis.
On buybacks, the company plans share repurchases of ¥40.0 billion in total over the three-year period from FY2025 to FY2027, and states that additional repurchases will be considered based on share price trends, progress in growth investments and the Group’s financial position.
| Item | FY2024 | FY2025 | FY2026 (Forecast) |
|---|---|---|---|
| Annual dividend per share (yen) | 32 | 38 | 44 |
| DOE | 3.0% | 3.5% | — |
| Dividend Payout Ratio | 37.2% | 24.4% | — |
| Treasury stock purchases (bn yen) | 20 | 20 | — |
| Total Payout Ratio | 99.5% | 60.6% | — |
Progress of the Business Plan [2025-2030]
FY2025 investment totalled ¥55.6 bn, or 76% of plan: growth investment in Logistics ¥4.0 bn (16% of plan), growth investment in Real Estate ¥35.7 bn (125% of plan), facility upgrade investment ¥10.1 bn (59% of plan) and DX investment ¥5.8 bn (83% of plan). The FY2026 plan is ¥63.0 bn plus alpha, comprising growth investment in Logistics ¥6.0 bn, growth investment in Real Estate ¥29.0 bn, growth investment in New Business ¥10.0 bn, facility upgrade investment ¥10.0 bn and DX investment ¥8.0 bn, with M&A timing and amount undecided.
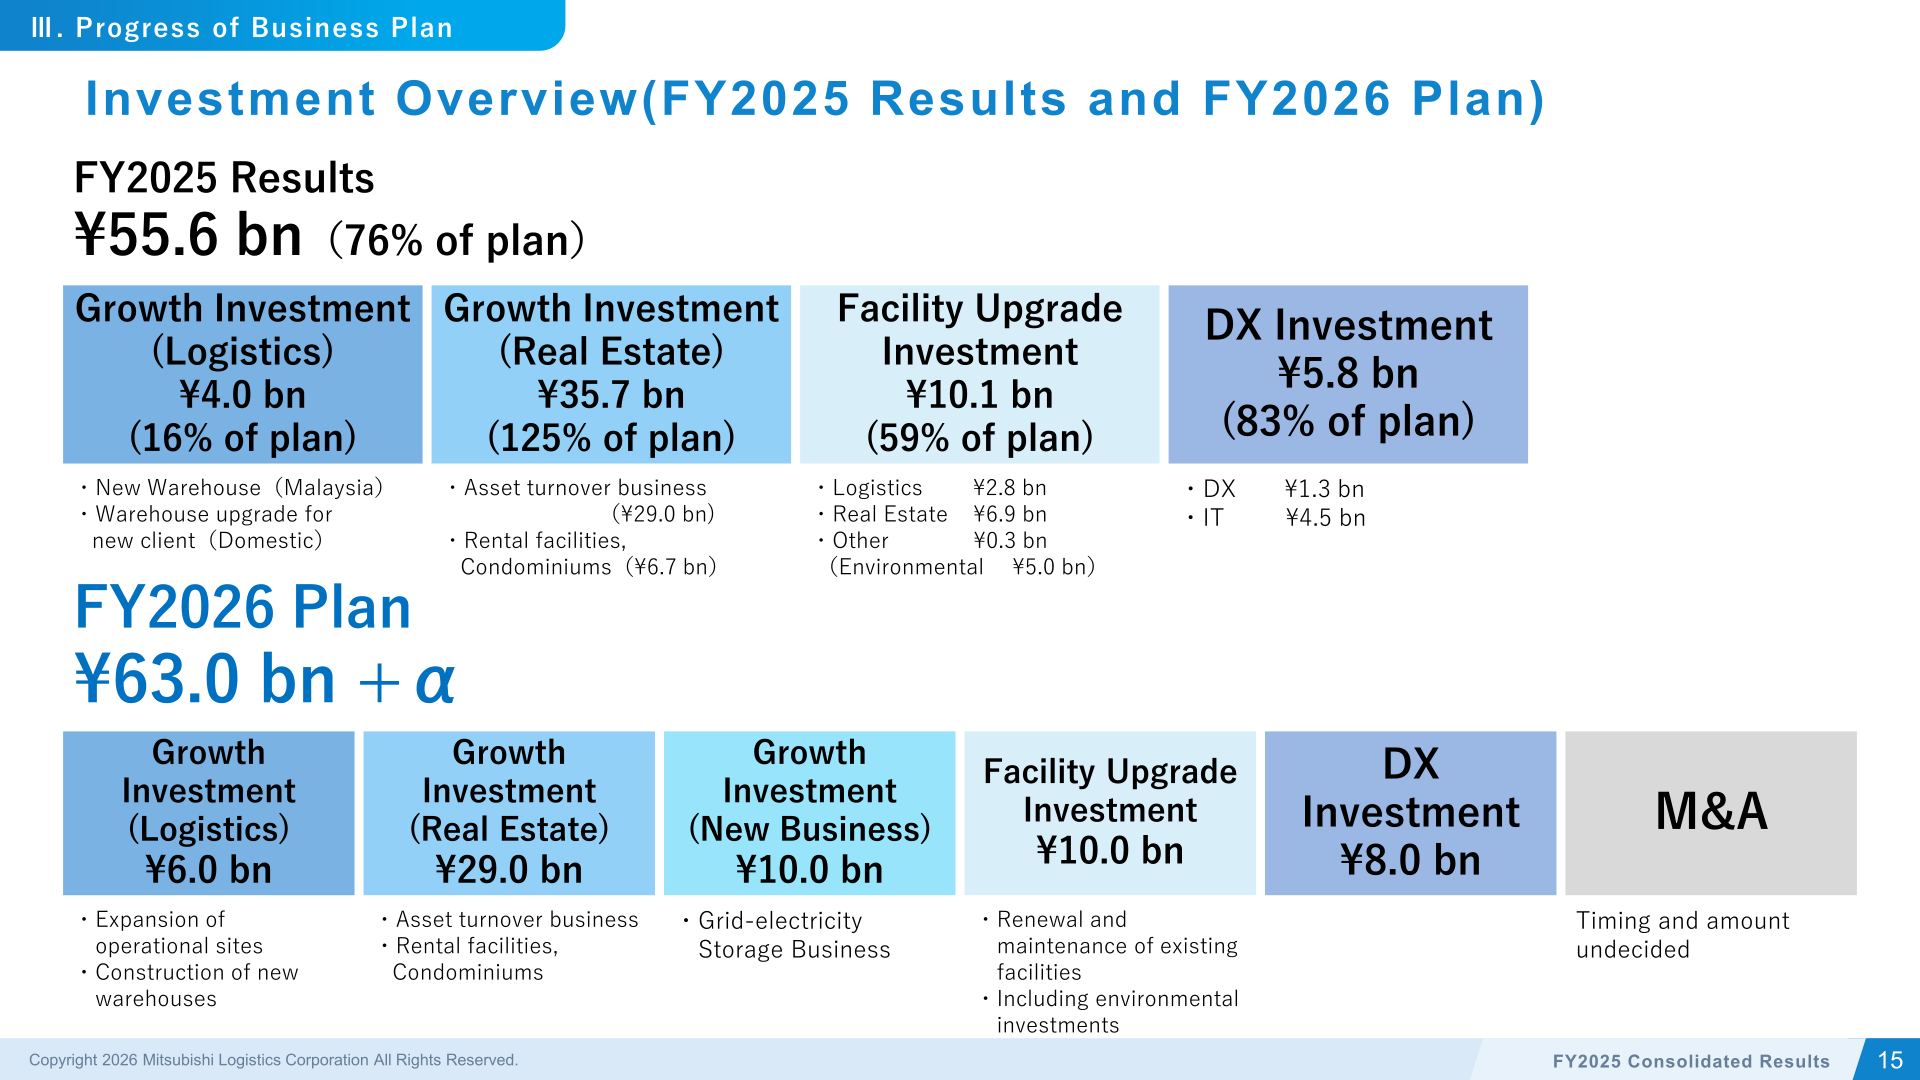
In the asset turnover business, investment decisions were approved for 12 projects totalling ¥44.4 bn in FY2025, bringing the cumulative total to 17 projects and ¥54.9 bn. The company also formally decided to enter the grid electricity storage business, with a FY2026 investment of ¥10.0 bn, operations to begin at two sites (Saitama, Fukuoka) in FY2027, sequential launch at four additional sites by FY2030, and projected FY2030 operating revenue of approximately ¥10.0 bn.
On cross-shareholdings, the company sold ¥69.3 bn in FY2025 (FY2024: ¥32.5 bn), reducing the ending balance to ¥83.1 bn (FY2024: ¥115.5 bn) and the ratio to net assets to 21.6% (FY2024: 30.5%). The target of reducing the ratio to net assets below 20% by the end of FY2025 was not achieved due to the rise in share prices in FY2025; excluding the impact of share price appreciation, the company states the ratio would have been approximately 15% based on beginning-of-year share prices.
Topics
The company received an Excellence Award for the first time at the 5th “NIKKEI Integrated Report Award” and carried out initiatives for individual investors, including a company briefing hosted by Daiwa Investor Relations Co., Ltd. and an appearance on a YouTube channel for individual investors (“Discba” powered by Nikko Investor Relations).
This article is an analysis based on publicly available information and is not a recommendation to buy or sell any specific securities. Investment decisions are your own responsibility.
![[Obayashi] Investors’ Guide 2026 — The Complete 24-Article Breakdown](https://japan-equity.com/wp-content/uploads/2026/07/hub_cover-1024x1024.png)
![[Obayashi] IR & SR Policy — Feeding Dialogue Back into Management](https://japan-equity.com/wp-content/uploads/2026/07/p32_sq-1024x1024.jpg)
![[Obayashi] Real Estate Development — 18.7% Margin, ¥287.7bn Unrealized Gains](https://japan-equity.com/wp-content/uploads/2026/07/p20_sq-1024x1024.jpg)
![[Obayashi] Domestic Civil Engineering — Resilience Spending Supports 9.6% Margin](https://japan-equity.com/wp-content/uploads/2026/07/p11_sq-1024x1024.jpg)
![[Obayashi] Share Price & External Ratings — vs TOPIX, ESG Index Inclusion](https://japan-equity.com/wp-content/uploads/2026/07/p40_sq-1024x1024.jpg)
![[Construction] ¥75.5tn Investment, Shrinking Workforce — Big-5 Market Share](https://japan-equity.com/wp-content/uploads/2026/07/p12_sq-1024x1024.jpg)



![[Obayashi] Capital Policy & Shareholder Returns — ROE 10%+, DOE ~5%, ¥100bn Buyback](https://japan-equity.com/wp-content/uploads/2026/07/p27_sq-1024x1024.jpg)
![[Obayashi] Reducing Cross-Shareholdings — ¥285.2bn Sold in Five Years](https://japan-equity.com/wp-content/uploads/2026/07/p29_sq-1024x1024.jpg)
![[Obayashi] ¥750bn Investment Plan — ¥300bn to Development, ¥190bn to Tech/DX](https://japan-equity.com/wp-content/uploads/2026/07/p30_sq-1024x1024.jpg)
![[Obayashi] MTP2022 KPIs — Operating Profit ~2x Target, ROE 14.4%](https://japan-equity.com/wp-content/uploads/2026/07/p25_sq-1024x1024.jpg)
![[Obayashi] Cash Allocation — ¥420bn Investment CF Over Five Years](https://japan-equity.com/wp-content/uploads/2026/07/p26_sq-1024x1024.jpg)
![[Obayashi] Green Energy — 44 Plants, 344MW, and the Green Hydrogen Challenge](https://japan-equity.com/wp-content/uploads/2026/07/p21_sq-1024x1024.jpg)
![[Obayashi] Tackling the Labor Shortage — Robotics Construction®](https://japan-equity.com/wp-content/uploads/2026/07/p14_sq-1024x1024.jpg)
