
This article is based on publicly available IR materials and is not a recommendation to buy or sell any specific securities.
Note: NIKKON Holdings labels this fiscal year as the fiscal year ended March 31, 2026 (FY2026/3) in its materials; this site classifies the most recently completed fiscal year as FY2025. Labels in the text, tables and segment data below follow the presentation.
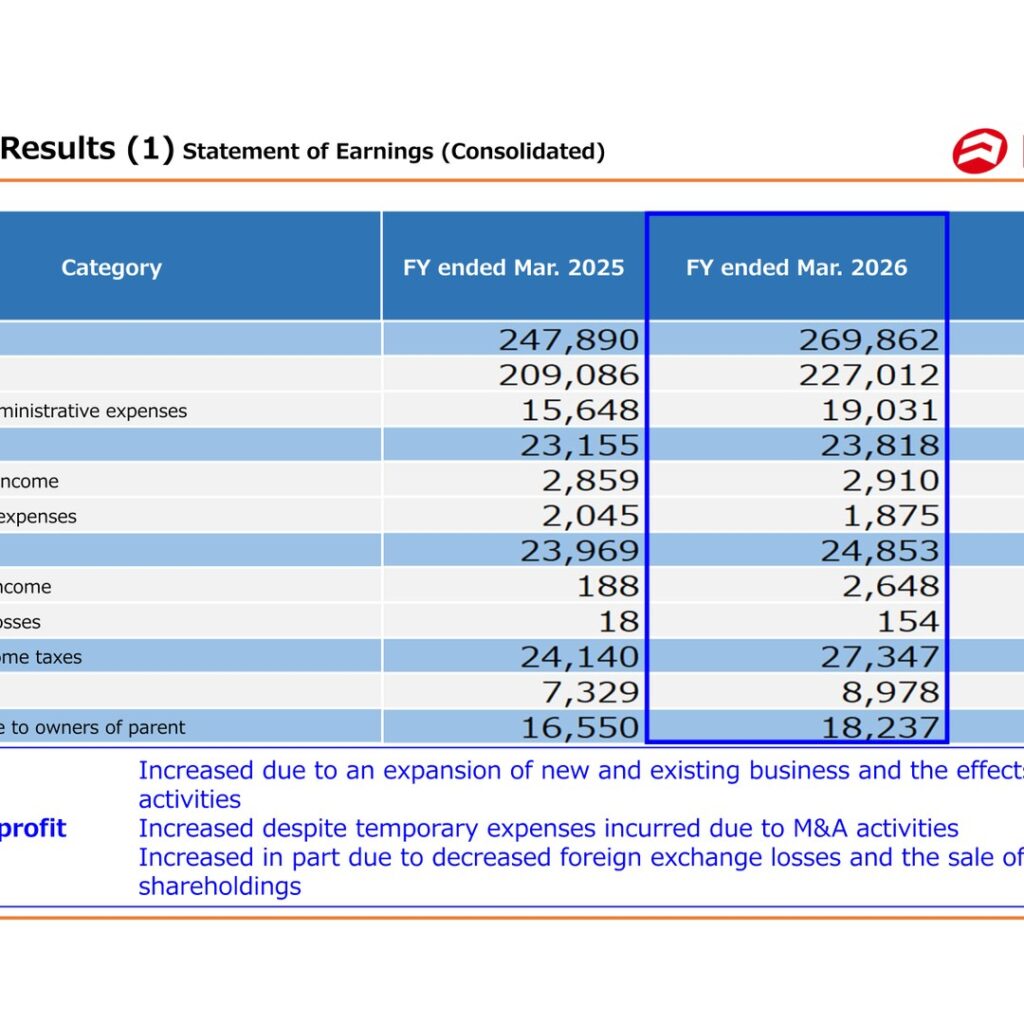
NIKKON Holdings Co., Ltd. (Security: 9072) released “Financial Results for the Fiscal Year Ended March 31, 2026” on Thursday, May 21, 2026. Net sales rose 8.9% year on year to 269,862 million yen, operating profit rose 2.9% to 23,818 million yen, ordinary profit rose 3.7% to 24,853 million yen and profit attributable to owners of parent rose 10.2% to 18,237 million yen. The presentation attributes the sales increase to an expansion of new and existing business and the effects of M&A activities, notes that operating profit increased despite temporary expenses incurred due to M&A activities, and states that net profit increased in part due to decreased foreign exchange losses and the sale of cross-shareholdings.
Consolidated Results (Full-Year Actual)
The consolidated statement of earnings is shown below as presented, in millions of yen. Cost of sales rose 8.6% and general and administrative expenses rose 21.6%. Extraordinary income was 2,648 million yen against 188 million yen a year earlier, and income taxes rose 22.5% to 8,978 million yen.
| Category (Millions of yen) | FY ended Mar. 2025 | FY ended Mar. 2026 | YoY |
|---|---|---|---|
| Net sales | 247,890 | 269,862 | 8.9% |
| Cost of sales | 209,086 | 227,012 | 8.6% |
| General and administrative expenses | 15,648 | 19,031 | 21.6% |
| Operating profit | 23,155 | 23,818 | 2.9% |
| Non-operating income | 2,859 | 2,910 | 1.8% |
| Non-operating expenses | 2,045 | 1,875 | -8% |
| Ordinary profit | 23,969 | 24,853 | 3.7% |
| Extraordinary income | 188 | 2,648 | — |
| Extraordinary losses | 18 | 154 | — |
| Profit before income taxes | 24,140 | 27,347 | 13.3% |
| Income taxes | 7,329 | 8,978 | 22.5% |
| Profit attributable to owners of parent | 16,550 | 18,237 | 10.2% |
Segment Results
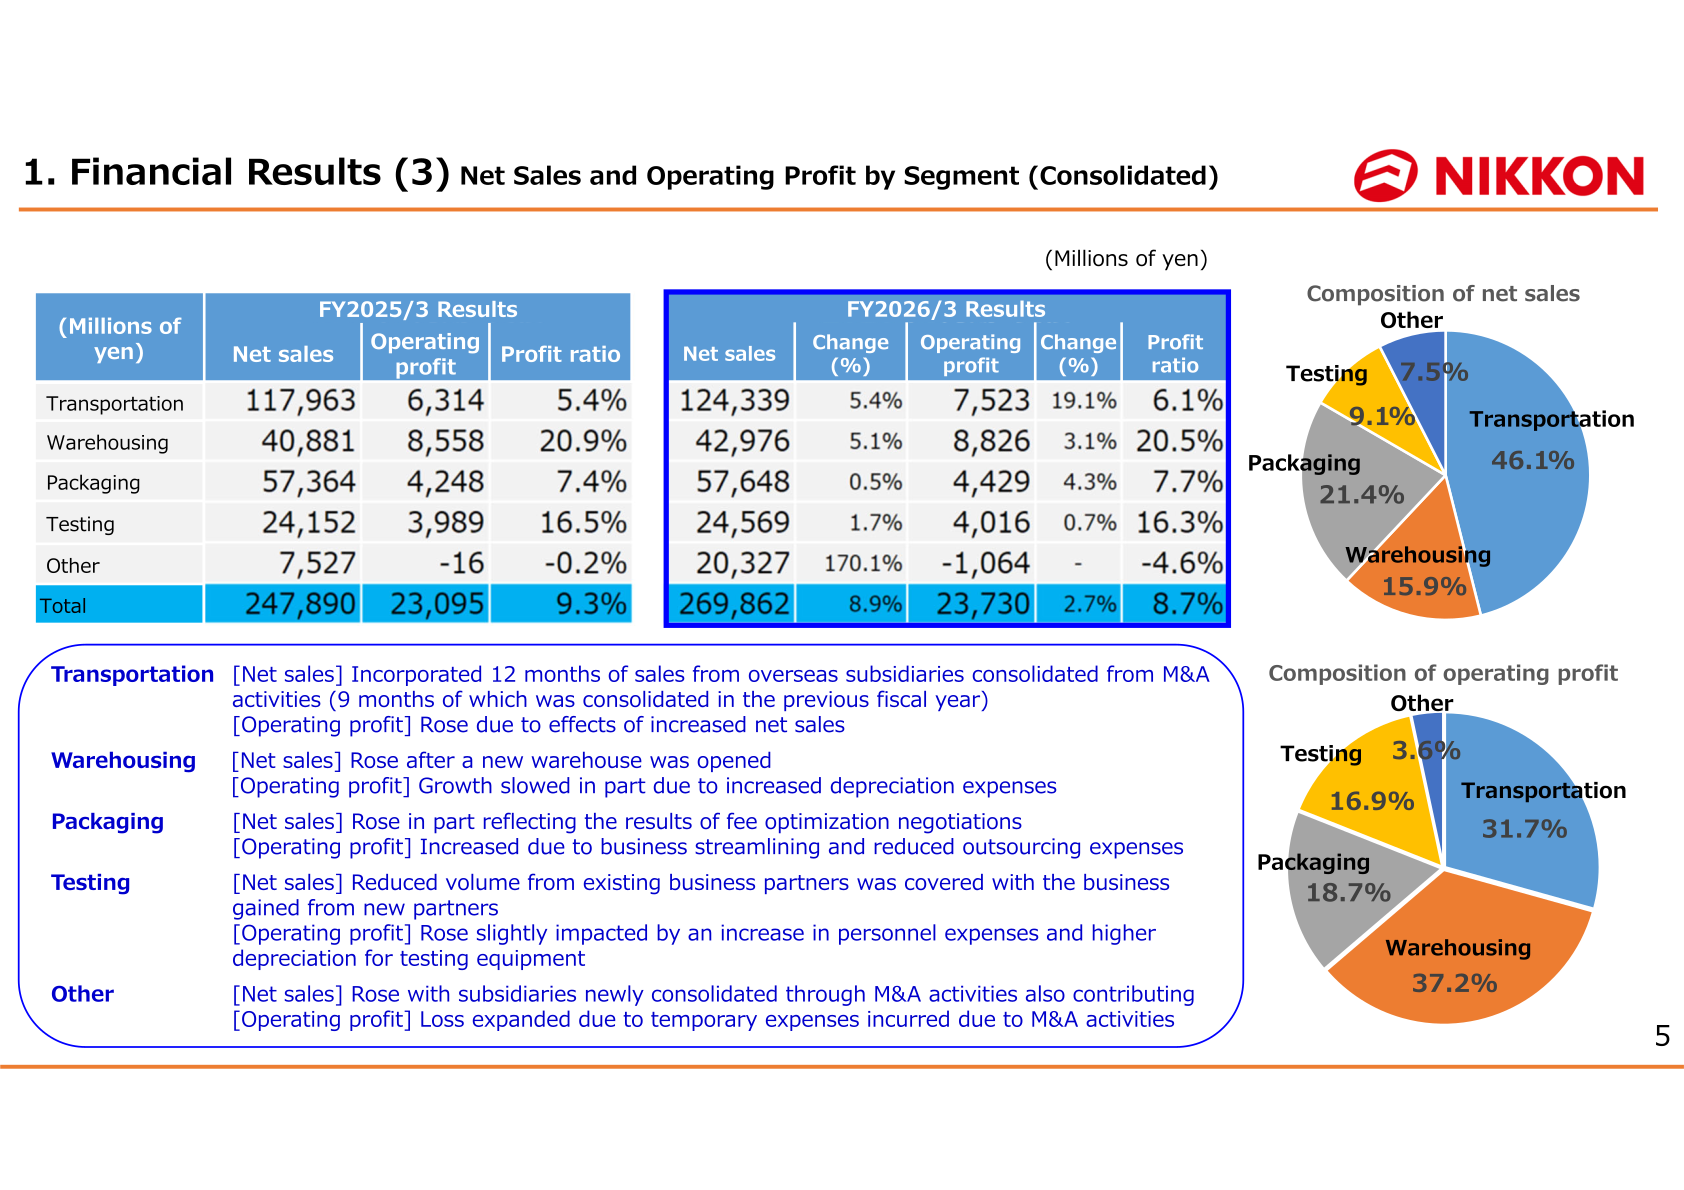
Transportation was the largest contributor to growth. The presentation states that Transportation net sales incorporated 12 months of sales from overseas subsidiaries consolidated from M&A activities (nine months of which was consolidated in the previous fiscal year), and that its operating profit rose due to the effects of increased net sales. Warehousing net sales rose after a new warehouse was opened, while operating profit growth slowed in part due to increased depreciation expenses. Packaging net sales rose in part reflecting the results of fee optimization negotiations, with operating profit increasing due to business streamlining and reduced outsourcing expenses. In Testing, reduced volume from existing business partners was covered with business gained from new partners. In Other, net sales rose with subsidiaries newly consolidated through M&A activities also contributing, while the operating loss expanded due to temporary expenses incurred due to M&A activities.
| Segment (Millions of yen) | FY2025/3 Net sales | FY2026/3 Net sales | Change (%) | FY2025/3 Operating profit | FY2026/3 Operating profit | Change (%) | FY2026/3 Profit ratio |
|---|---|---|---|---|---|---|---|
| Transportation | 117,963 | 124,339 | 5.4% | 6,314 | 7,523 | 19.1% | 6.1% |
| Warehousing | 40,881 | 42,976 | 5.1% | 8,558 | 8,826 | 3.1% | 20.5% |
| Packaging | 57,364 | 57,648 | 0.5% | 4,248 | 4,429 | 4.3% | 7.7% |
| Testing | 24,152 | 24,569 | 1.7% | 3,989 | 4,016 | 0.7% | 16.3% |
| Other | 7,527 | 20,327 | 170.1% | -16 | -1,064 | – | -4.6% |
| Total | 247,890 | 269,862 | 8.9% | 23,095 | 23,730 | 2.7% | 8.7% |
By composition of net sales, Transportation accounted for 46.1%, Packaging 21.4%, Warehousing 15.9%, Testing 9.1% and Other 7.5%. By composition of operating profit, Warehousing accounted for 37.2%, Transportation 31.7%, Packaging 18.7%, Testing 16.9% and Other 3.6%.
Net Sales by Industry and by Region
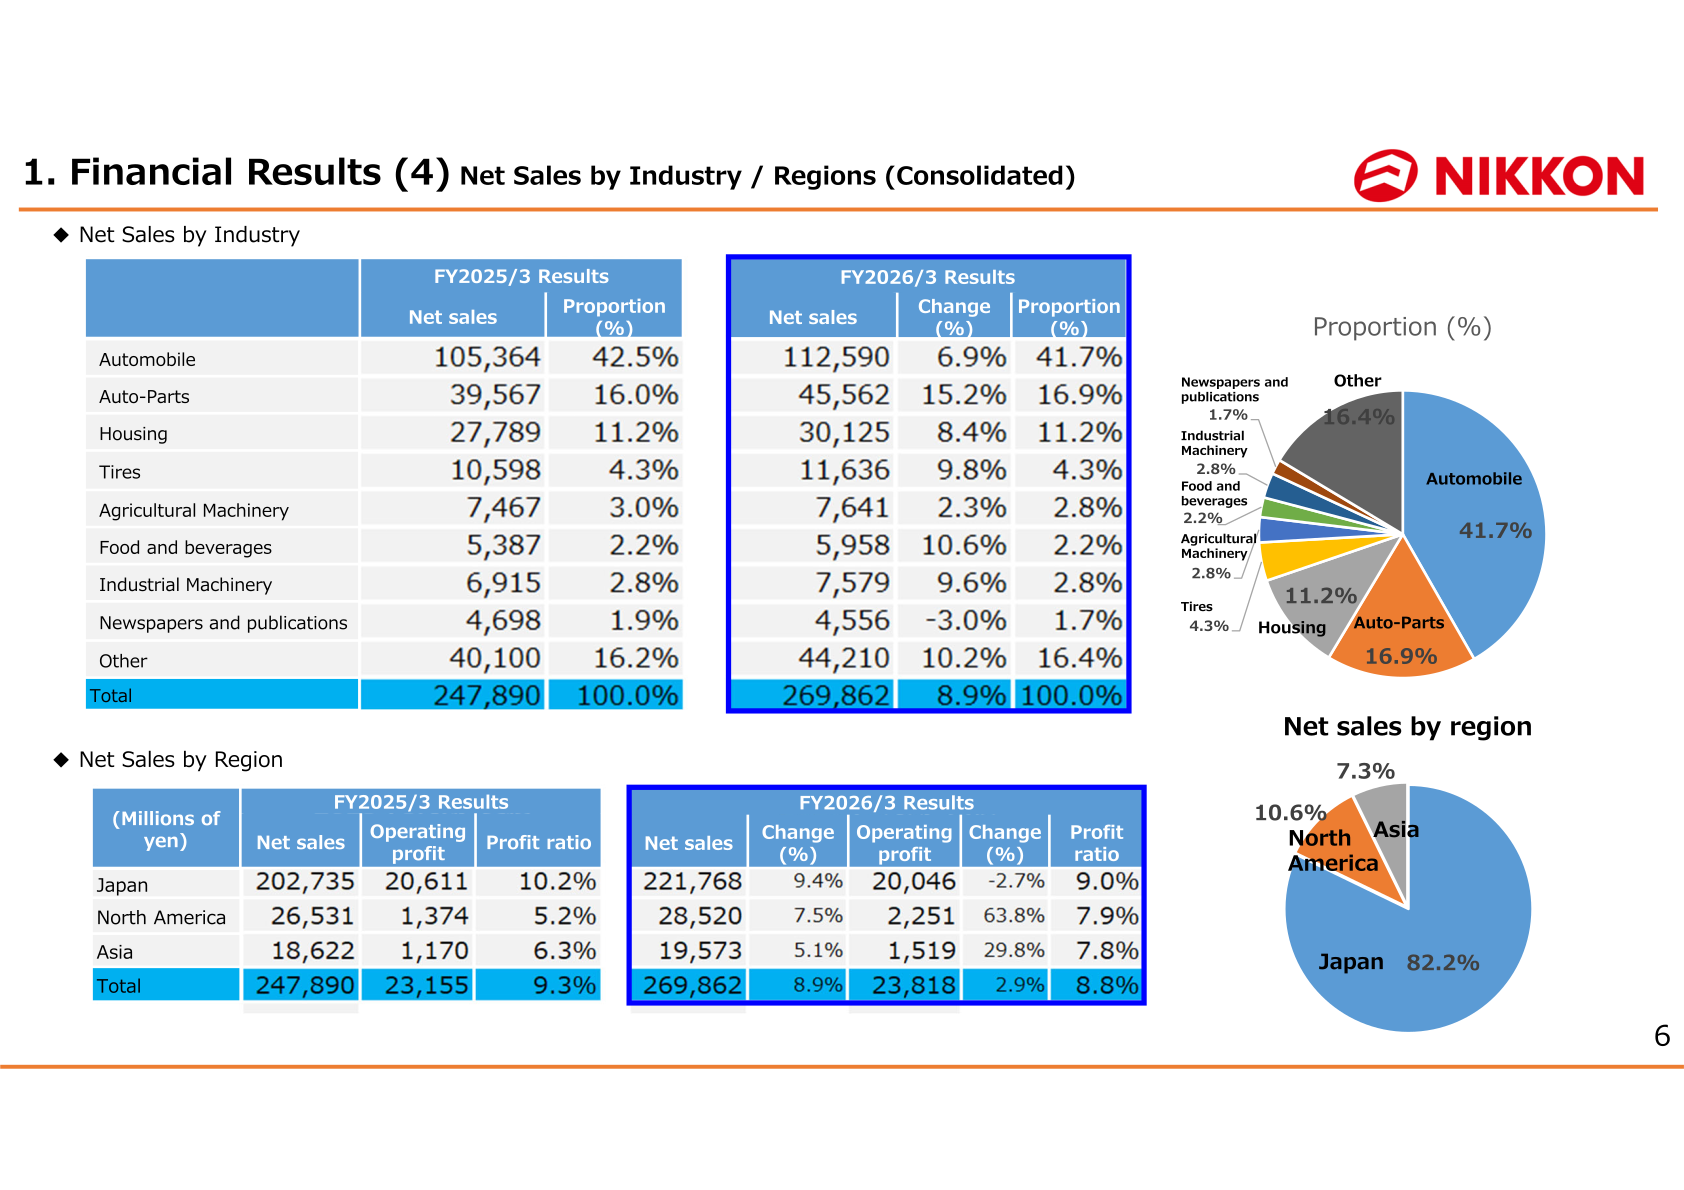
Automobile remained the largest customer industry at 112,590 million yen, or 41.7% of net sales, followed by Auto-Parts at 45,562 million yen (16.9%) and Housing at 30,125 million yen (11.2%). Newspapers and publications was the only industry to decline, at -3.0%. By region, Japan accounted for 82.2% of net sales, North America 10.6% and Asia 7.3%; operating profit in Japan declined 2.7% while North America rose 63.8% and Asia rose 29.8%.
| Region (Millions of yen) | FY2025/3 Net sales | FY2026/3 Net sales | Change (%) | FY2025/3 Operating profit | FY2026/3 Operating profit | Change (%) | FY2026/3 Profit ratio |
|---|---|---|---|---|---|---|---|
| Japan | 202,735 | 221,768 | 9.4% | 20,611 | 20,046 | -2.7% | 9.0% |
| North America | 26,531 | 28,520 | 7.5% | 1,374 | 2,251 | 63.8% | 7.9% |
| Asia | 18,622 | 19,573 | 5.1% | 1,170 | 1,519 | 29.8% | 7.8% |
| Total | 247,890 | 269,862 | 8.9% | 23,155 | 23,818 | 2.9% | 8.8% |
Capital Investment
Capital investment in the fiscal year under review was 22,890 million yen. Investment details totalled 30,485 million yen before deducting 7,594 million yen of construction in progress included in capital investment for the previous fiscal year. Property, plant and equipment increased as buildings and structures and machinery, equipment and vehicles rose by 8.3 billion yen, primarily due to buildings and sales vehicles. Completions during the year included the No. 5 Warehouse at the PT. NIPPON KONPO INDONESIA Bukit Branch on December 1, 2025 and the Kanda Warehouse at the Moji Branch of NIKKON Logistics CO., LTD. on March 3, 2026.
| Capital investments details | Amount (Millions of yen) | Descriptions |
|---|---|---|
| Operating Fleets | 4,876 | 295 units (Additional trucks or replacements) |
| Buildings and Lands | 16,206 | Warehouses, etc., land for office use |
| Other | 9,402 | Construction in progress, etc. |
| Total | 30,485 | |
| Construction in progress (portion included in capital investment for the previous fiscal year) | -7,594 | |
| Capital investment in the fiscal year under review | 22,890 |
Review of the Thirteenth Medium-Term Management Plan
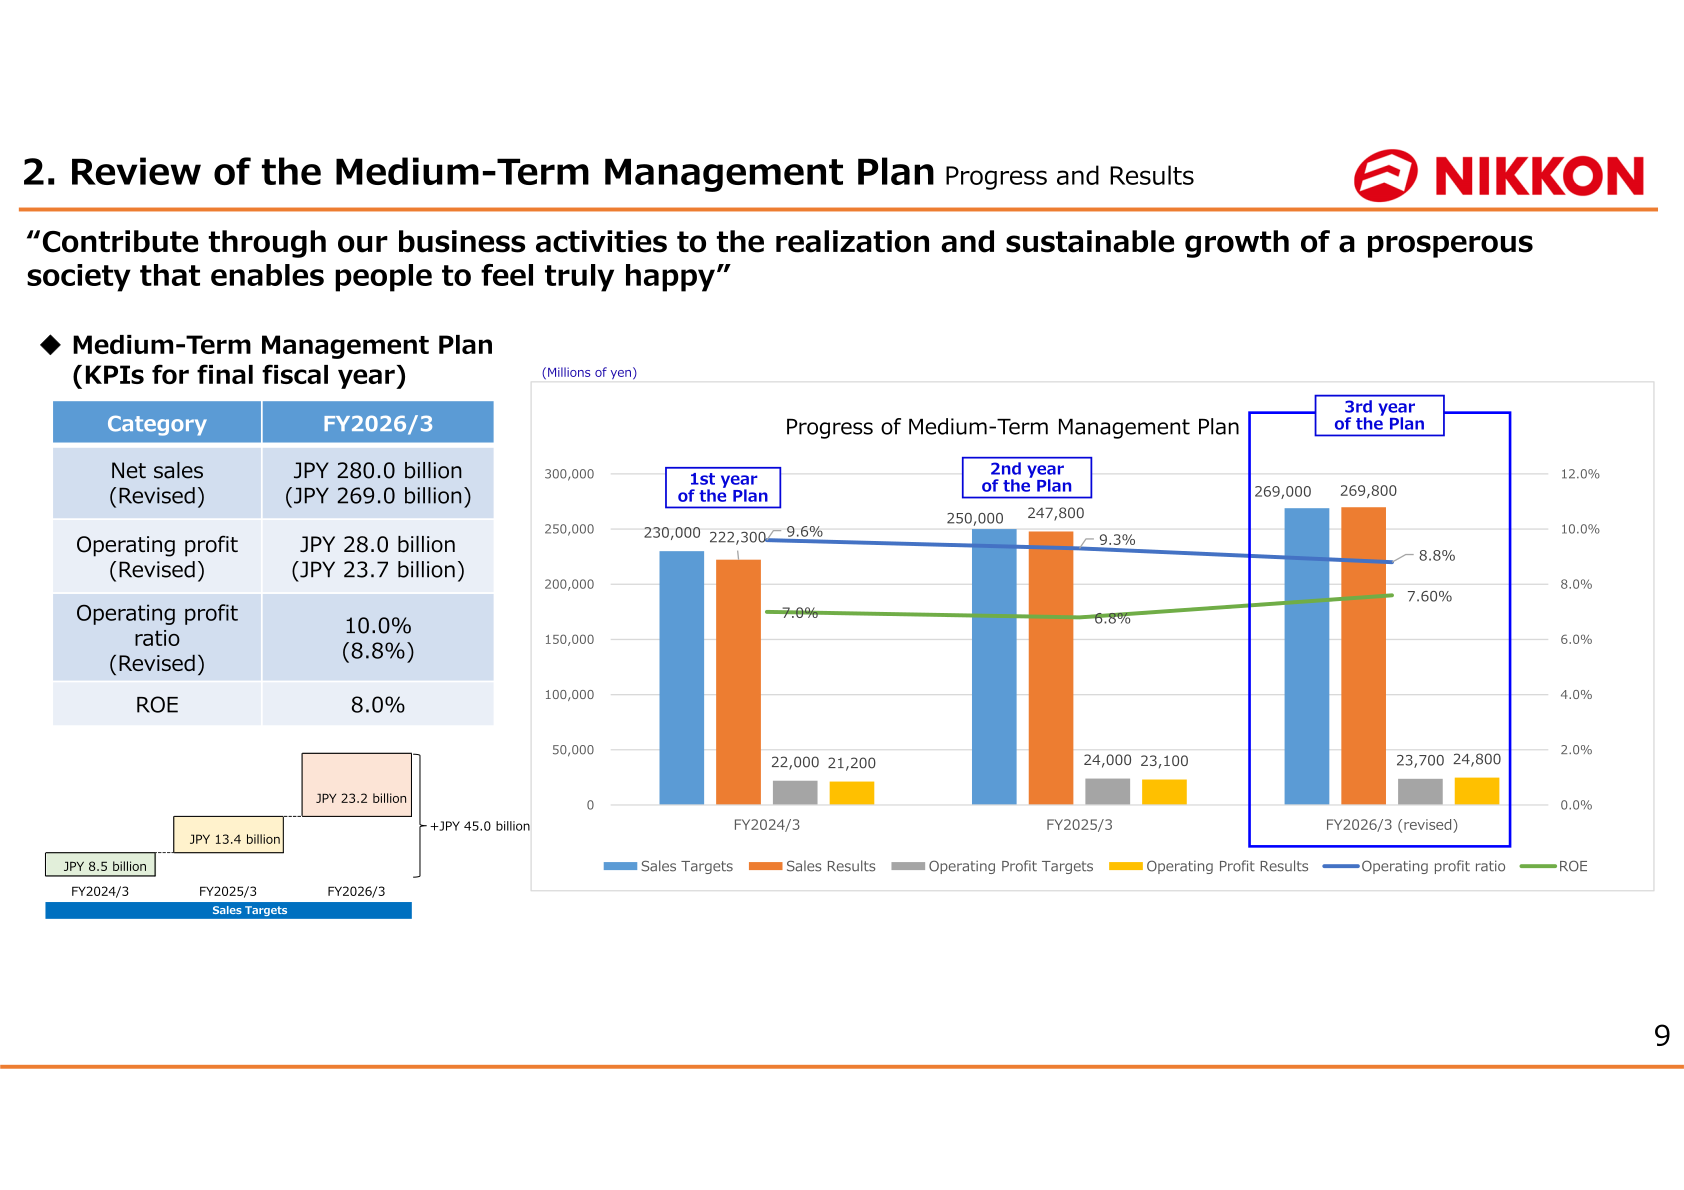
FY2026/3 was the third year of the Thirteenth Medium-Term Management Plan. The plan’s KPI table for the final fiscal year is reproduced below as presented. On the progress chart, the FY2026/3 (revised) sales target was 269,000 million yen against sales results of 269,800 million yen, with an operating profit ratio of 8.8% and ROE of 7.60%; for FY2025/3 the sales target was 250,000 million yen against results of 247,800 million yen, and for FY2024/3 the target was 230,000 million yen against results of 222,300 million yen.
| Category | FY2026/3 |
|---|---|
| Net sales (Revised) | JPY 280.0 billion (JPY 269.0 billion) |
| Operating profit (Revised) | JPY 28.0 billion (JPY 23.7 billion) |
| Operating profit ratio (Revised) | 10.0% (8.8%) |
| ROE | 8.0% |
New Medium-Term Management Plan
The company presented the basic policy, growth strategy and financial targets of its new (Fourteenth) Medium-Term Management Plan. It states that through growth in existing businesses and M&A activities it is targeting net sales of 350.0 billion yen for the fiscal year ending March 31, 2029, and that it will strive to improve capital efficiency, aiming to achieve an ROE of 10% or higher. The growth strategy comprises cultivating customers in growth industries as a priority (semiconductors, industrial machinery, aerospace and defense, medical devices, telecommunications and electric power), expansion of business revolving around coordination between Group companies, expansion of service domains and profit growth in overseas markets, and facilitating the creation of strategic logistics partners.
| Fiscal Year Ending March 31, 2029: Summary of Financial Targets | Target |
|---|---|
| Net sales | JPY 350.0 billion (including JPY 30.0 billion in contributions from M&A activities, etc.) |
| Operating profit | JPY 33.0 billion |
| Operating profit ratio | 9.4% |
| ROE | 10.0% |
| ROIC | 5.6% |
| Equity ratio | Less than 50% |
| Net interest-bearing debt/EBITDA | Approx. 2.5 times |
The plan also revises the holding policy for owned real estate: of the top 20 properties held for rent, sales of four properties worth approximately 25 billion yen are to be executed, redevelopment is planned for three properties, one property is to be held continuously, and securitization of two properties is to be determined after carefully assessing the business impact. For cross-shareholdings, the company states that it will in principle steadily reduce holdings premised on discussions with the issuing bodies of the shares, utilize the funds gained from the sales for growth investment and shareholder return, and plans to reduce cross-shareholdings by 3.0 to 5.0 billion yen over the course of the Fourteenth Medium-Term Management Plan.
Shareholder Returns
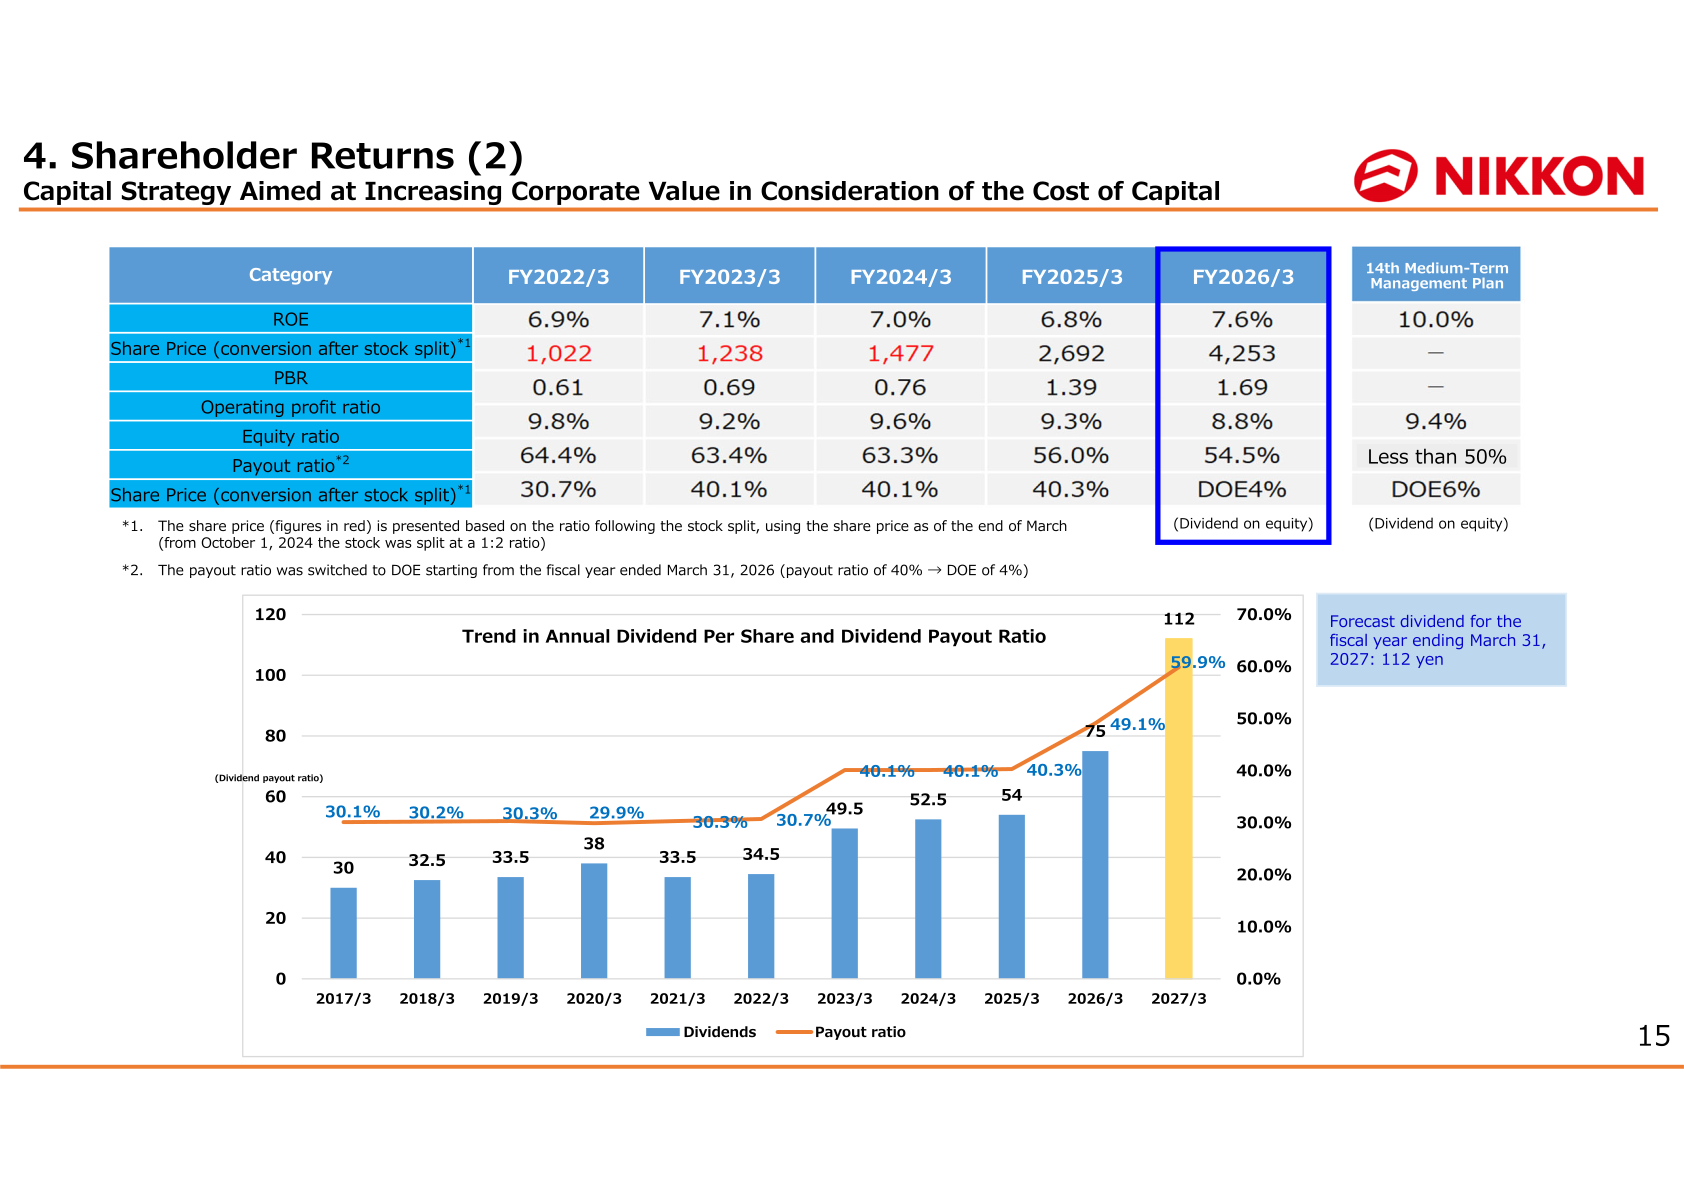
The company completed a treasury share purchase in March 2026, acquiring a total of 4.22 million shares for a total acquisition amount of 15 billion yen over an acquisition period from September 2025 to March 2026. From the current fiscal year onward, the dividend policy changes from dividend on equity (DOE) of 4% (March 2026) to DOE 6% (March 2027), and the company plans to implement treasury share purchases worth 35.0 billion yen over four years up to FY2029. A shareholder benefit program is also introduced from the current fiscal year onward for shareholders with at least 200 shares as of March 31, 2026: a three-item set of white or mixed-grain rice for a continuous holding period of less than three years, and rice (2 kg x 2 bags) for a continuous holding period of three years or more.
The annual dividend per share was 54 yen for FY2025/3 (payout ratio 40.3%) and 75 yen for FY2026/3 (49.1%). The forecast dividend for the fiscal year ending March 31, 2027 is 112 yen (59.9%). The materials note that the payout ratio was switched to DOE starting from the fiscal year ended March 31, 2026 (payout ratio of 40% to DOE of 4%).
| Category | FY2022/3 | FY2023/3 | FY2024/3 | FY2025/3 | FY2026/3 | 14th Medium-Term Management Plan |
|---|---|---|---|---|---|---|
| ROE | 6.9% | 7.1% | 7.0% | 6.8% | 7.6% | 10.0% |
| Share Price (conversion after stock split) | 1,022 | 1,238 | 1,477 | 2,692 | 4,253 | — |
| PBR | 0.61 | 0.69 | 0.76 | 1.39 | 1.69 | — |
| Operating profit ratio | 9.8% | 9.2% | 9.6% | 9.3% | 8.8% | 9.4% |
| Equity ratio | 64.4% | 63.4% | 63.3% | 56.0% | 54.5% | Less than 50% |
| Payout ratio | 30.7% | 40.1% | 40.1% | 40.3% | DOE4% | DOE6% |
ESG Initiatives
Scope 1 and 2 CO2 emission results were 168,334 in FY2026/3 against a plan of 173,340, a change of -6.51% from the results for FY2023/3 (results of 180,048 in FY2023/3), with a plan of 126,034 for 2030 and 0 for 2050 and targets of -30% and -100% (net zero) respectively. Scope 3 emissions were 206,718 in FY2023/3, 286,007 in FY2024/3 and 358,090 in FY2025/3, with FY2026/3 shown as being calculated. Under the Fourteenth Medium-Term Management Plan the company presents Scope 1+2 of 185,056 t-CO2 for FY2022 and 161,591 t-CO2 for FY2028, a reduction rate of -12.7%. The scope of calculation excludes companies that joined the Group from April 2023 onward.
This article is an analysis based on publicly available information and is not a recommendation to buy or sell any specific securities. Investment decisions are your own responsibility.
![[Obayashi] Investors’ Guide 2026 — The Complete 24-Article Breakdown](https://japan-equity.com/wp-content/uploads/2026/07/hub_cover-1024x1024.png)
![[Obayashi] IR & SR Policy — Feeding Dialogue Back into Management](https://japan-equity.com/wp-content/uploads/2026/07/p32_sq-1024x1024.jpg)
![[Obayashi] Real Estate Development — 18.7% Margin, ¥287.7bn Unrealized Gains](https://japan-equity.com/wp-content/uploads/2026/07/p20_sq-1024x1024.jpg)
![[Obayashi] Domestic Civil Engineering — Resilience Spending Supports 9.6% Margin](https://japan-equity.com/wp-content/uploads/2026/07/p11_sq-1024x1024.jpg)
![[Obayashi] Share Price & External Ratings — vs TOPIX, ESG Index Inclusion](https://japan-equity.com/wp-content/uploads/2026/07/p40_sq-1024x1024.jpg)
![[Construction] ¥75.5tn Investment, Shrinking Workforce — Big-5 Market Share](https://japan-equity.com/wp-content/uploads/2026/07/p12_sq-1024x1024.jpg)



![[Obayashi] Capital Policy & Shareholder Returns — ROE 10%+, DOE ~5%, ¥100bn Buyback](https://japan-equity.com/wp-content/uploads/2026/07/p27_sq-1024x1024.jpg)
![[Obayashi] Reducing Cross-Shareholdings — ¥285.2bn Sold in Five Years](https://japan-equity.com/wp-content/uploads/2026/07/p29_sq-1024x1024.jpg)
![[Obayashi] ¥750bn Investment Plan — ¥300bn to Development, ¥190bn to Tech/DX](https://japan-equity.com/wp-content/uploads/2026/07/p30_sq-1024x1024.jpg)
![[Obayashi] MTP2022 KPIs — Operating Profit ~2x Target, ROE 14.4%](https://japan-equity.com/wp-content/uploads/2026/07/p25_sq-1024x1024.jpg)
![[Obayashi] Cash Allocation — ¥420bn Investment CF Over Five Years](https://japan-equity.com/wp-content/uploads/2026/07/p26_sq-1024x1024.jpg)
![[Obayashi] Green Energy — 44 Plants, 344MW, and the Green Hydrogen Challenge](https://japan-equity.com/wp-content/uploads/2026/07/p21_sq-1024x1024.jpg)
![[Obayashi] Tackling the Labor Shortage — Robotics Construction®](https://japan-equity.com/wp-content/uploads/2026/07/p14_sq-1024x1024.jpg)
