
This article is based on publicly available IR materials and is not a recommendation to buy or sell any specific securities.
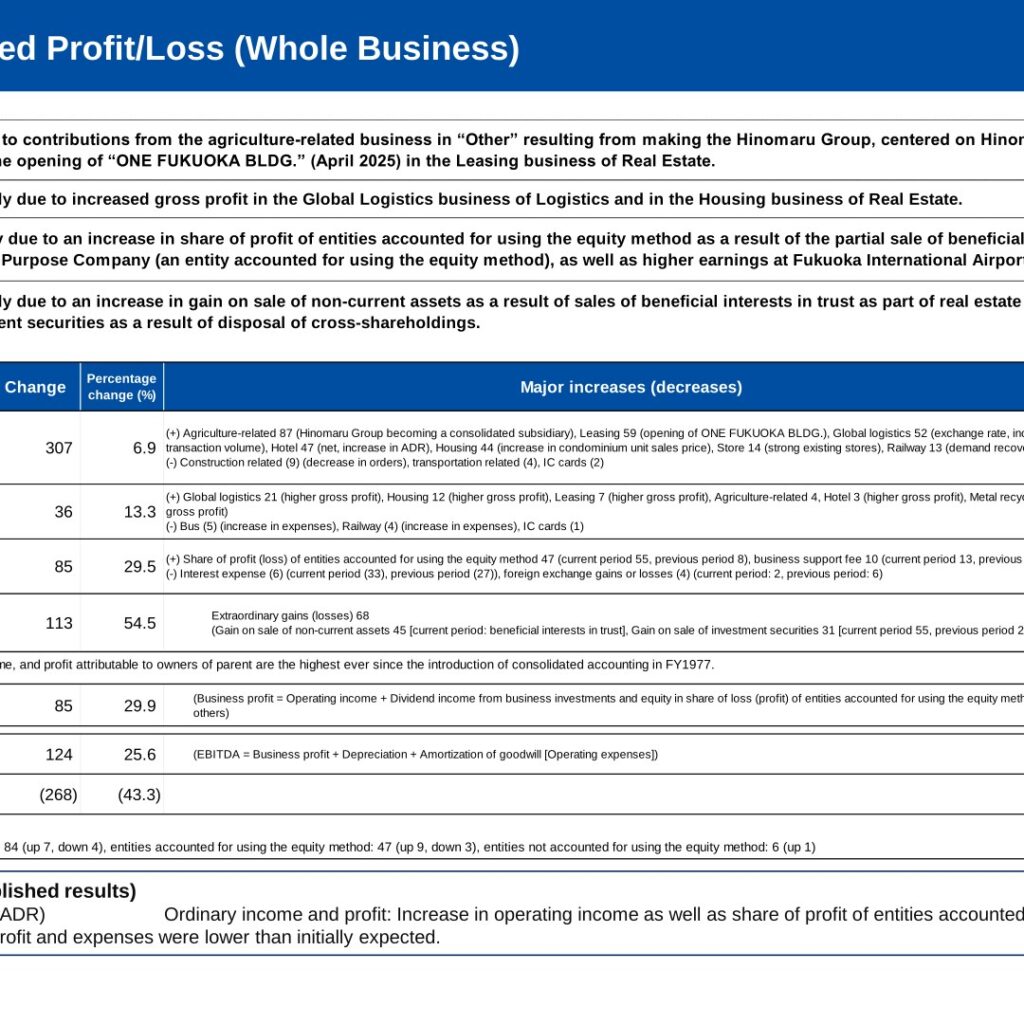
Nishi-Nippon Railroad Co., Ltd. (Nishitetsu, 9031) released its Financial Results Briefing for FY2025 (Fiscal Year Ended March 31, 2026) on Wednesday, May 20, 2026. Consolidated operating revenue came to 4,742 (0.1 billion of yen), up 307 or 6.9% year on year, with operating income of 302, ordinary income of 372 and profit attributable to owners of parent of 322. The materials state that operating income, ordinary income, and profit attributable to owners of parent are the highest ever since the introduction of consolidated accounting in FY1977. For FY2026 the company forecasts operating revenue of 5,100 and profit attributable to owners of parent of 225 under a newly reorganized segment structure.
Consolidated Results (Full-Year Actual)
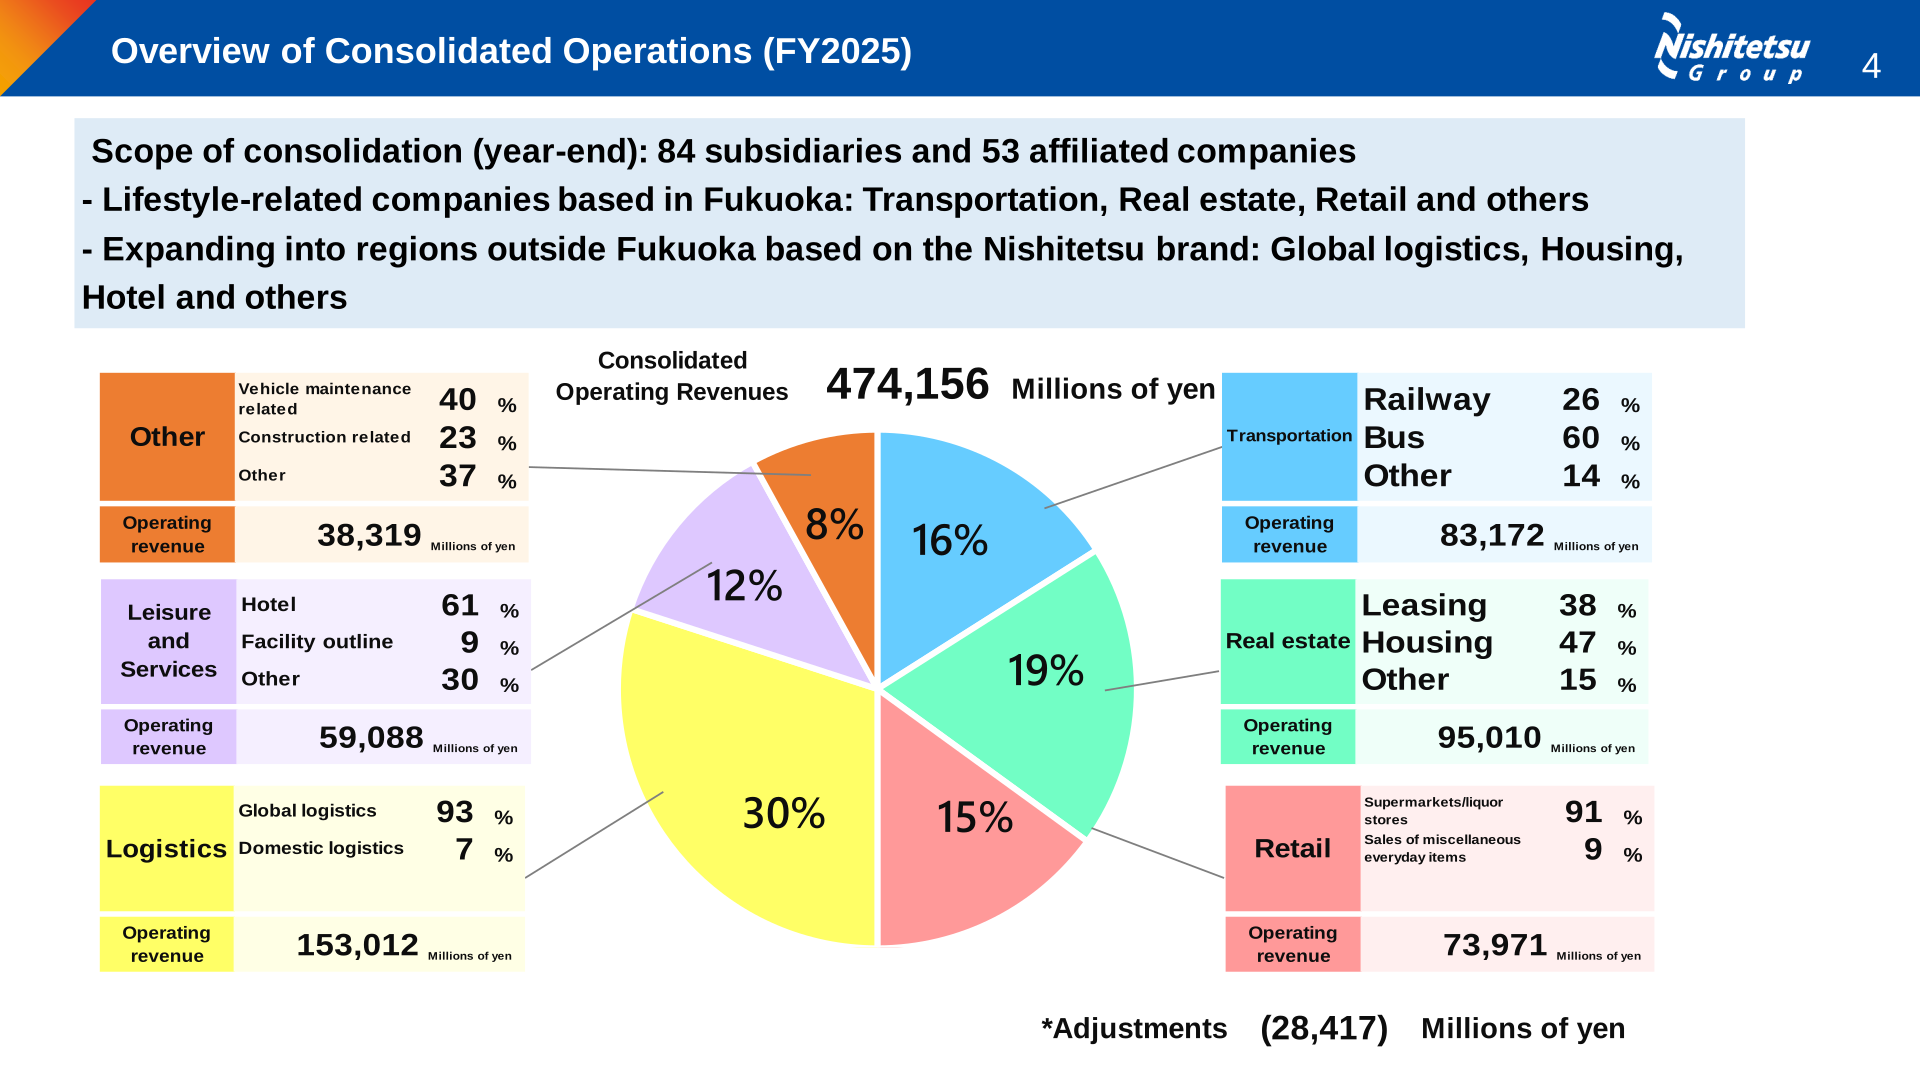
Consolidated operating revenues were 474,156 Millions of yen, with adjustments of (28,417) Millions of yen. Scope of consolidation at year-end was 84 subsidiaries and 53 affiliated companies. Revenue increased due to contributions from the agriculture-related business in “Other” resulting from making the Hinomaru Group, centered on Hinomaru Co., Ltd., a consolidated subsidiary as well as the opening of “ONE FUKUOKA BLDG.” (April 2025) in the Leasing business of Real Estate. Operating income increased mainly due to increased gross profit in the Global Logistics business of Logistics and in the Housing business of Real Estate. Ordinary income increased partly due to an increase in share of profit of entities accounted for using the equity method as a result of the partial sale of beneficial interests in trust related to the Daimyo Project Special Purpose Company, as well as higher earnings at Fukuoka International Airport Co., Ltd. Profit attributable to owners of parent increased mainly due to an increase in gain on sale of non-current assets as a result of sales of beneficial interests in trust as part of real estate securitization, and an increase in gain on sale of investment securities as a result of disposal of cross-shareholdings.
Figures in the table below are presented in the unit used in the presentation, 0.1 billion of yen. Business profit is defined in the materials as operating income plus dividend income from business investments and equity in share of loss (profit) of entities accounted for using the equity method and others; EBITDA is defined as business profit plus depreciation plus amortization of goodwill (operating expenses).
| Item (0.1 billion of yen) | FY2025 | FY2024 | Change | Percentage change (%) |
|---|---|---|---|---|
| Operating revenue | 4,742 | 4,435 | 307 | 6.9 |
| Operating income | 302 | 267 | 36 | 13.3 |
| Ordinary income | 372 | 287 | 85 | 29.5 |
| Profit attributable to owners of parent | 322 | 208 | 113 | 54.5 |
| Business profit | 369 | 284 | 85 | 29.9 |
| EBITDA | 610 | 486 | 124 | 25.6 |
| Capital investment | 350 | 618 | (268) | (43.3) |
On the balance sheet, total assets stood at 8,209 (0.1 billion of yen) as of March 31, 2026 versus 7,821 a year earlier, and interest-bearing debt was 3,630 versus 3,662. The equity ratio improved to 34.6% from 31.8%, the shareholders’ equity ratio to 29.4% from 27.7%, and net assets per share rose to 3,759.40 Yen from 3,214.37 Yen. Cash flows from operating activities were 386 against 156 in the previous year, investing activities were (303) against (745), and financing activities were (133) against 392; cash and cash equivalents at end of period were 458 versus 504.
Segment Results
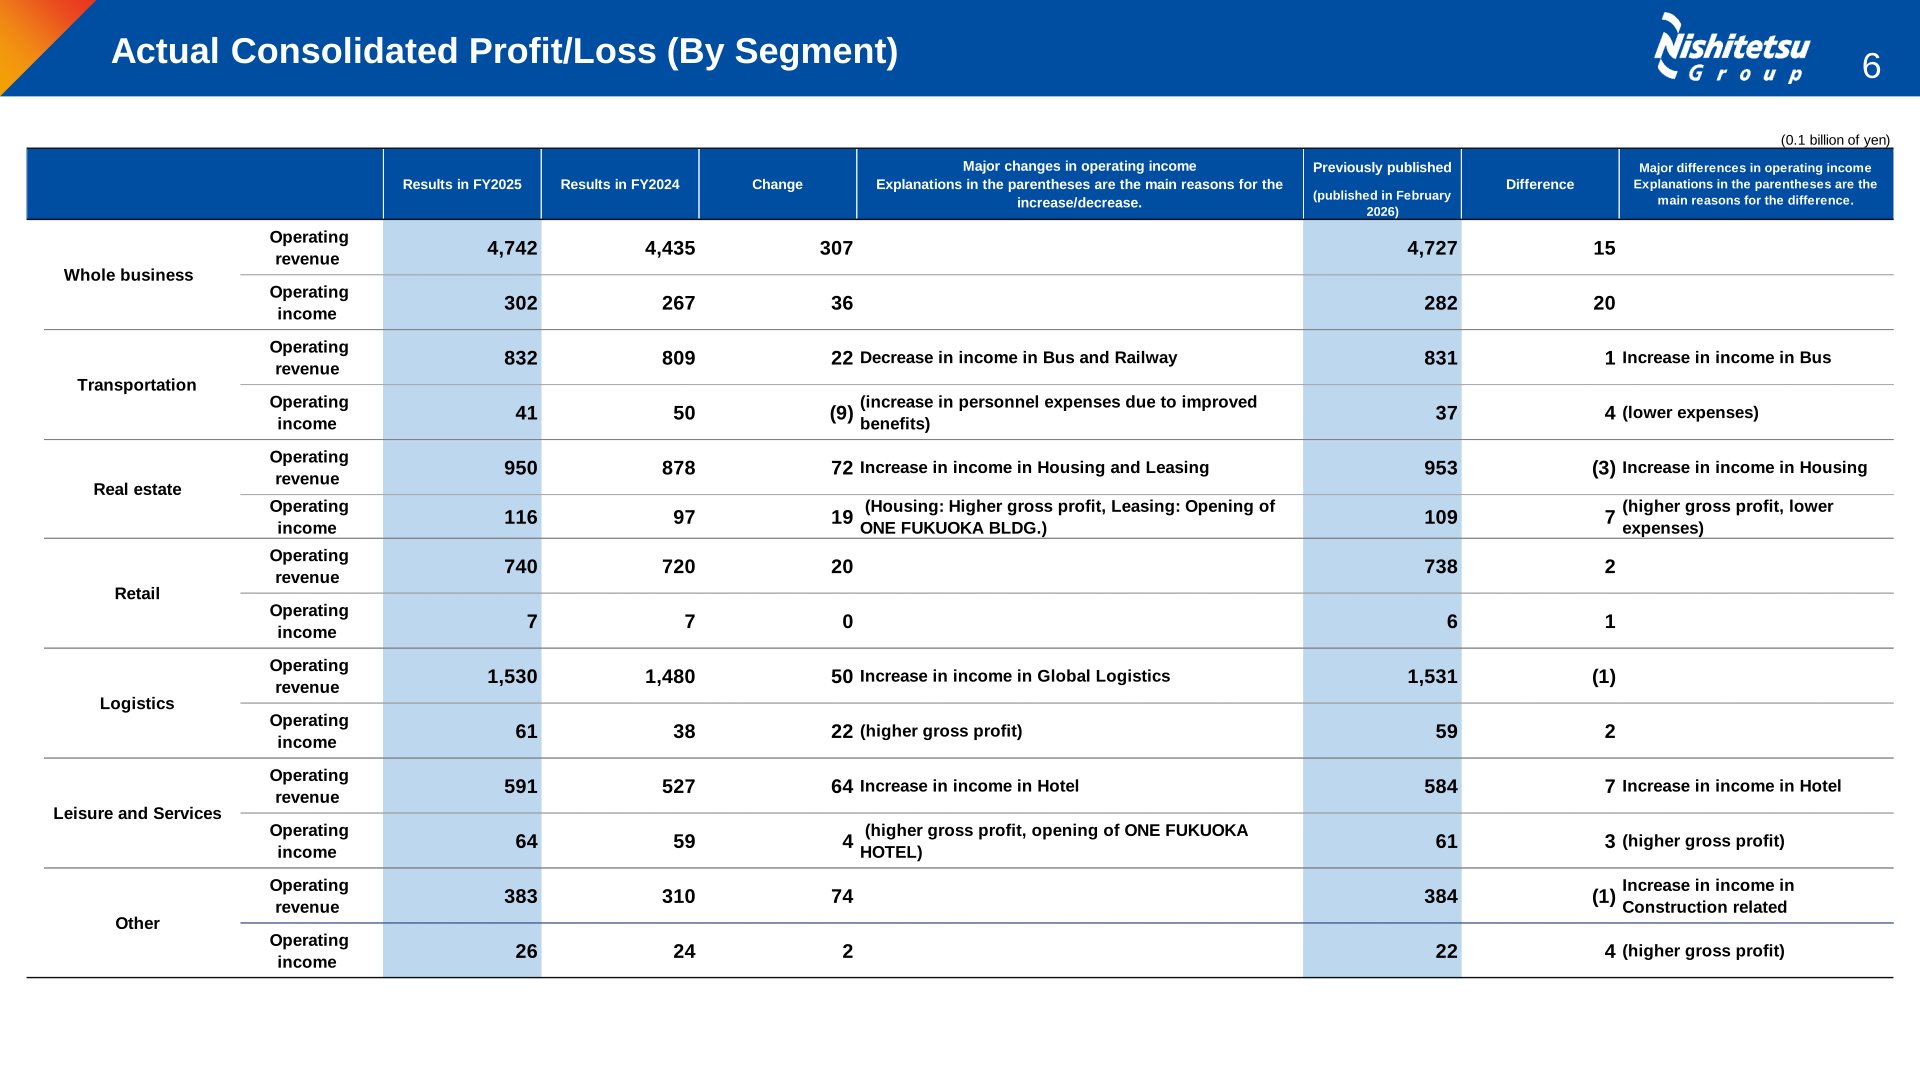
By segment (former classification), Logistics was the largest revenue contributor at 1,530 (0.1 billion of yen) and recorded the largest operating income increase, up 22 to 61 on higher gross profit in Global Logistics. Real estate delivered operating income of 116, up 19, on higher gross profit in Housing and the opening of ONE FUKUOKA BLDG. in Leasing. Transportation was the only segment with lower operating income, down 9 to 41 on an increase in personnel expenses due to improved benefits.
| Segment | Metric (0.1 billion of yen) | FY2025 | FY2024 | Change |
|---|---|---|---|---|
| Whole business | Operating revenue | 4,742 | 4,435 | 307 |
| Whole business | Operating income | 302 | 267 | 36 |
| Transportation | Operating revenue | 832 | 809 | 22 |
| Transportation | Operating income | 41 | 50 | (9) |
| Real estate | Operating revenue | 950 | 878 | 72 |
| Real estate | Operating income | 116 | 97 | 19 |
| Retail | Operating revenue | 740 | 720 | 20 |
| Retail | Operating income | 7 | 7 | 0 |
| Logistics | Operating revenue | 1,530 | 1,480 | 50 |
| Logistics | Operating income | 61 | 38 | 22 |
| Leisure and Services | Operating revenue | 591 | 527 | 64 |
| Leisure and Services | Operating income | 64 | 59 | 4 |
| Other | Operating revenue | 383 | 310 | 74 |
| Other | Operating income | 26 | 24 | 2 |
In Transportation, operating revenue was 83,172 Millions of yen (up 2.8%) and operating income was 4,055 Millions of yen (down 18.6%). Railway revenue was 23,866 Millions of yen (up 5.6%) and Bus revenue was 56,317 Millions of yen (up 0.8%). In the Railway business, revenues increased due to higher passenger volume mainly resulting from a recovery in demand. In the Bus business, although revenue declined due to service reductions following timetable revisions, overall revenue increased with the recovery of demand for express buses mainly due to stronger inbound demand and the opening of ONE FUKUOKA BLDG. Operating income decreased due to an increase in personnel expenses resulting from improved working conditions.
| Item (Millions of yen, Thousands of passengers) | FY2025 | FY2024 | Change | Percentage change |
|---|---|---|---|---|
| Railway: Passenger revenue | 22,721 | 21,560 | 1,161 | 5.4 % |
| Railway: Number of passengers | 112,883 | 107,015 | 5,868 | 5.5 % |
| Railway: Non-commuter | 49,700 | 46,692 | 3,008 | 6.4 % |
| Railway: Commuter | 63,183 | 60,323 | 2,860 | 4.7 % |
| Bus: Passenger revenue | 46,672 | 45,739 | 932 | 2.0 % |
| Bus: Charter and specific revenues | 4,164 | 4,056 | 108 | 2.7 % |
| Bus: Number of passengers | 207,639 | 207,637 | 2 | 0.0 % |
| Bus: Non-commuter | 118,625 | 118,659 | (34) | △0.0 % |
| Bus: Commuter | 89,014 | 88,978 | 36 | 0.0 % |
In Real Estate, operating revenue was 95,010 Millions of yen (up 8.2%) and operating income was 11,624 Millions of yen (up 19.4%), with Leasing revenue of 38,727 Millions of yen and Housing revenue of 48,022 Millions of yen; total housing units sold were 852 against 885 a year earlier. In Logistics, operating revenue was 153,012 Millions of yen (up 3.4%) and operating income was 6,080 Millions of yen (up 58.0%), with Global logistics revenue of 160,122 Millions of yen and operating income of 6,011 Millions of yen, reflecting an increase in yen equivalent caused by foreign exchange fluctuation and higher import and export cargo volumes. In Leisure and Services, operating revenue was 59,088 Millions of yen (up 12.1%) and operating income was 6,371 Millions of yen (up 7.4%), with Hotel revenue of 37,426 Millions of yen and Hotel operating income of 3,867 Millions of yen. In Retail, operating revenue was 73,971 Millions of yen (up 2.8%) and operating income was 670 Millions of yen (up 2.4%). In Others, operating revenue was 38,319 Millions of yen (up 23.8%) and operating income was 2,571 Millions of yen (up 8.8%), mainly due to making Hinomaru Group a consolidated subsidiary in the agriculture-related business, which contributed revenue of 8,692 Millions of yen.
FY2026 Forecast
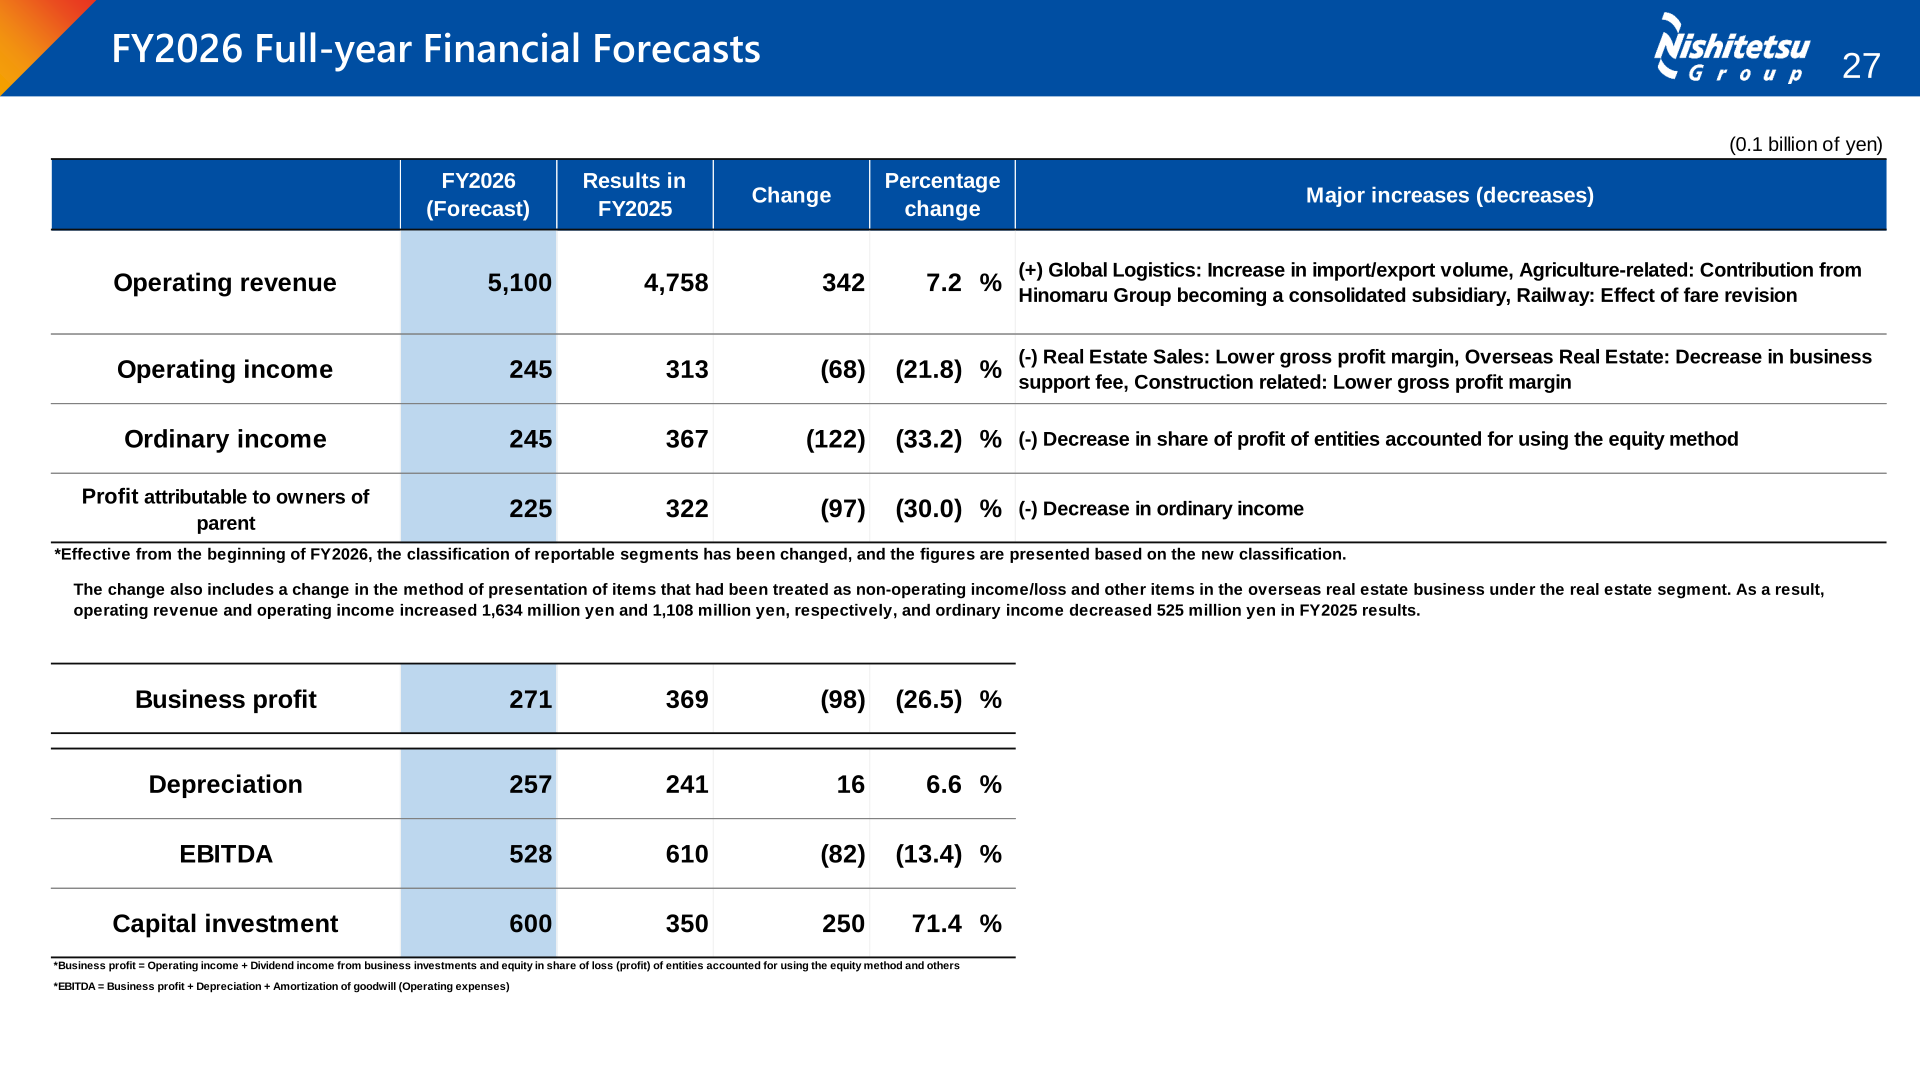
Starting from FY2026, the company updates its segment structure in order to implement management practices in alignment with CYD Vision 2035: “Transportation” is renamed “Mobility”; “Real estate” is restructured into Real estate leasing, Real estate sales, Overseas real estate and Real estate solutions; Hotel, Travel and Leisure are separated from “Leisure and Services” to create “Hotel and Leisure”; “Retail” is renamed “Retail and Restaurants”; there are no changes to “Logistics”; and other business segments are reorganized and renamed to create “Business support”. The FY2025 comparatives shown in the forecast tables are therefore presented on the new classification. The materials also note that the change includes a change in the method of presentation of items that had been treated as non-operating income/loss and other items in the overseas real estate business under the real estate segment, and that as a result operating revenue and operating income increased 1,634 million yen and 1,108 million yen, respectively, and ordinary income decreased 525 million yen in FY2025 results.
| Item (0.1 billion of yen) | FY2026 (Forecast) | Results in FY2025 | Change | Percentage change |
|---|---|---|---|---|
| Operating revenue | 5,100 | 4,758 | 342 | 7.2 % |
| Operating income | 245 | 313 | (68) | (21.8) % |
| Ordinary income | 245 | 367 | (122) | (33.2) % |
| Profit attributable to owners of parent | 225 | 322 | (97) | (30.0) % |
| Business profit | 271 | 369 | (98) | (26.5) % |
| Depreciation | 257 | 241 | 16 | 6.6 % |
| EBITDA | 528 | 610 | (82) | (13.4) % |
| Capital investment | 600 | 350 | 250 | 71.4 % |
The materials attribute the revenue increase to Global Logistics (increase in import/export volume), Agriculture-related (contribution from Hinomaru Group becoming a consolidated subsidiary) and Railway (effect of fare revision), while the decline in operating income is attributed to Real Estate Sales (lower gross profit margin), Overseas Real Estate (decrease in business support fee) and Construction related (lower gross profit margin). The decrease in ordinary income reflects a decrease in share of profit of entities accounted for using the equity method.
| Segment (new classification) | Metric (0.1 billion of yen) | FY2026 (Forecast) | Results in FY2025 | Change |
|---|---|---|---|---|
| Whole business | Operating revenue | 5,100 | 4,758 | 342 |
| Whole business | Operating income | 245 | 313 | (68) |
| Mobility | Operating revenue | 1,033 | 982 | 51 |
| Mobility | Operating income | 58 | 58 | 0 |
| Real estate | Operating revenue | 1,000 | 966 | 34 |
| Real estate | Operating income | 74 | 118 | (44) |
| Hotel and Leisure | Operating revenue | 460 | 444 | 16 |
| Hotel and Leisure | Operating income | 47 | 52 | (5) |
| Retail and Restaurants | Operating revenue | 765 | 742 | 23 |
| Retail and Restaurants | Operating income | 5 | 5 | (0) |
| Logistics | Operating revenue | 1,680 | 1,530 | 150 |
| Logistics | Operating income | 59 | 61 | (2) |
| Business support | Operating revenue | 385 | 314 | 71 |
| Business support | Operating income | 10 | 23 | (13) |
Shareholder Returns
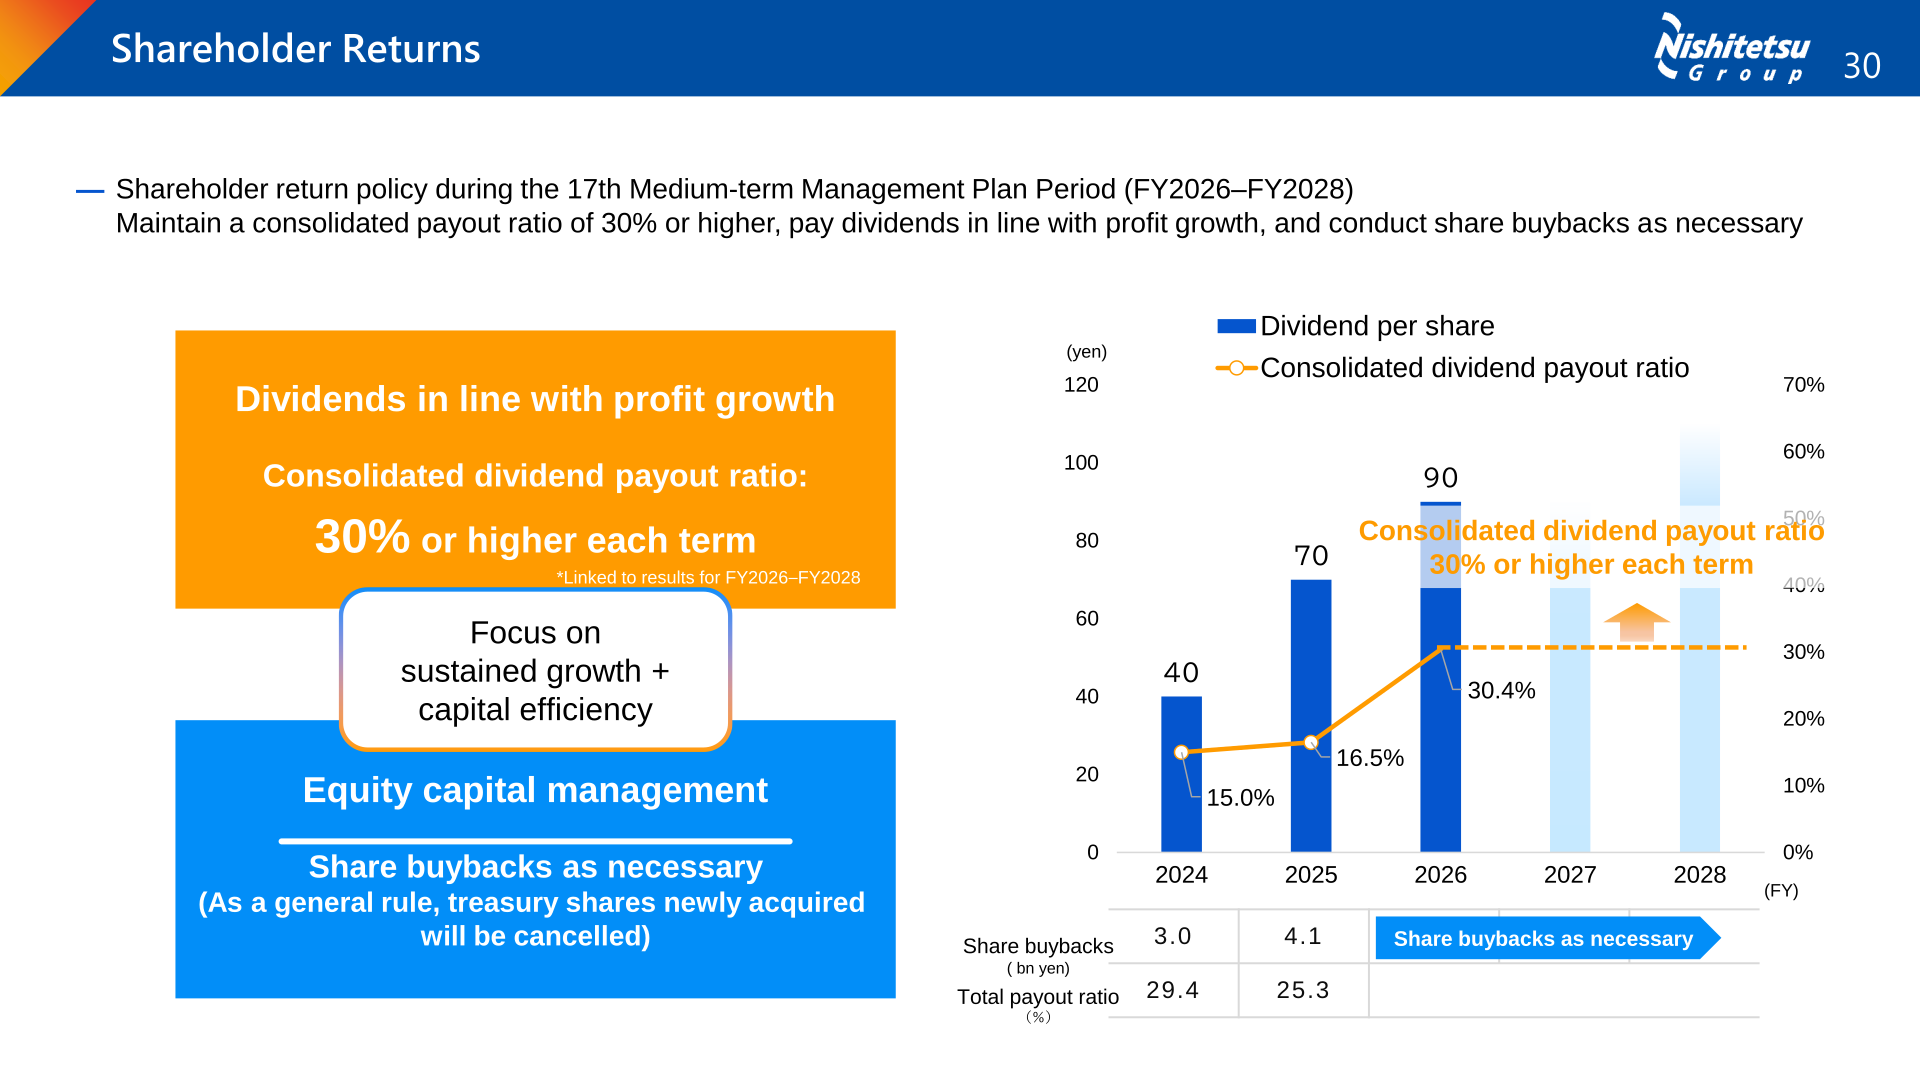
The dividend policy stated in the materials places emphasis on stable return of profits: the company’s policy is to pay dividends on a steady and continuous basis while strengthening its financial position and operating foundation by securing an optimal level of retained earnings. For FY2025 the most recent dividend forecast was revised upward from 50 yen to 70 yen per year, including a year-end dividend of 45 yen, against 40 yen for FY2024. On the consolidated dividend payout ratio, the materials show 15.0% for FY2024 and 16.5% for FY2025, with total payout ratios of 29.4% and 25.3% respectively. On share buybacks, the company conducts a share buyback as appropriate in response to changes in its business environment and financial performance with capital efficiency in mind; in FY2025 two million shares were acquired for 4.1 billion yen, using funds from the sale of shares held by the company through a review of the size of its policy shareholdings, following 3.0 bn yen of share buybacks in FY2024.
Under the shareholder return policy for the 17th Medium-term Management Plan period (FY2026–FY2028), the company will maintain a consolidated payout ratio of 30% or higher, pay dividends in line with profit growth, and conduct share buybacks as necessary, with treasury shares newly acquired to be cancelled as a general rule. The dividend per share shown for FY2026 is 90 yen, with a consolidated dividend payout ratio of 30.4%.
Medium-Term Plan and Topics
Reviewing the 16th Medium-term Management Plan (2023-2025), the materials state that consolidated business profit and consolidated EBITDA achieved the plan targets, and that gross profit growth in the real estate segment, the demand increase in the railway business, and asset disposals drove the FY2025 ROE to 12.1%, achieving the target set out in the plan. FY2025 results were consolidated business profit of 36.9 bn yen, consolidated EBITDA of 61.0 bn yen, a net interest-bearing debt to EBITDA ratio of 5.2 times and a D/E ratio of 1.3 times.
The 17th Mid-term Management Plan (2026-2028) is themed “A new stage of growth opened up through people, knowhow, and brand equity” and sets FY2028 financial indicators of consolidated business profit of 40.0 bn yen, consolidated EBITDA of 70.0 bn yen, ROE of approximately 9%, a net interest-bearing debt to EBITDA ratio of approximately 6x and a D/E ratio of approximately 1.4 times. FY2035 targets under CYD Vision 2035 were raised to consolidated business profit of 60.0 bn yen, consolidated EBITDA of 90.0 bn yen and ROE of approximately 10%. The investment plan for the three years from FY2026 to FY2028 totals 210.0 bn yen, and the materials note that although profit will temporarily decline in FY2026, it is expected to exceed the FY2025 level (excluding temporary share of profit of entities accounted for using the equity method) in FY2027.
This article is an analysis based on publicly available information and is not a recommendation to buy or sell any specific securities. Investment decisions are your own responsibility.
![[Obayashi] Investors’ Guide 2026 — The Complete 24-Article Breakdown](https://japan-equity.com/wp-content/uploads/2026/07/hub_cover-1024x1024.png)
![[Obayashi] IR & SR Policy — Feeding Dialogue Back into Management](https://japan-equity.com/wp-content/uploads/2026/07/p32_sq-1024x1024.jpg)
![[Obayashi] Real Estate Development — 18.7% Margin, ¥287.7bn Unrealized Gains](https://japan-equity.com/wp-content/uploads/2026/07/p20_sq-1024x1024.jpg)
![[Obayashi] Domestic Civil Engineering — Resilience Spending Supports 9.6% Margin](https://japan-equity.com/wp-content/uploads/2026/07/p11_sq-1024x1024.jpg)
![[Obayashi] Share Price & External Ratings — vs TOPIX, ESG Index Inclusion](https://japan-equity.com/wp-content/uploads/2026/07/p40_sq-1024x1024.jpg)
![[Construction] ¥75.5tn Investment, Shrinking Workforce — Big-5 Market Share](https://japan-equity.com/wp-content/uploads/2026/07/p12_sq-1024x1024.jpg)



![[Obayashi] Capital Policy & Shareholder Returns — ROE 10%+, DOE ~5%, ¥100bn Buyback](https://japan-equity.com/wp-content/uploads/2026/07/p27_sq-1024x1024.jpg)
![[Obayashi] Reducing Cross-Shareholdings — ¥285.2bn Sold in Five Years](https://japan-equity.com/wp-content/uploads/2026/07/p29_sq-1024x1024.jpg)
![[Obayashi] ¥750bn Investment Plan — ¥300bn to Development, ¥190bn to Tech/DX](https://japan-equity.com/wp-content/uploads/2026/07/p30_sq-1024x1024.jpg)
![[Obayashi] MTP2022 KPIs — Operating Profit ~2x Target, ROE 14.4%](https://japan-equity.com/wp-content/uploads/2026/07/p25_sq-1024x1024.jpg)
![[Obayashi] Cash Allocation — ¥420bn Investment CF Over Five Years](https://japan-equity.com/wp-content/uploads/2026/07/p26_sq-1024x1024.jpg)
![[Obayashi] Green Energy — 44 Plants, 344MW, and the Green Hydrogen Challenge](https://japan-equity.com/wp-content/uploads/2026/07/p21_sq-1024x1024.jpg)
![[Obayashi] Tackling the Labor Shortage — Robotics Construction®](https://japan-equity.com/wp-content/uploads/2026/07/p14_sq-1024x1024.jpg)
