
This article is based on publicly available IR materials and is not a recommendation to buy or sell any specific securities.
Note: Following japan-equity.com’s site convention, the fiscal year ended March 31, 2026 is referred to here as FY2025. However, the figures, tables and segment data below retain West Japan Railway Company’s (JR West) own source labels (FY25.3, FY26.3, FY27.3).
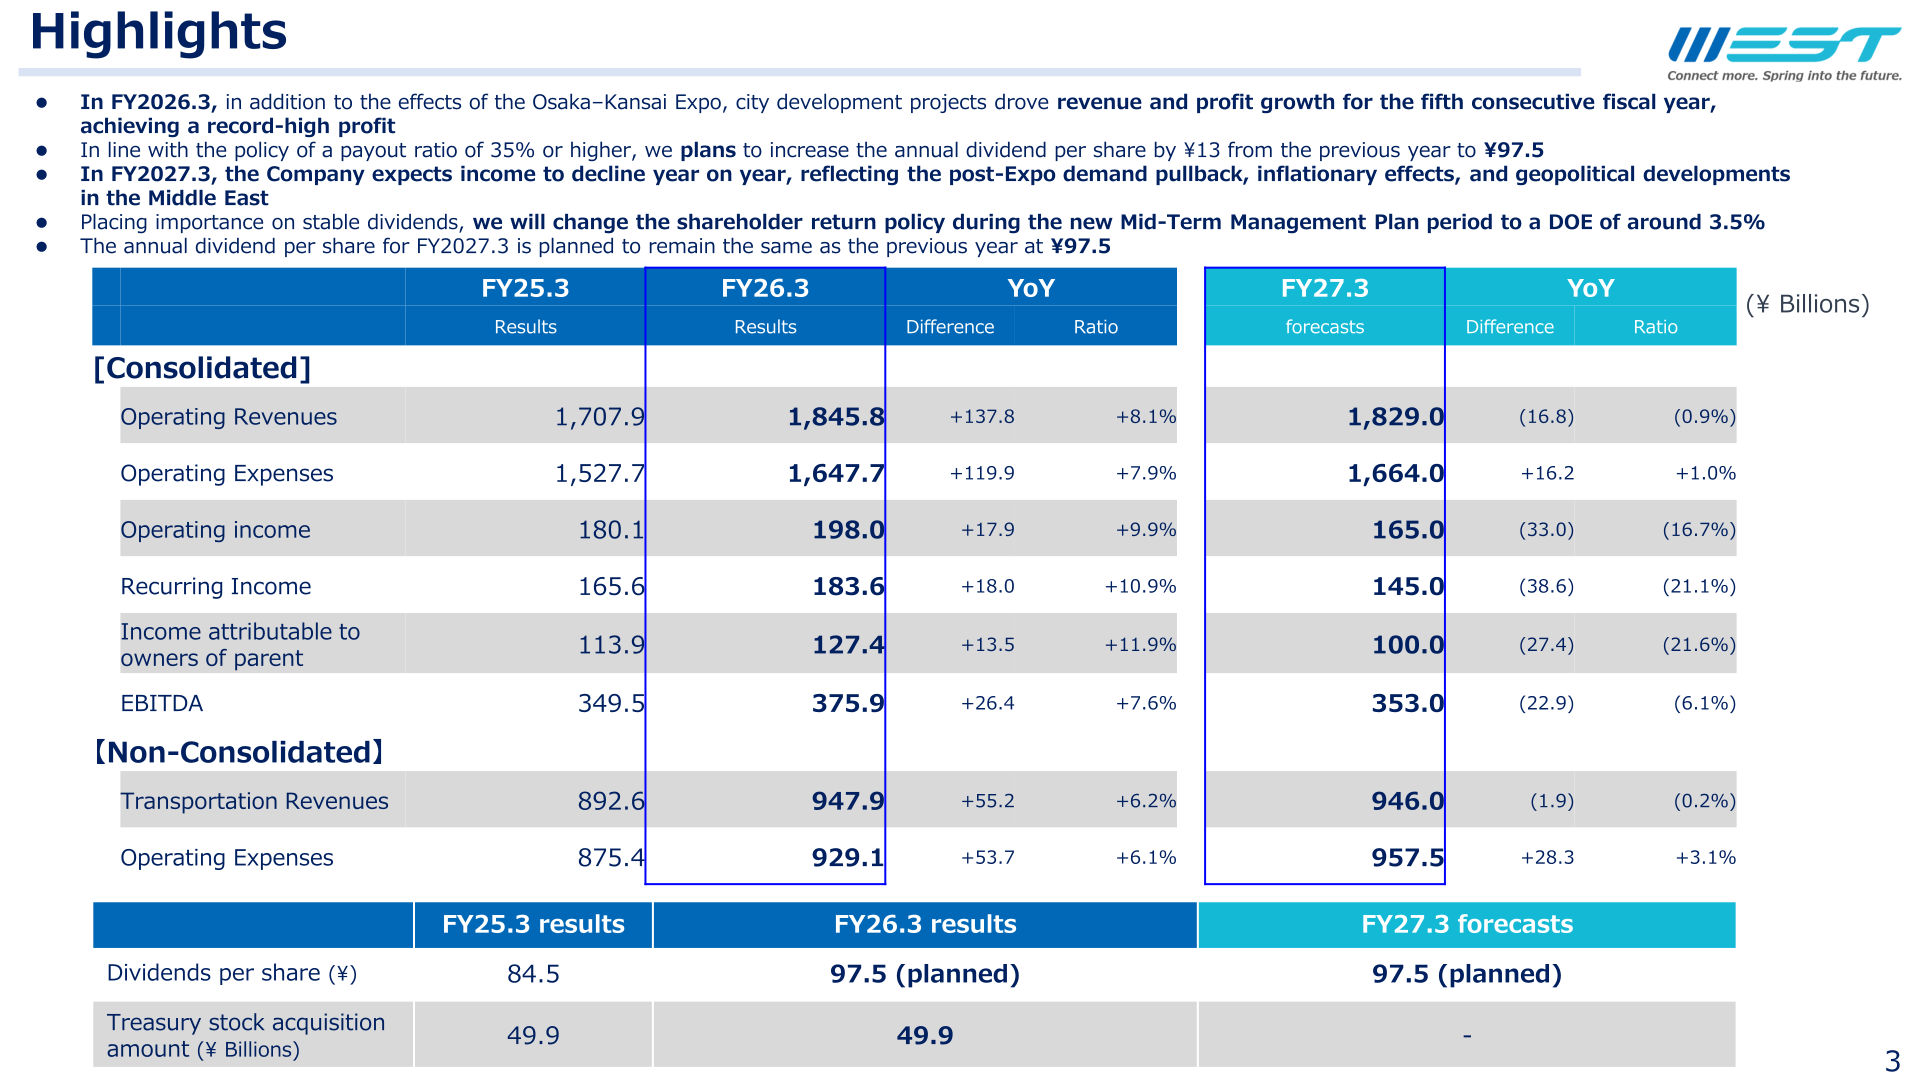
JR West reported record consolidated operating income of ¥198.0 billion for FY26.3, up +9.9% year on year, as the Osaka-Kansai Expo and ongoing city development projects drove revenue and profit growth for a fifth consecutive fiscal year. Income attributable to owners of parent rose +11.9% to ¥127.4 billion. In line with its payout-ratio policy, the company plans to raise the annual dividend per share by ¥13.0 to ¥97.5. For FY27.3, JR West forecasts a year-on-year decline in income, reflecting the post-Expo demand pullback, inflationary effects, and geopolitical developments in the Middle East. Alongside these results, the company unveiled its new Mid-Term Management Plan 2030.
Consolidated Results (Full-Year Actual)
Consolidated operating revenues rose +8.1% to ¥1,845.8 billion and operating income rose +9.9% to ¥198.0 billion. Recurring income increased +10.9% to ¥183.6 billion, and EBITDA rose +7.6% to ¥375.9 billion. Non-consolidated transportation revenues increased +6.2% to ¥947.9 billion.
| Item (¥ Billions) | FY25.3 Results | FY26.3 Results | YoY Change |
|---|---|---|---|
| Operating Revenues | 1,707.9 | 1,845.8 | +137.8 (+8.1%) |
| Operating Expenses | 1,527.7 | 1,647.7 | +119.9 (+7.9%) |
| Operating income | 180.1 | 198.0 | +17.9 (+9.9%) |
| Recurring Income | 165.6 | 183.6 | +18.0 (+10.9%) |
| Income attributable to owners of parent | 113.9 | 127.4 | +13.5 (+11.9%) |
| EBITDA | 349.5 | 375.9 | +26.4 (+7.6%) |
| Non-Consolidated Transportation Revenues | 892.6 | 947.9 | +55.2 (+6.2%) |
| Non-Consolidated Operating Expenses | 875.4 | 929.1 | +53.7 (+6.1%) |
Segment Results
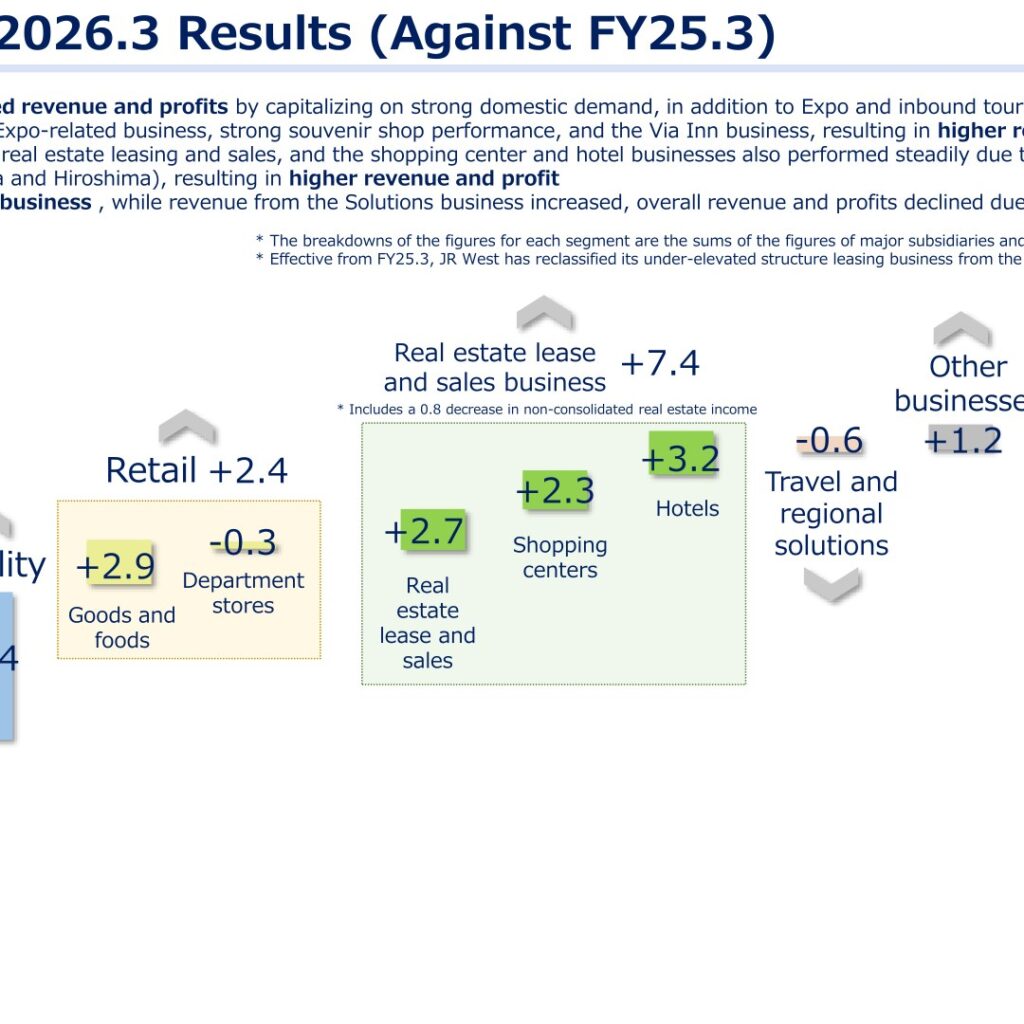
Mobility revenue and profit increased by capitalizing on strong domestic demand in addition to the Expo and inbound tourism, with operating income up +8.4 billion yen to ¥130.9 billion. Retail benefited from Expo-related business, strong souvenir shop performance, and the VIA INN hotel business, with operating income up +2.4 billion yen to ¥16.2 billion. Real estate expanded its leasing and sales business, and the shopping center and hotel businesses also performed steadily on the opening effects of city development projects in Osaka and Hiroshima, with operating income up +7.4 billion yen to ¥46.3 billion. Travel and Regional Solutions revenue increased on growth in the Solutions business, but overall profit declined -0.6 billion yen to ¥0.5 billion due to a decrease in Tourism business revenue. Per the source materials, the breakdown figures for each segment are the sums of the figures of major subsidiaries and do not match the segment totals exactly.
| Segment: Operating Income (¥ Billions) | FY25.3 Results | FY26.3 Results | FY27.3 Forecast |
|---|---|---|---|
| Mobility | 122.5 | 130.9 | 100.5 |
| Retail Business | 13.8 | 16.2 | 13.0 |
| Real estate | 38.9 | 46.3 | 45.5 |
| Travel and regional solutions | 1.1 | 0.5 | 1.0 |
| Other businesses | 4.1 | 5.4 | 5.5 |
| Consolidated operating income | 180.1 | 198.0 | 165.0 |
FY27.3 Forecast
For FY27.3, JR West forecasts consolidated operating income of ¥165.0 billion, down (33.0) billion yen, or (16.7%), year on year, reflecting the dissipation of Expo effects, inflationary cost increases, and an assumed impact from developments in the Middle East. The company’s plan assumes an operating income decrease of -13.0 billion yen from the Middle East situation, based on a fiscal-year average crude oil price of $100/barrel, a decline of 0.8 million inbound visitors, and a -0.3% GDP impact, under a scenario in which the conflict becomes prolonged and transportation through the Strait of Hormuz is restricted throughout the year.
| Item (¥ Billions) | FY26.3 Results | FY27.3 Forecast | YoY Change |
|---|---|---|---|
| Operating Revenues | 1,845.8 | 1,829.0 | (16.8) (0.9%) |
| Operating Expenses | 1,647.7 | 1,664.0 | +16.2 (+1.0%) |
| Operating income | 198.0 | 165.0 | (33.0) (16.7%) |
| Recurring Income | 183.6 | 145.0 | (38.6) (21.1%) |
| Income attributable to owners of parent | 127.4 | 100.0 | (27.4) (21.6%) |
| EBITDA | 375.9 | 353.0 | (22.9) (6.1%) |
| Non-Consolidated Transportation Revenues | 947.9 | 946.0 | (1.9) (0.2%) |
| Non-Consolidated Operating Expenses | 929.1 | 957.5 | +28.3 (+3.1%) |
Shareholder Returns
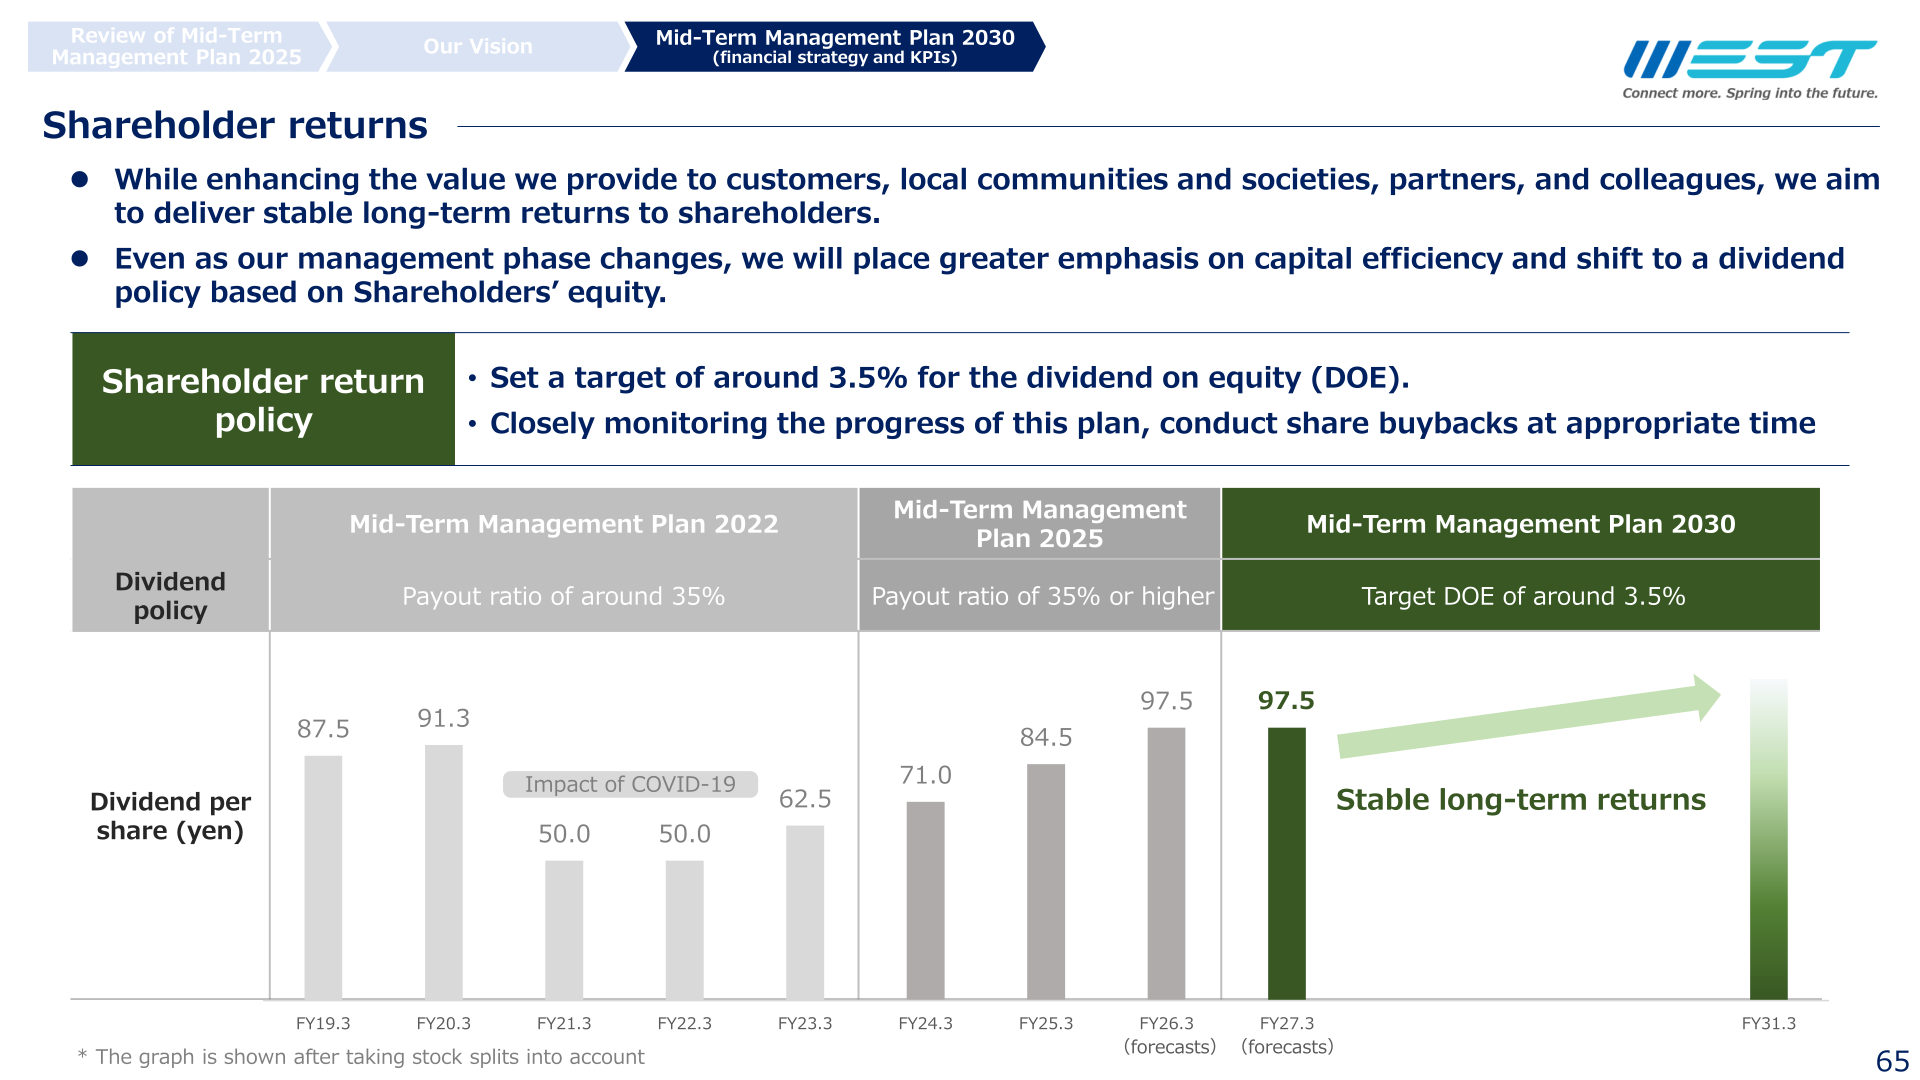
In line with its policy of a payout ratio of 35% or higher, JR West plans to increase the annual dividend per share by ¥13.0 from the previous year to ¥97.5 for FY26.3, and to keep the FY27.3 dividend per share at the same ¥97.5 level. Treasury stock acquisition amounted to ¥49.9 billion in FY26.3, unchanged from FY25.3. Placing greater importance on stable dividends, the company will change its shareholder return policy for the Mid-Term Management Plan 2030 period to a target dividend on equity (DOE) of around 3.5%, while continuing to conduct share buybacks at an appropriate time while monitoring plan progress.
| Item | FY25.3 | FY26.3 | FY27.3 |
|---|---|---|---|
| Dividend per share (¥) | 84.5 | 97.5 (planned) | 97.5 (planned) |
| Treasury stock acquisition (¥ Billions) | 49.9 | 49.9 | – |
Medium-Term Plan / Topics
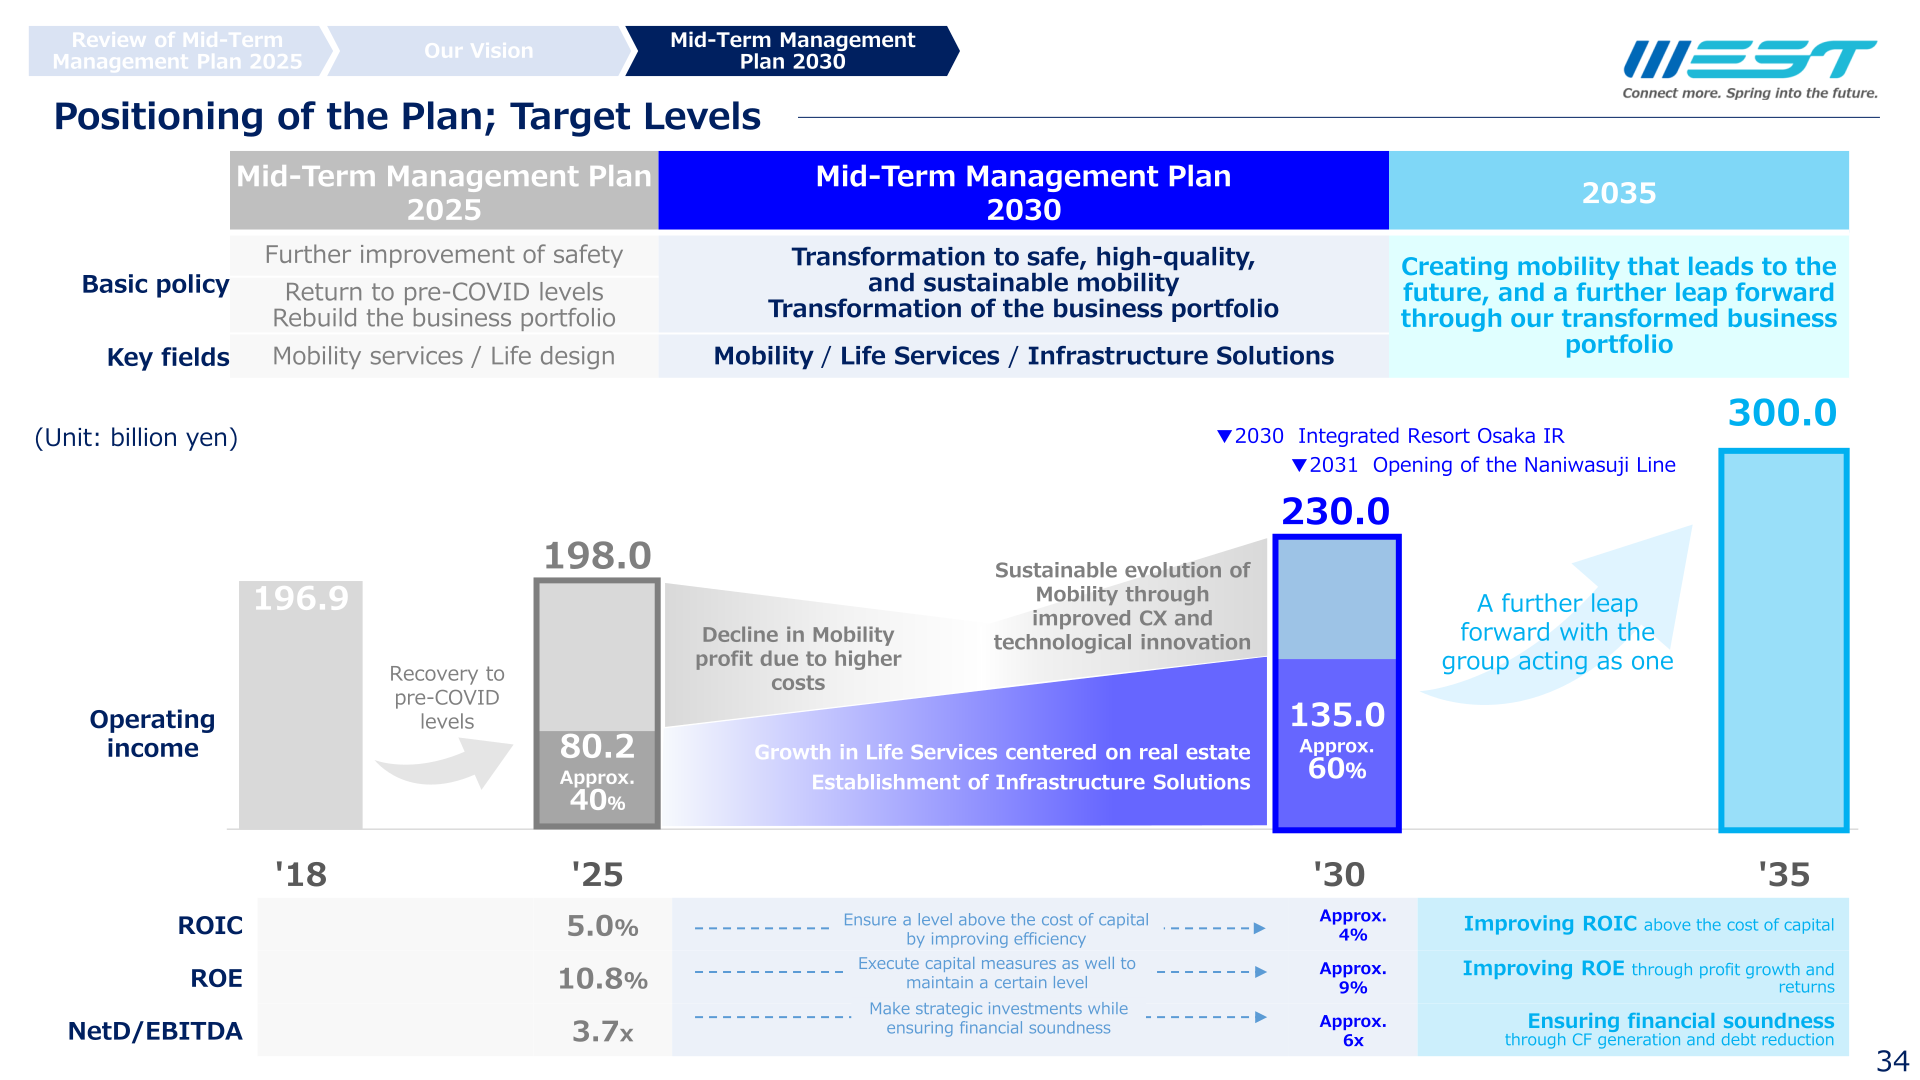
Alongside the FY26.3 results, JR West announced Mid-Term Management Plan 2030, covering the five years from FY27.3. The plan targets consolidated operating income of ¥230.0 billion for FY31.3, the final year of the plan, rising further to ¥300.0 billion by FY2035 (versus ¥198.0 billion in FY26.3). The company set three key business fields — Mobility, Life Services, and Infrastructure Solutions — targeting an operating income mix of approximately 40% Mobility and approximately 60% Life Services/Infrastructure Solutions by FY2030. By FY31.3, operating income in the Life Services and Infrastructure Solutions fields is targeted at ¥135.0 billion, or about 60% of the consolidated total. Financial KPI targets for FY2030 include ROIC of approximately 4%, ROE of approximately 9%, and net interest-bearing debt/EBITDA of approximately 6x. To fund the transformation, JR West plans strategic investment on the largest scale in its history, a five-year plan of ¥2.6 trillion, covering safety investment, rolling stock renewal, and growth investment.
This article is an analysis based on publicly available information and is not a recommendation to buy or sell any specific securities. Investment decisions are your own responsibility.
![[Obayashi] Investors’ Guide 2026 — The Complete 24-Article Breakdown](https://japan-equity.com/wp-content/uploads/2026/07/hub_cover-1024x1024.png)
![[Obayashi] IR & SR Policy — Feeding Dialogue Back into Management](https://japan-equity.com/wp-content/uploads/2026/07/p32_sq-1024x1024.jpg)
![[Obayashi] Real Estate Development — 18.7% Margin, ¥287.7bn Unrealized Gains](https://japan-equity.com/wp-content/uploads/2026/07/p20_sq-1024x1024.jpg)
![[Obayashi] Domestic Civil Engineering — Resilience Spending Supports 9.6% Margin](https://japan-equity.com/wp-content/uploads/2026/07/p11_sq-1024x1024.jpg)
![[Obayashi] Share Price & External Ratings — vs TOPIX, ESG Index Inclusion](https://japan-equity.com/wp-content/uploads/2026/07/p40_sq-1024x1024.jpg)
![[Construction] ¥75.5tn Investment, Shrinking Workforce — Big-5 Market Share](https://japan-equity.com/wp-content/uploads/2026/07/p12_sq-1024x1024.jpg)



![[Obayashi] Capital Policy & Shareholder Returns — ROE 10%+, DOE ~5%, ¥100bn Buyback](https://japan-equity.com/wp-content/uploads/2026/07/p27_sq-1024x1024.jpg)
![[Obayashi] Reducing Cross-Shareholdings — ¥285.2bn Sold in Five Years](https://japan-equity.com/wp-content/uploads/2026/07/p29_sq-1024x1024.jpg)
![[Obayashi] ¥750bn Investment Plan — ¥300bn to Development, ¥190bn to Tech/DX](https://japan-equity.com/wp-content/uploads/2026/07/p30_sq-1024x1024.jpg)
![[Obayashi] MTP2022 KPIs — Operating Profit ~2x Target, ROE 14.4%](https://japan-equity.com/wp-content/uploads/2026/07/p25_sq-1024x1024.jpg)
![[Obayashi] Cash Allocation — ¥420bn Investment CF Over Five Years](https://japan-equity.com/wp-content/uploads/2026/07/p26_sq-1024x1024.jpg)
![[Obayashi] Green Energy — 44 Plants, 344MW, and the Green Hydrogen Challenge](https://japan-equity.com/wp-content/uploads/2026/07/p21_sq-1024x1024.jpg)
![[Obayashi] Tackling the Labor Shortage — Robotics Construction®](https://japan-equity.com/wp-content/uploads/2026/07/p14_sq-1024x1024.jpg)
