
This article is based on publicly available IR materials and is not a recommendation to buy or sell any specific securities.
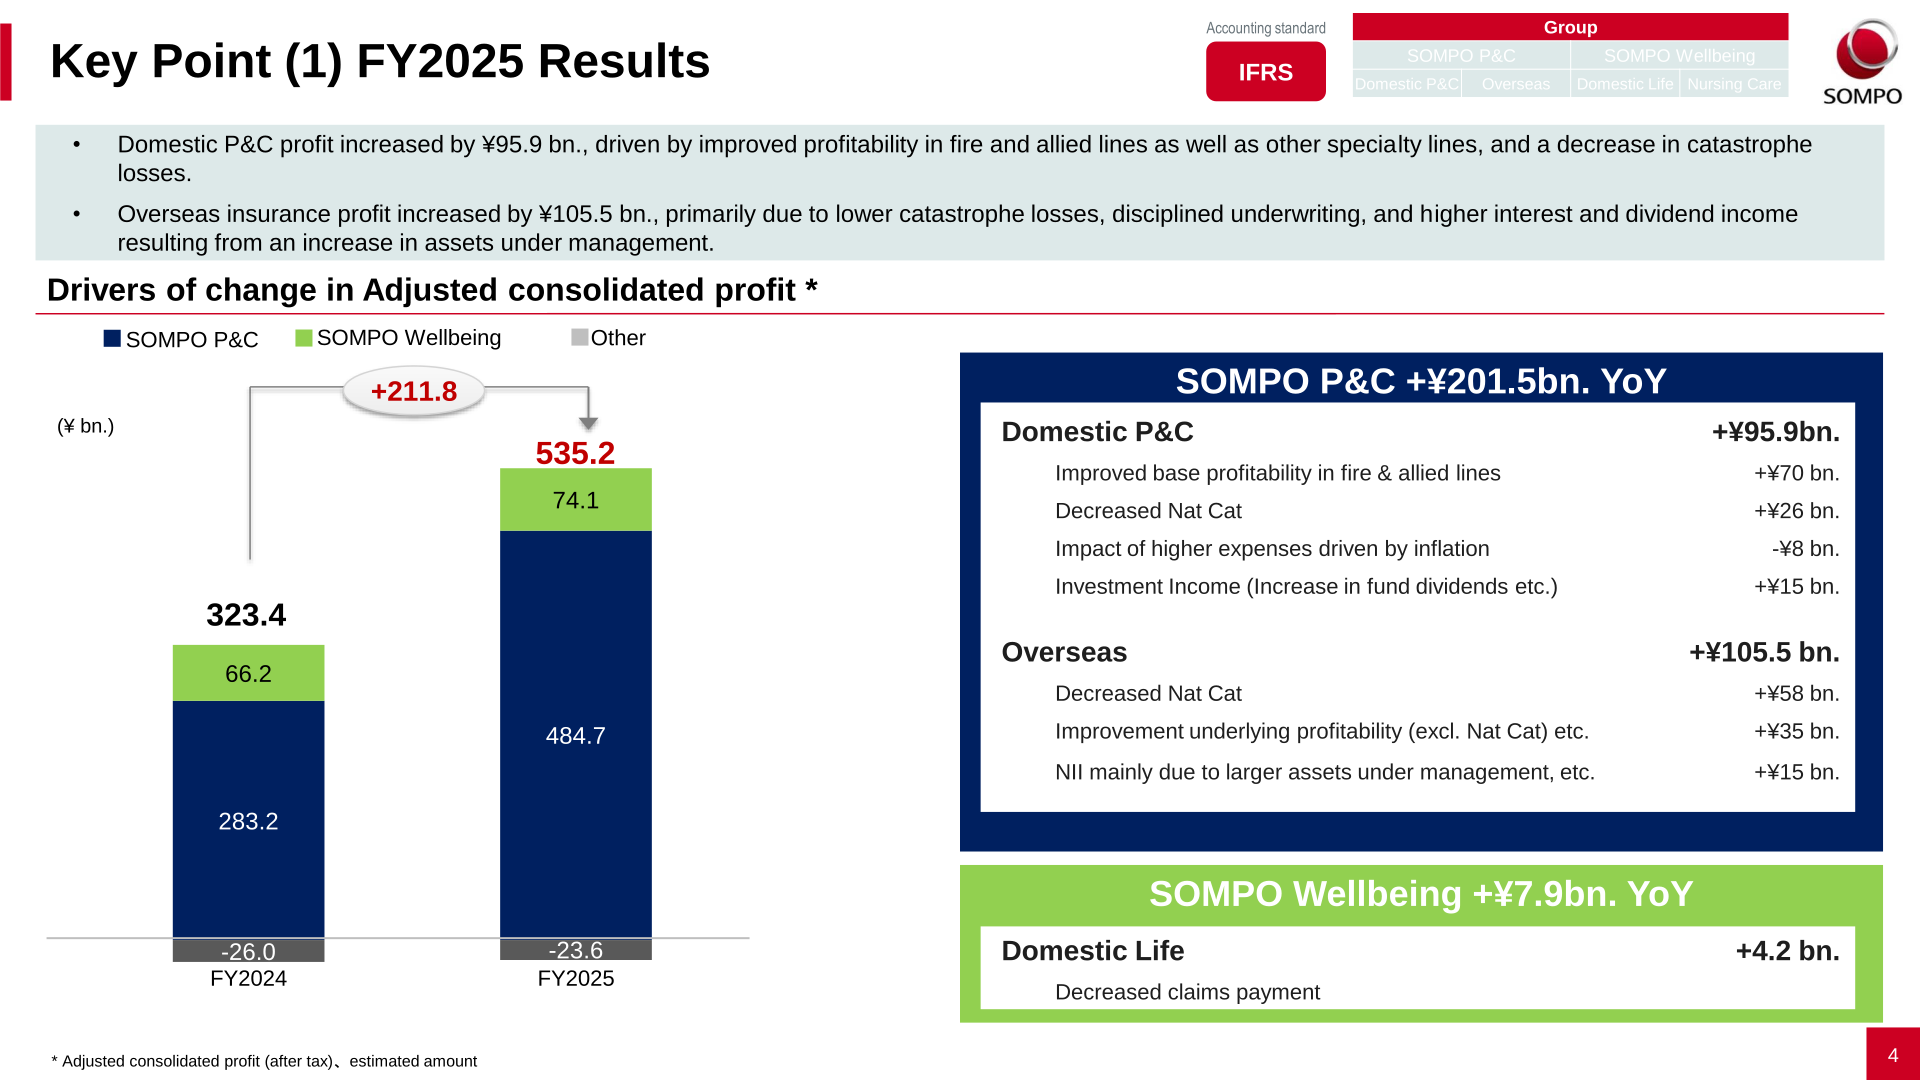
Sompo Holdings reported record results for FY2025 (fiscal year ended March 2026). Adjusted consolidated profit rose ¥211.8 bn. year-on-year to a record ¥535.2 bn., outperforming the initial forecast by ¥172.2 bn., with earnings expanding across all businesses driven by improved profitability at SOMPO P&C. Consolidated net income also reached a record ¥640.0 bn., up ¥396.9 bn. YoY. For FY2026, the company forecasts adjusted consolidated profit of ¥500.0 bn. (up ¥62.4 bn. on a normalized basis), supported by further improvement in domestic P&C profitability and the consolidation of Aspen.
Consolidated Results (Full-Year Actual)
Adjusted consolidated profit for FY2025 reached a record ¥535.2 bn., up ¥211.8 bn. YoY, driven by improved profitability in the domestic P&C business and a decline in natural catastrophe losses both domestically and overseas. Consolidated net income also reached a record ¥640.0 bn., up ¥396.9 bn. YoY. Insurance revenue for FY2025 was ¥5,372.9 bn., up ¥307.4 bn. YoY.
| Item (¥ bn.) | FY2025 | FY2024 | Change |
|---|---|---|---|
| Insurance revenue | 5,372.9 | 5,065.5 | +307.4 |
| Adjusted consolidated profit | 535.2 | 323.4 | +211.8 |
| Consolidated net income | 640.0 | 243.1 | +396.9 |
Segment Results
SOMPO P&C’s adjusted profit increased ¥201.5 bn. YoY to ¥484.7 bn. Domestic P&C profit rose ¥95.9 bn. to ¥219.4 bn., driven by improved profitability in fire and allied lines (+¥70 bn.) and a decrease in natural catastrophe losses (+¥26 bn.), partly offset by higher expenses from inflation (-¥8 bn.). Overseas insurance profit rose ¥105.5 bn. to ¥265.3 bn., driven by lower catastrophe losses (+¥58 bn.), improved underlying profitability excluding natural catastrophes (+¥35 bn.), and higher interest and dividend income from a larger asset base (+¥15 bn.). SOMPO Wellbeing’s adjusted profit increased ¥7.9 bn. to ¥74.1 bn., with Domestic Life up ¥4.2 bn. to ¥61.3 bn. on decreased claims payments, and Nursing Care, etc. up ¥3.6 bn. to ¥12.8 bn.
| Segment | Metric | FY2025 | FY2024 |
|---|---|---|---|
| SOMPO P&C (Domestic P&C + Overseas) | Adjusted profit (¥ bn.) | 484.7 | 283.2 |
| – Domestic P&C | Adjusted profit (¥ bn.) | 219.4 | 123.5 |
| – Overseas | Adjusted profit (¥ bn.) | 265.3 | 159.7 |
| SOMPO Wellbeing (Domestic Life + Nursing Care) | Adjusted profit (¥ bn.) | 74.1 | 66.2 |
| – Domestic Life | Adjusted profit (¥ bn.) | 61.3 | 57.0 |
| – Nursing Care, etc. | Adjusted profit (¥ bn.) | 12.8 | 9.2 |
| Others | Adjusted profit (¥ bn.) | -23.6 | -26.0 |
| Group Total | Adjusted consolidated profit (¥ bn.) | 535.2 | 323.4 |
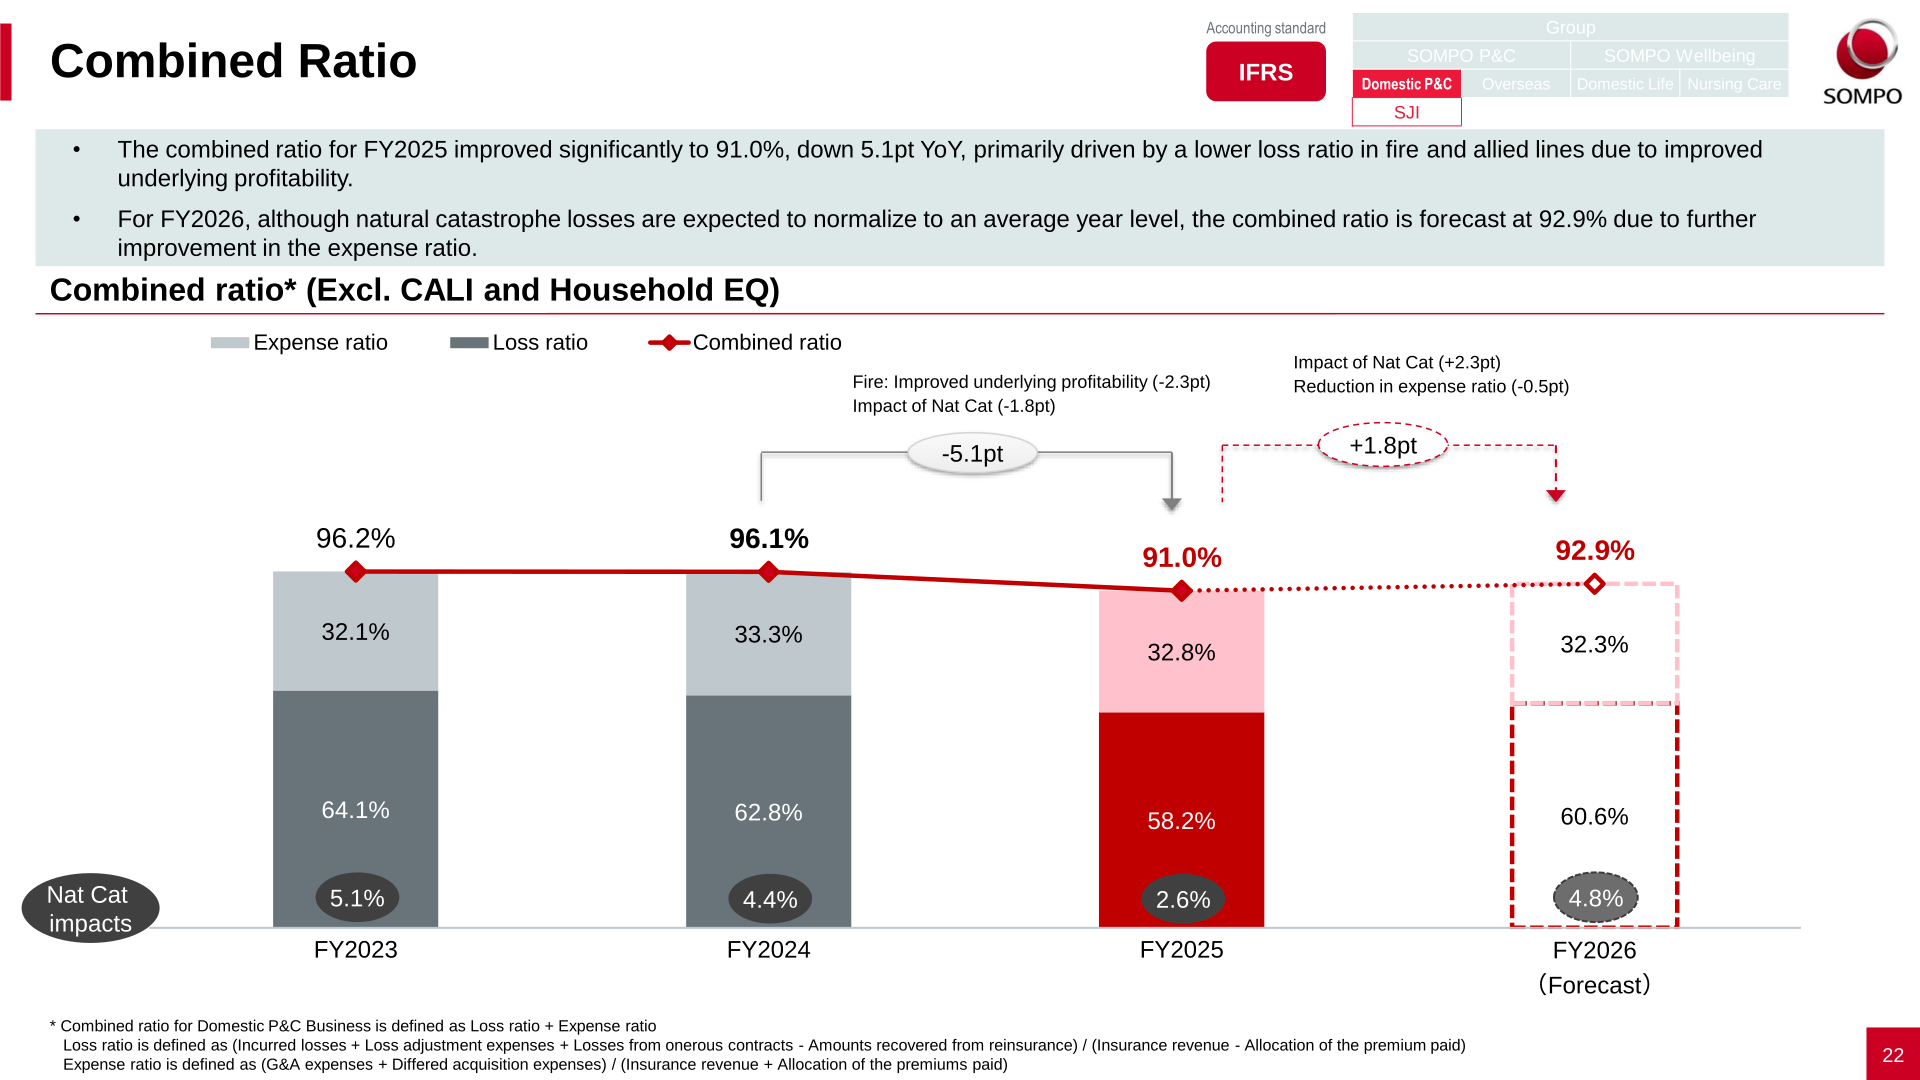
At Sompo Japan, insurance revenue for FY2025 rose ¥96.8 bn. YoY to ¥2,187.7 bn. (excl. CALI and household earthquake), driven by product revisions in auto and fire insurance and sales expansion in allied lines. The combined ratio improved 5.1pt to 91.0%, reflecting a 4.6pt improvement in the loss ratio to 58.2% (lower fire and allied losses and reduced natural catastrophe impact) and a 0.5pt improvement in the expense ratio to 32.8%. Adjusted profit for Sompo Japan rose ¥94.4 bn. to ¥217.3 bn. For FY2026, insurance revenue is forecast to grow to ¥2,277.0 bn., the combined ratio is expected to normalize to 92.9% as natural catastrophe losses return to an average-year level, and adjusted profit is forecast at ¥178.6 bn.
| Item | FY2024 | FY2025 | FY2026 Forecast |
|---|---|---|---|
| Loss ratio (excl. CALI, Household EQ) | 62.8% | 58.2% | 60.6% |
| Expense ratio (excl. CALI, Household EQ) | 33.3% | 32.8% | 32.3% |
| Combined ratio (excl. CALI, Household EQ) | 96.1% | 91.0% | 92.9% |
| Insurance service result (¥ bn.) | 81.2 | 195.8 | 162.7 |
| Adjusted profit for Sompo Japan (¥ bn.) | 122.9 | 217.3 | 178.6 |
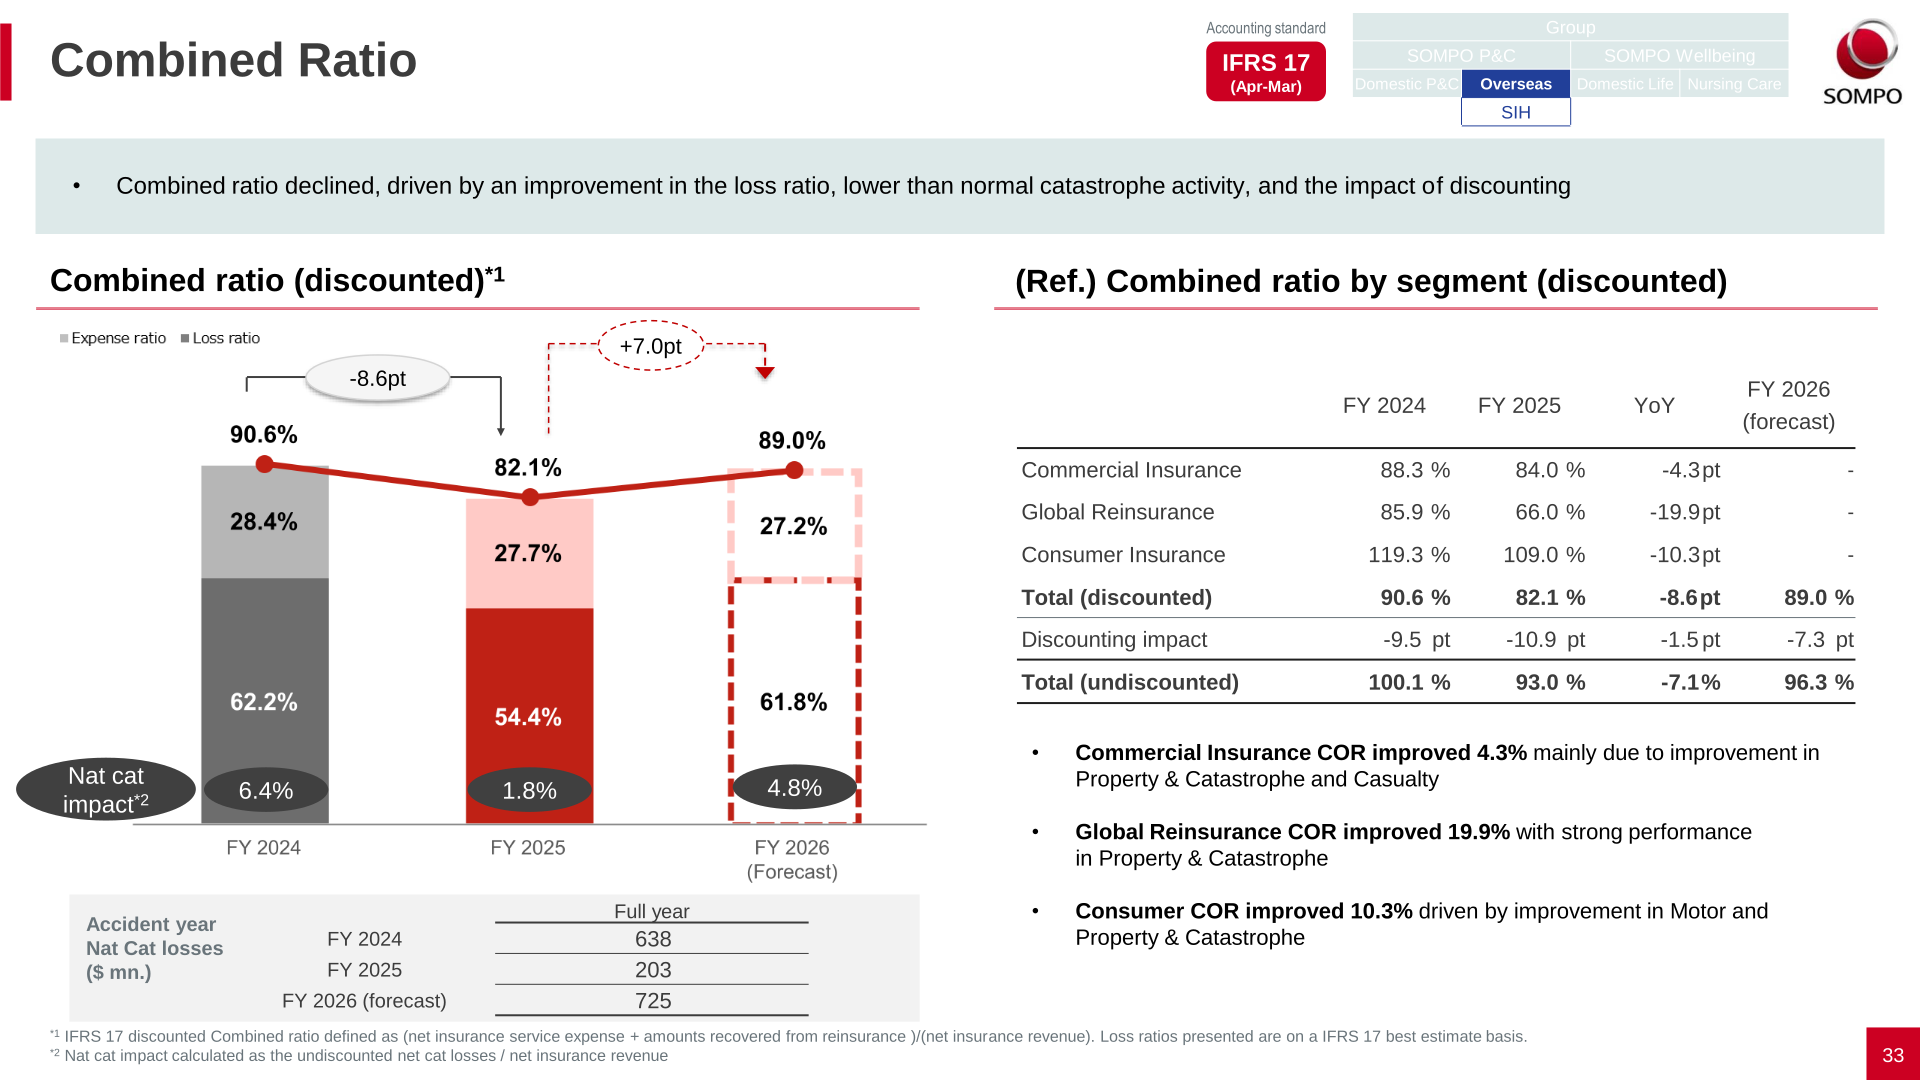
At the overseas insurance/reinsurance business (Sompo International Holdings, SIH), insurance revenue grew 10.8% YoY to $16,089 mn., led by 9.2% growth in Commercial Insurance, 8.8% growth in Global Reinsurance, and 30.8% growth in Consumer Insurance (driven by strong growth in Turkey Motor and Property & Catastrophe). The combined ratio improved 8.6pt to 82.1% on an improved loss ratio and lower-than-normal catastrophe activity, with Commercial Insurance COR improving 4.3pt, Global Reinsurance 19.9pt, and Consumer Insurance 10.3pt. Adjusted profit for SIH rose $709 mn. YoY to $1,737 mn. For FY2026, insurance revenue is forecast to grow 31% (6% ex-Aspen) to $21,064 mn., the combined ratio is forecast at 89.0%, and adjusted profit for SIH is forecast flat at $1,737 mn., reflecting the full-year contribution from the Aspen acquisition, which closed in February 2026.
| Item ($ mn.) | FY2024 | FY2025 | FY2026 Forecast |
|---|---|---|---|
| Insurance revenue | 14,527 | 16,089 | 21,064 |
| Combined ratio (discounted) | 90.6% | 82.1% | 89.0% |
| Net income (SIH) | 1,119 | 1,930 | 1,803 |
| Adjusted profit (SIH) | 1,028 | 1,737 | 1,737 |
FY2026 Forecast
For FY2026, Sompo Holdings forecasts adjusted consolidated profit of ¥500.0 bn. (up ¥62.4 bn. from the FY2025 normalized basis of ¥437.5 bn., a record high on a normalized basis) and consolidated net income of ¥490.0 bn. Domestic P&C business profit is forecast to increase ¥15.1 bn. YoY on a normalized basis to ¥180.0 bn., driven by improvement in the underlying profitability of automobile insurance (+¥15 bn.) and fire insurance (+¥12 bn.) and a decrease in expected large losses (+¥4 bn.), partly offset by expense increases from inflation (-¥11 bn.). Overseas insurance business profit is forecast to increase ¥57.7 bn. to ¥280.0 bn., primarily due to the full-year earnings contribution from the consolidation of Aspen (+¥45 bn.) and improvement in underlying profitability (+¥9 bn.).
| Item | Forecast | FY2025 (Actual) |
|---|---|---|
| Insurance revenue (¥ bn.) | 6,410.0 | 5,372.9 |
| Adjusted consolidated profit (¥ bn.) | 500.0 | 535.2 |
| Consolidated net income (¥ bn.) | 490.0 | 640.0 |
| Domestic P&C adjusted profit (¥ bn.) | 180.0 | 219.4 |
| Overseas adjusted profit (¥ bn.) | 280.0 | 265.3 |
Shareholder Returns
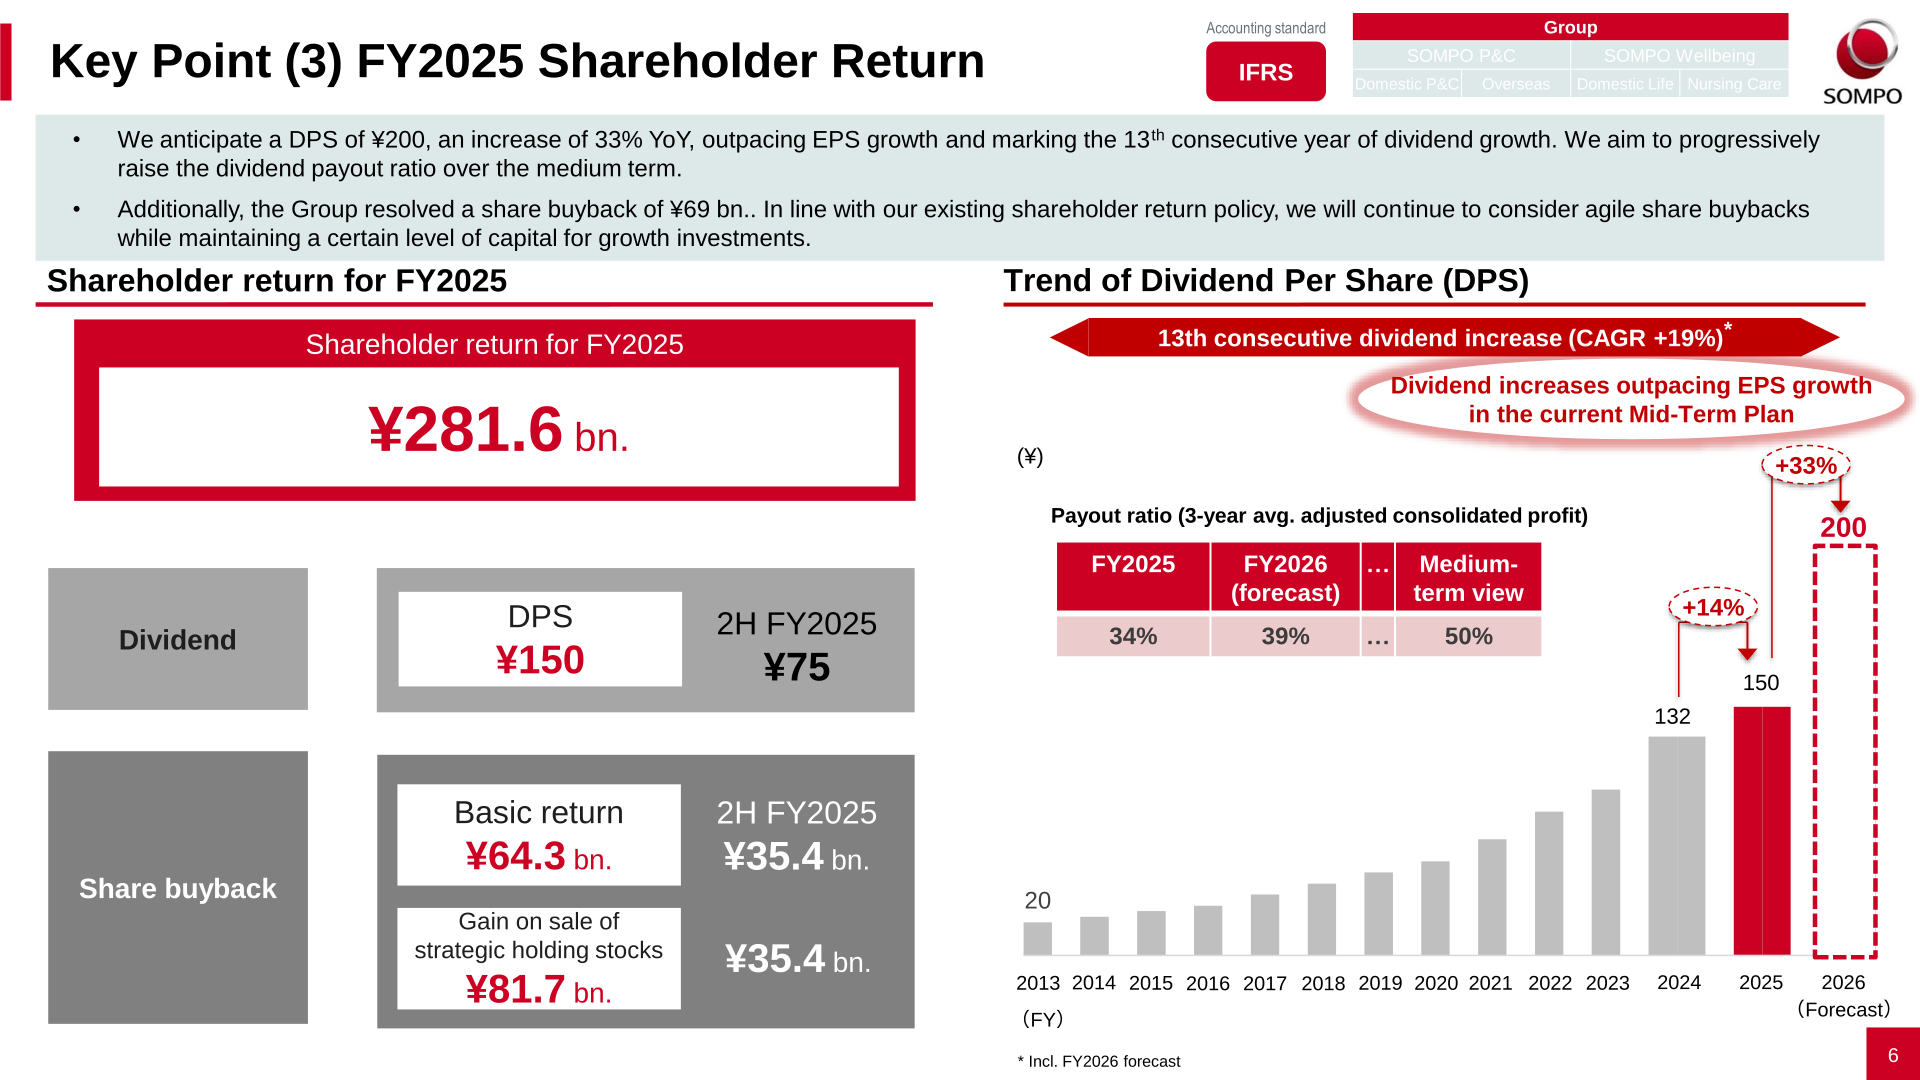
Total shareholder return for FY2025 was ¥281.6 bn., consisting of ¥135.6 bn. in dividends and ¥146.0 bn. in share buybacks (¥64.3 bn. as a basic return and ¥81.7 bn. funded by gains on sale of strategic holding stocks). The FY2025 dividend per share (DPS) was ¥150, including a second-half DPS of ¥75. For FY2026, the company anticipates a DPS of ¥200, an increase of 33% YoY, outpacing EPS growth and marking the 13th consecutive year of dividend growth; the company aims to progressively raise the dividend payout ratio over the medium term. The Group also resolved an additional share buyback of ¥69.0 bn., and, in line with its shareholder return policy, will continue to consider agile share buybacks while maintaining a certain level of capital for growth investments.
| Item | FY2025 | FY2026 (Forecast) |
|---|---|---|
| DPS (¥) | 150 | 200 |
| Total shareholder return (¥ bn.) | 281.6 | – |
| – Dividends (¥ bn.) | 135.6 | – |
| – Share buybacks (¥ bn.) | 146.0 | – |
Medium-Term Plan / Topics
Sompo completed the acquisition of Aspen in February 2026, with post-merger integration (PMI) progressing on track and growth being accelerated through overseas synergies. The impact of Aspen consolidation for FY2026 is expected to contribute an additional ¥45.0 bn. to adjusted profit, a $4.6 bn. increase in gross written premium (GWP, FY2025 actual, USGAAP Jan.-Dec. basis), and $60 mn. in FY2026 synergies. The Group also continued to reduce strategic shareholdings, cutting ¥292.4 bn. in FY2025, exceeding the plan; for FY2026, it targets reductions of more than ¥250.0 bn., exceeding the initial plan of ¥200.0 bn. formulated at the start of the Mid-Term Management Plan. The Group’s Economic Solvency Ratio (ESR, 99.5% VaR) rose to 270% at the end of March 2026 from 256% a year earlier, above the newly established target capital level of 200% or above required to maintain financial soundness and credit ratings. Adjusted consolidated ROE was 13.4% in FY2025, up from 9.2% in FY2024, against a medium-term target of 13-15% (the FY2026 plan is 13.1%, adjusted to reflect the financial market assumptions used when formulating the Mid-Term Management Plan).
This article is an analysis based on publicly available information and is not a recommendation to buy or sell any specific securities. Investment decisions are your own responsibility.
![[Obayashi] Investors’ Guide 2026 — The Complete 24-Article Breakdown](https://japan-equity.com/wp-content/uploads/2026/07/hub_cover-1024x1024.png)
![[Obayashi] IR & SR Policy — Feeding Dialogue Back into Management](https://japan-equity.com/wp-content/uploads/2026/07/p32_sq-1024x1024.jpg)
![[Obayashi] Real Estate Development — 18.7% Margin, ¥287.7bn Unrealized Gains](https://japan-equity.com/wp-content/uploads/2026/07/p20_sq-1024x1024.jpg)
![[Obayashi] Domestic Civil Engineering — Resilience Spending Supports 9.6% Margin](https://japan-equity.com/wp-content/uploads/2026/07/p11_sq-1024x1024.jpg)
![[Obayashi] Share Price & External Ratings — vs TOPIX, ESG Index Inclusion](https://japan-equity.com/wp-content/uploads/2026/07/p40_sq-1024x1024.jpg)
![[Construction] ¥75.5tn Investment, Shrinking Workforce — Big-5 Market Share](https://japan-equity.com/wp-content/uploads/2026/07/p12_sq-1024x1024.jpg)



![[Obayashi] Capital Policy & Shareholder Returns — ROE 10%+, DOE ~5%, ¥100bn Buyback](https://japan-equity.com/wp-content/uploads/2026/07/p27_sq-1024x1024.jpg)
![[Obayashi] Reducing Cross-Shareholdings — ¥285.2bn Sold in Five Years](https://japan-equity.com/wp-content/uploads/2026/07/p29_sq-1024x1024.jpg)
![[Obayashi] ¥750bn Investment Plan — ¥300bn to Development, ¥190bn to Tech/DX](https://japan-equity.com/wp-content/uploads/2026/07/p30_sq-1024x1024.jpg)
![[Obayashi] MTP2022 KPIs — Operating Profit ~2x Target, ROE 14.4%](https://japan-equity.com/wp-content/uploads/2026/07/p25_sq-1024x1024.jpg)
![[Obayashi] Cash Allocation — ¥420bn Investment CF Over Five Years](https://japan-equity.com/wp-content/uploads/2026/07/p26_sq-1024x1024.jpg)
![[Obayashi] Green Energy — 44 Plants, 344MW, and the Green Hydrogen Challenge](https://japan-equity.com/wp-content/uploads/2026/07/p21_sq-1024x1024.jpg)
![[Obayashi] Tackling the Labor Shortage — Robotics Construction®](https://japan-equity.com/wp-content/uploads/2026/07/p14_sq-1024x1024.jpg)
