
This article is based on publicly available IR materials and is not a recommendation to buy or sell any specific securities.
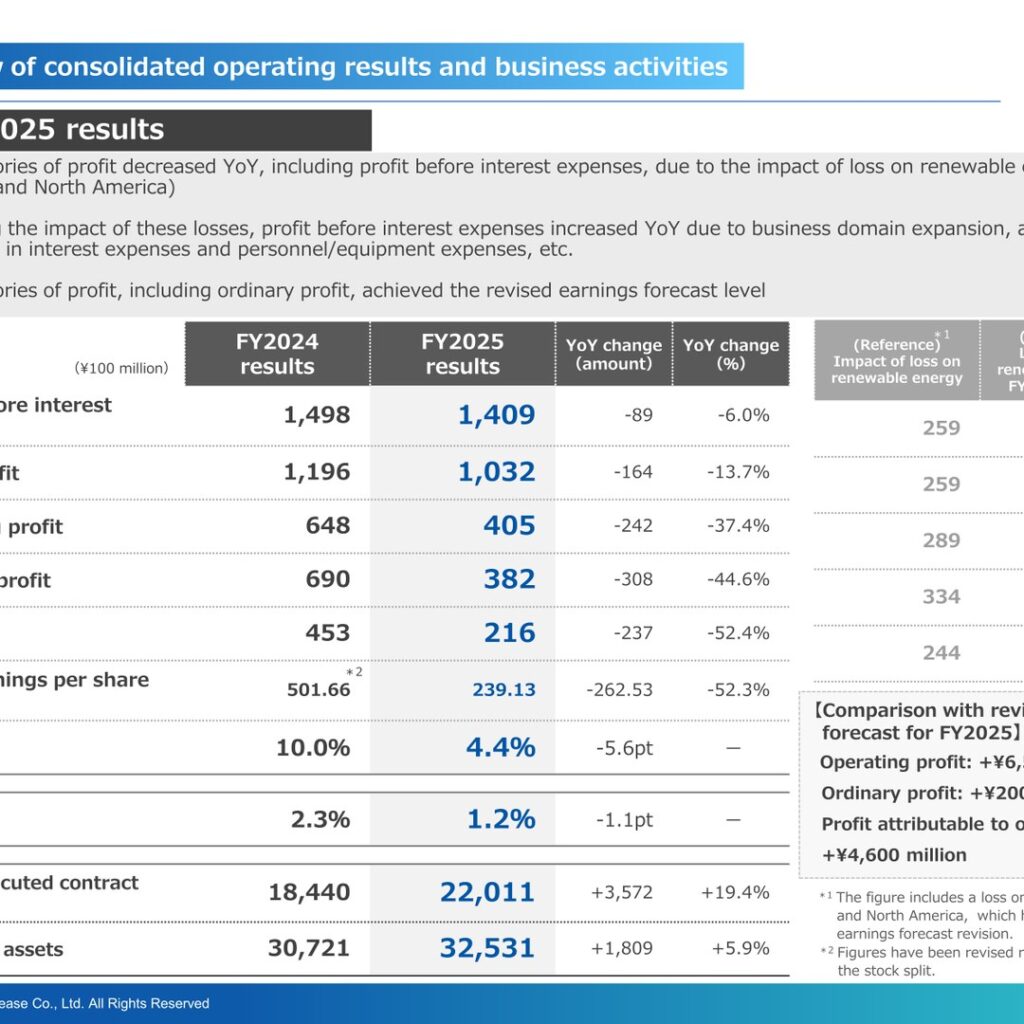
Fuyo General Lease Co., Ltd. released its “Financial Results Briefing for FY2025 IR Presentation” on May 13, 2026. All categories of profit decreased year on year, including profit before interest expenses, due to the impact of loss on renewable energy overseas (Europe and North America). Ordinary profit fell to 382 (¥100 million) from 690, and profit attributable to owners of parent fell to 216 from 453. At the same time, newly executed contract volume rose 19.4% to 22,011 and operating assets grew 5.9% to 32,531, and the company states that all categories of profit, including ordinary profit, achieved the revised earnings forecast level.
Consolidated Results (Full-Year Actual)
Profit before interest expenses was 1,409 (¥100 million), down 89 or 6.0% year on year, and gross profit was 1,032, down 164 or 13.7%. Operating profit was 405 (-37.4%), ordinary profit 382 (-44.6%) and profit 216 (-52.4%). Basic earnings per share was ¥239.13 against ¥501.66 in FY2024, with FY2024 figures revised retrospectively to reflect the stock split. ROE fell 5.6pt to 4.4% and ROA fell 1.1pt to 1.2%.
| Item (¥100 million unless otherwise noted) | FY2024 results | FY2025 results | YoY change (amount) | YoY change (%) |
|---|---|---|---|---|
| Profit before interest expenses | 1,498 | 1,409 | -89 | -6.0% |
| Gross profit | 1,196 | 1,032 | -164 | -13.7% |
| Operating profit | 648 | 405 | -242 | -37.4% |
| Ordinary profit | 690 | 382 | -308 | -44.6% |
| Profit | 453 | 216 | -237 | -52.4% |
| Basic earnings per share (¥) | 501.66 | 239.13 | -262.53 | -52.3% |
| ROE | 10.0% | 4.4% | -5.6pt | ー |
| ROA | 2.3% | 1.2% | -1.1pt | ー |
| Newly executed contract volume | 18,440 | 22,011 | +3,572 | +19.4% |
| Operating assets | 30,721 | 32,531 | +1,809 | +5.9% |
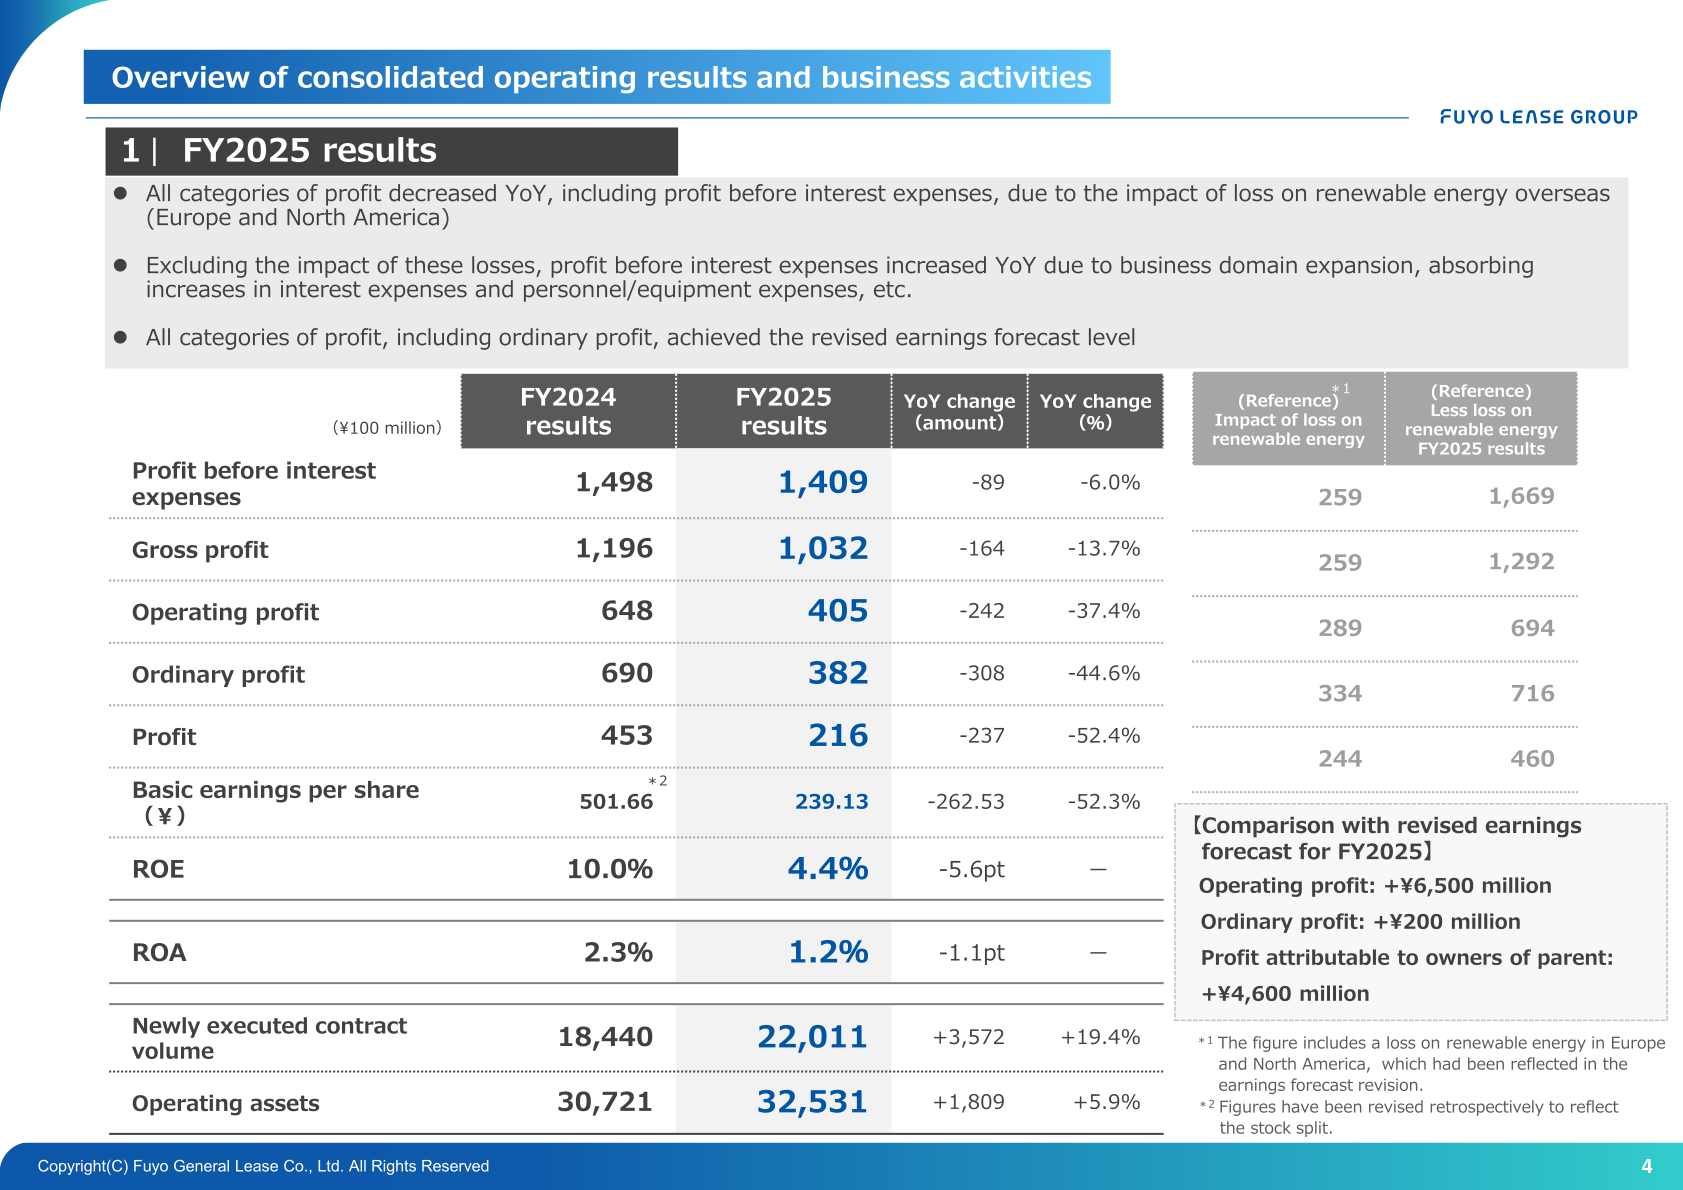
The presentation also shows reference figures excluding the loss on renewable energy in Europe and North America, which had been reflected in the earnings forecast revision. On that basis, profit before interest expenses was 1,669, gross profit 1,292, operating profit 694, ordinary profit 716 and profit 460, with the impact of the loss stated as 259, 259, 289, 334 and 244 respectively. Against the revised earnings forecast for FY2025, the company reports operating profit of +¥6,500 million, ordinary profit of +¥200 million and profit attributable to owners of parent of +¥4,600 million.
On the cost side, personnel/equipment expenses rose to 615 (¥100 million) from 542, and the overhead ratio (personnel/equipment expenses divided by gross profit) rose to 59.6% from 45.3%. Funding costs increased to 377 from 302, and credit-related costs were ▲1, unchanged from FY2024. Net assets increased to 5,683 from 5,312, while the shareholders’ equity ratio was 13.1% against 13.3%.
Business Domain Results
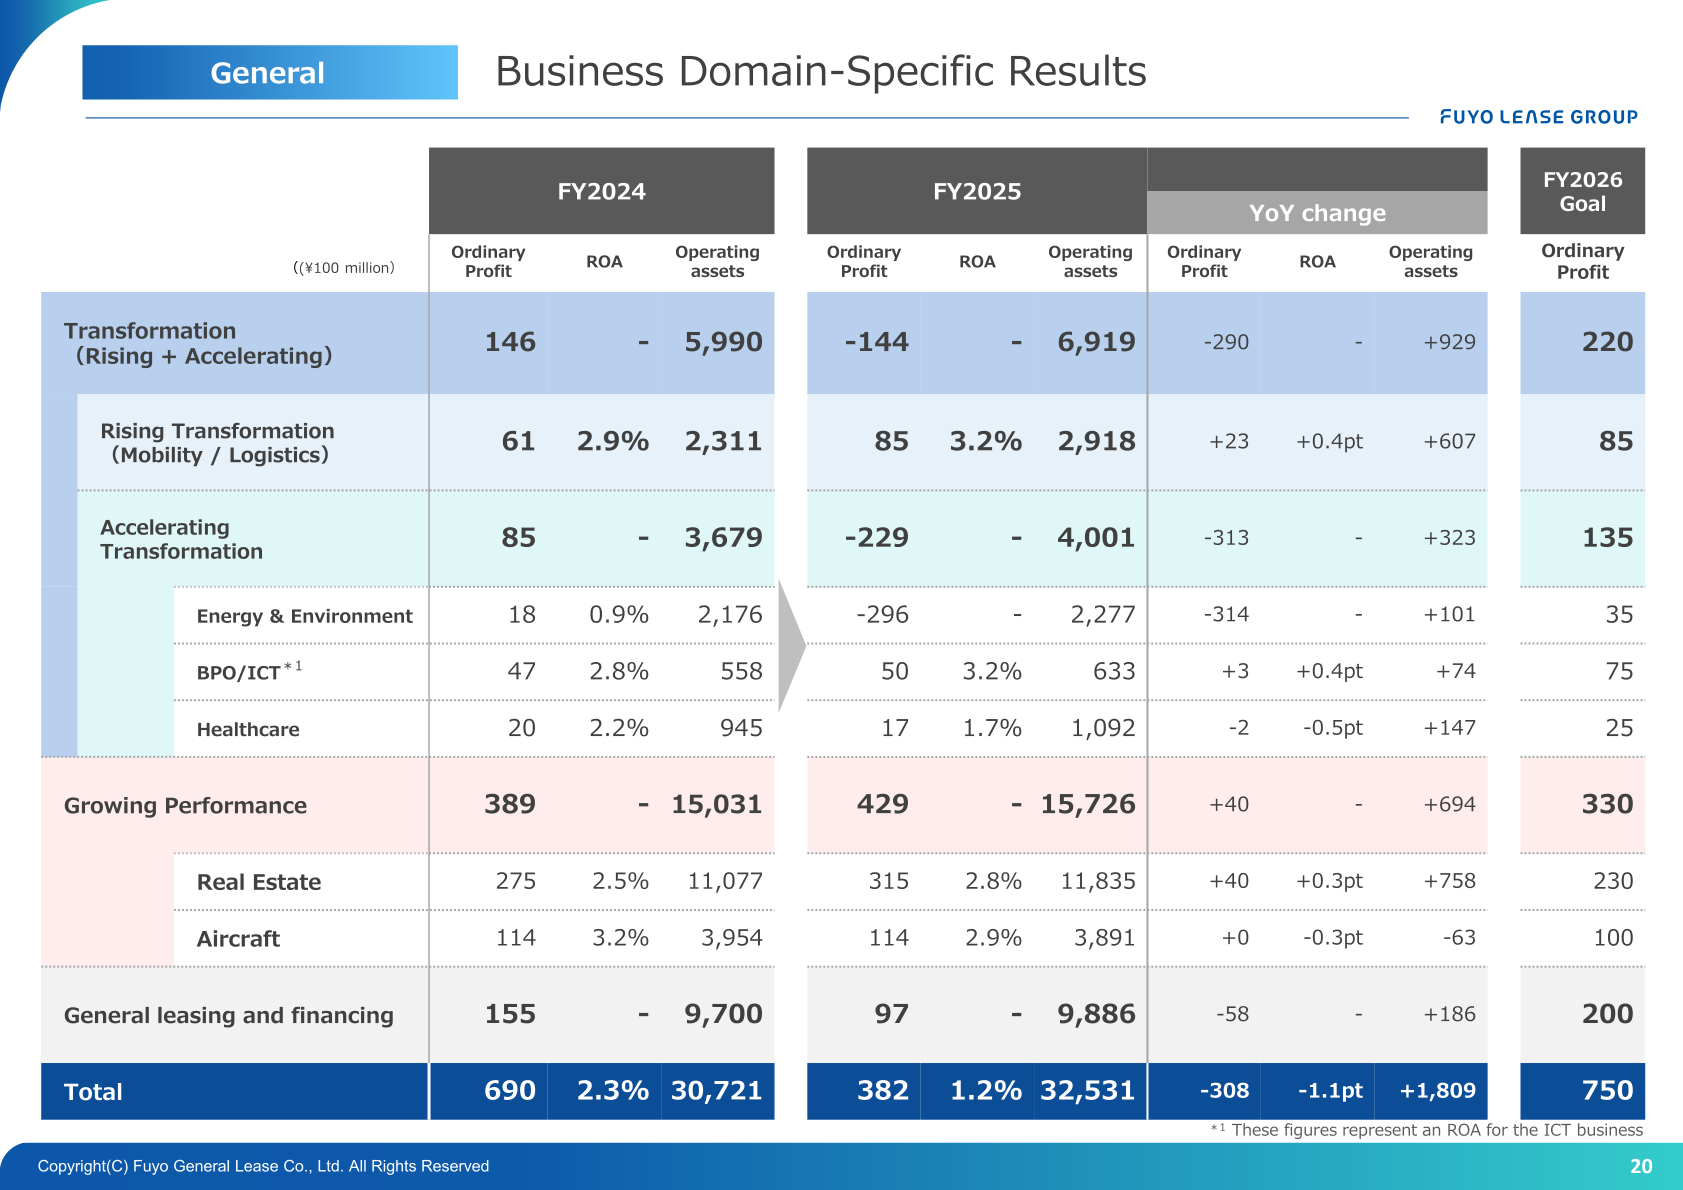
In the Transformation Zone, ordinary profit was -144 (¥100 million) against 146 in FY2024, reflecting Energy & Environment at -296. Rising Transformation (Mobility / Logistics) improved to 85 from 61, BPO/ICT rose to 50 from 47, and Healthcare was 17 against 20. Growing Performance rose to 429 from 389, with Real Estate at 315 and Aircraft at 114. General leasing and financing was 97 against 155. Operating assets grew across most domains, with the total up 1,809 to 32,531.
| Business domain (¥100 million) | FY2024 ordinary profit | FY2025 ordinary profit | FY2025 ROA | FY2025 operating assets | FY2026 Goal (ordinary profit) |
|---|---|---|---|---|---|
| Transformation (Rising + Accelerating) | 146 | -144 | – | 6,919 | 220 |
| Rising Transformation (Mobility / Logistics) | 61 | 85 | 3.2% | 2,918 | 85 |
| Accelerating Transformation | 85 | -229 | – | 4,001 | 135 |
| Energy & Environment | 18 | -296 | – | 2,277 | 35 |
| BPO/ICT | 47 | 50 | 3.2% | 633 | 75 |
| Healthcare | 20 | 17 | 1.7% | 1,092 | 25 |
| Growing Performance | 389 | 429 | – | 15,726 | 330 |
| Real Estate | 275 | 315 | 2.8% | 11,835 | 230 |
| Aircraft | 114 | 114 | 2.9% | 3,891 | 100 |
| General leasing and financing | 155 | 97 | – | 9,886 | 200 |
| Total | 690 | 382 | 1.2% | 32,531 | 750 |
Newly Executed Contract Volume and Operating Assets
Newly executed contract volume totalled 22,011 (¥100 million), up 3,572 or 19.4% year on year. The company notes that in leases, alongside the execution of large-scale real estate projects, mobility also grew, primarily driven by EVs, and that there were significant increases in Accretive’s factoring for medical and nursing care fees. Operating assets reached 32,531, up 1,809 or 5.9%, with asset turnover progressing in real estate and aircraft while assets continued to accumulate in mobility, and credit investments increasing alongside growth in the real estate domain within financing.
| Item (¥100 million) | FY2024 new contracts | FY2025 new contracts | FY2024 operating assets | FY2025 operating assets |
|---|---|---|---|---|
| Leases | 4,982 | 5,383 | 18,761 | 19,023 |
| Finance leases | (2,877) | (2,833) | (8,515) | (8,714) |
| Operating lease | (2,106) | (2,550) | (10,246) | (10,308) |
| Installment sales | 298 | 329 | 536 | 562 |
| Financing, Other | 13,159 | 16,300 | 11,425 | 12,946 |
| Accretive | (6,518) | (8,131) | ー | ー |
| Total | 18,440 | 22,011 | 30,721 | 32,531 |
FY2026 Forecast
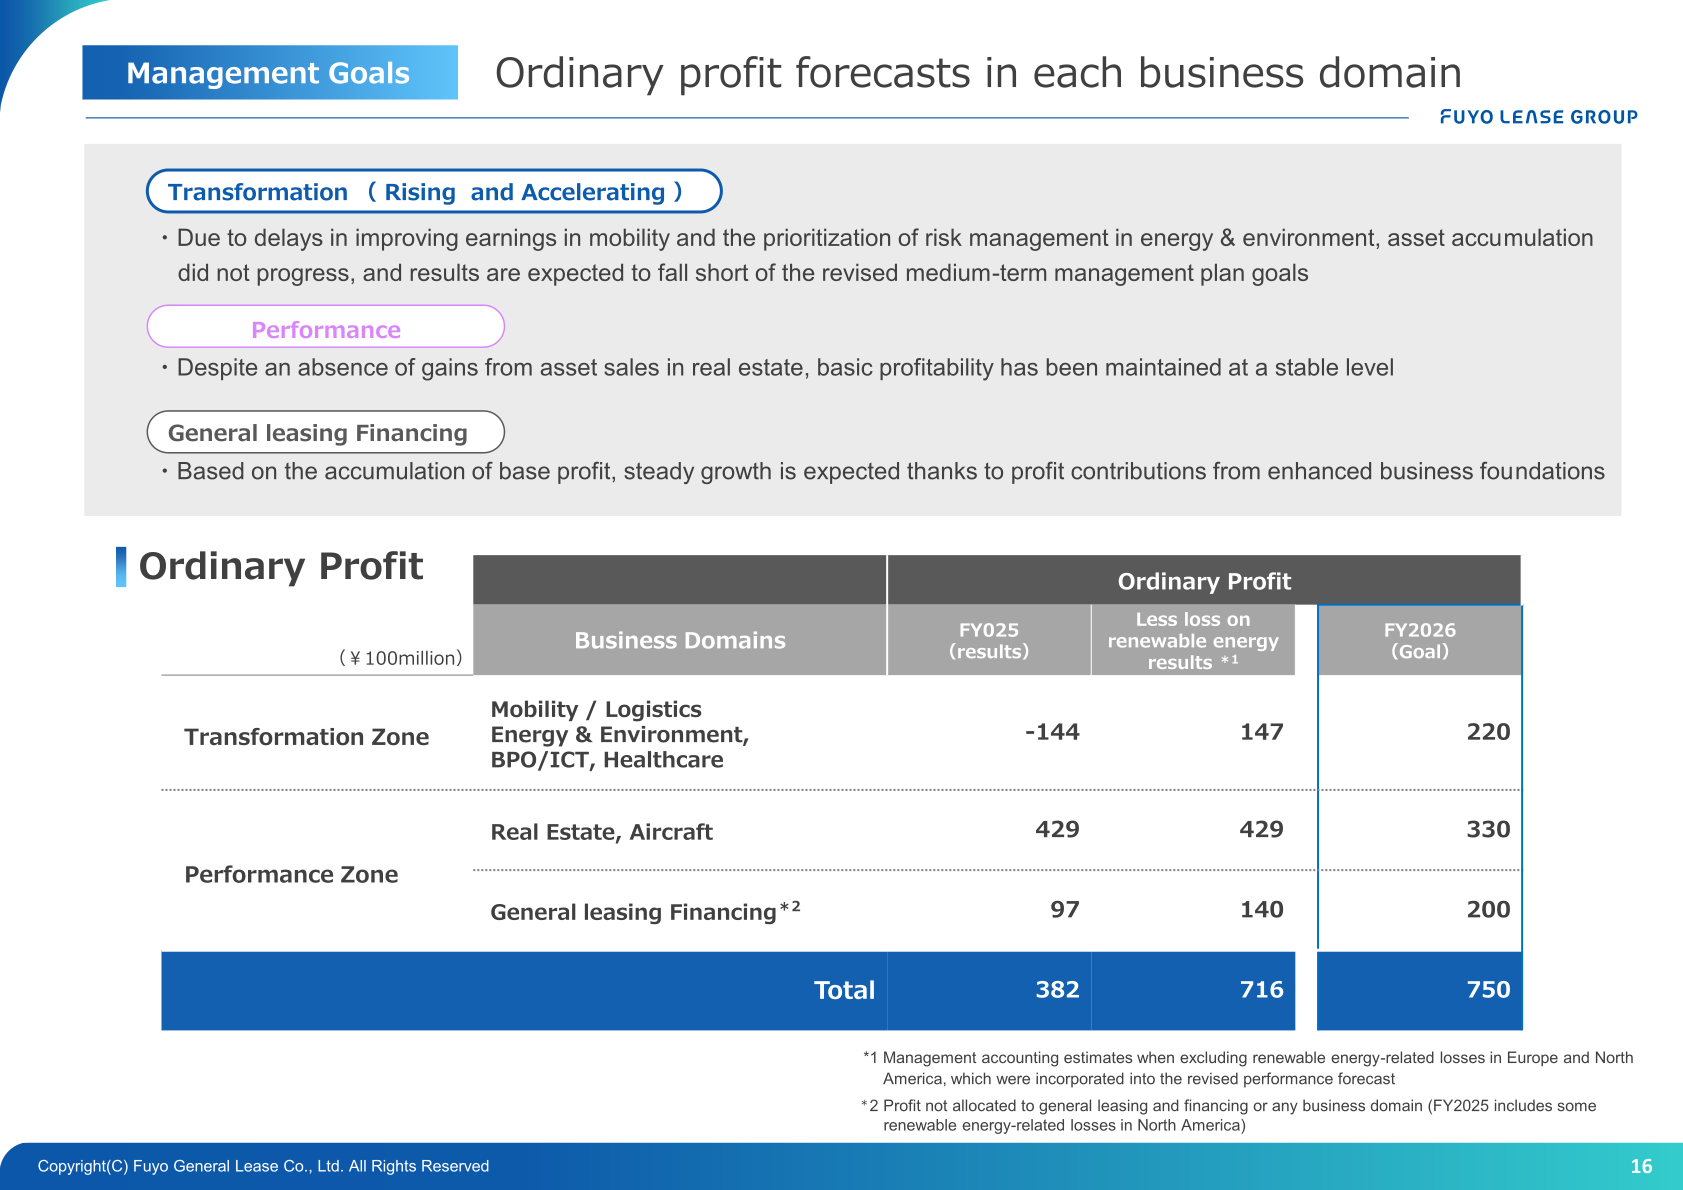
For FY2026 the company forecasts operating profit of 700 (¥100 million), ordinary profit of 750, profit attributable to owners of parent of 480 and basic earnings per share of ¥532.14. By business domain, the FY2026 goal for ordinary profit is 220 for the Transformation Zone (Mobility / Logistics, Energy & Environment, BPO/ICT, Healthcare), 330 for the Performance Zone (Real Estate, Aircraft) and 200 for general leasing and financing. The presentation also shows FY2025 results less the loss on renewable energy as management accounting estimates of 147, 429 and 140 for those three groupings, totalling 716.
| Item (¥100 million) | FY2025 Results | FY2026 Forecast |
|---|---|---|
| Operating profit | 405 | 700 |
| Ordinary profit | 382 | 750 |
| Profit attributable to owners of parent | 216 | 480 |
| Basic earnings per share (¥) | 239.13 | 532.14 |
On the outlook for funding, the company states that in FY2026 the impact of market interest rate increases will be reflected over the full year, with funding costs expected to exceed FY2025.
Shareholder Returns
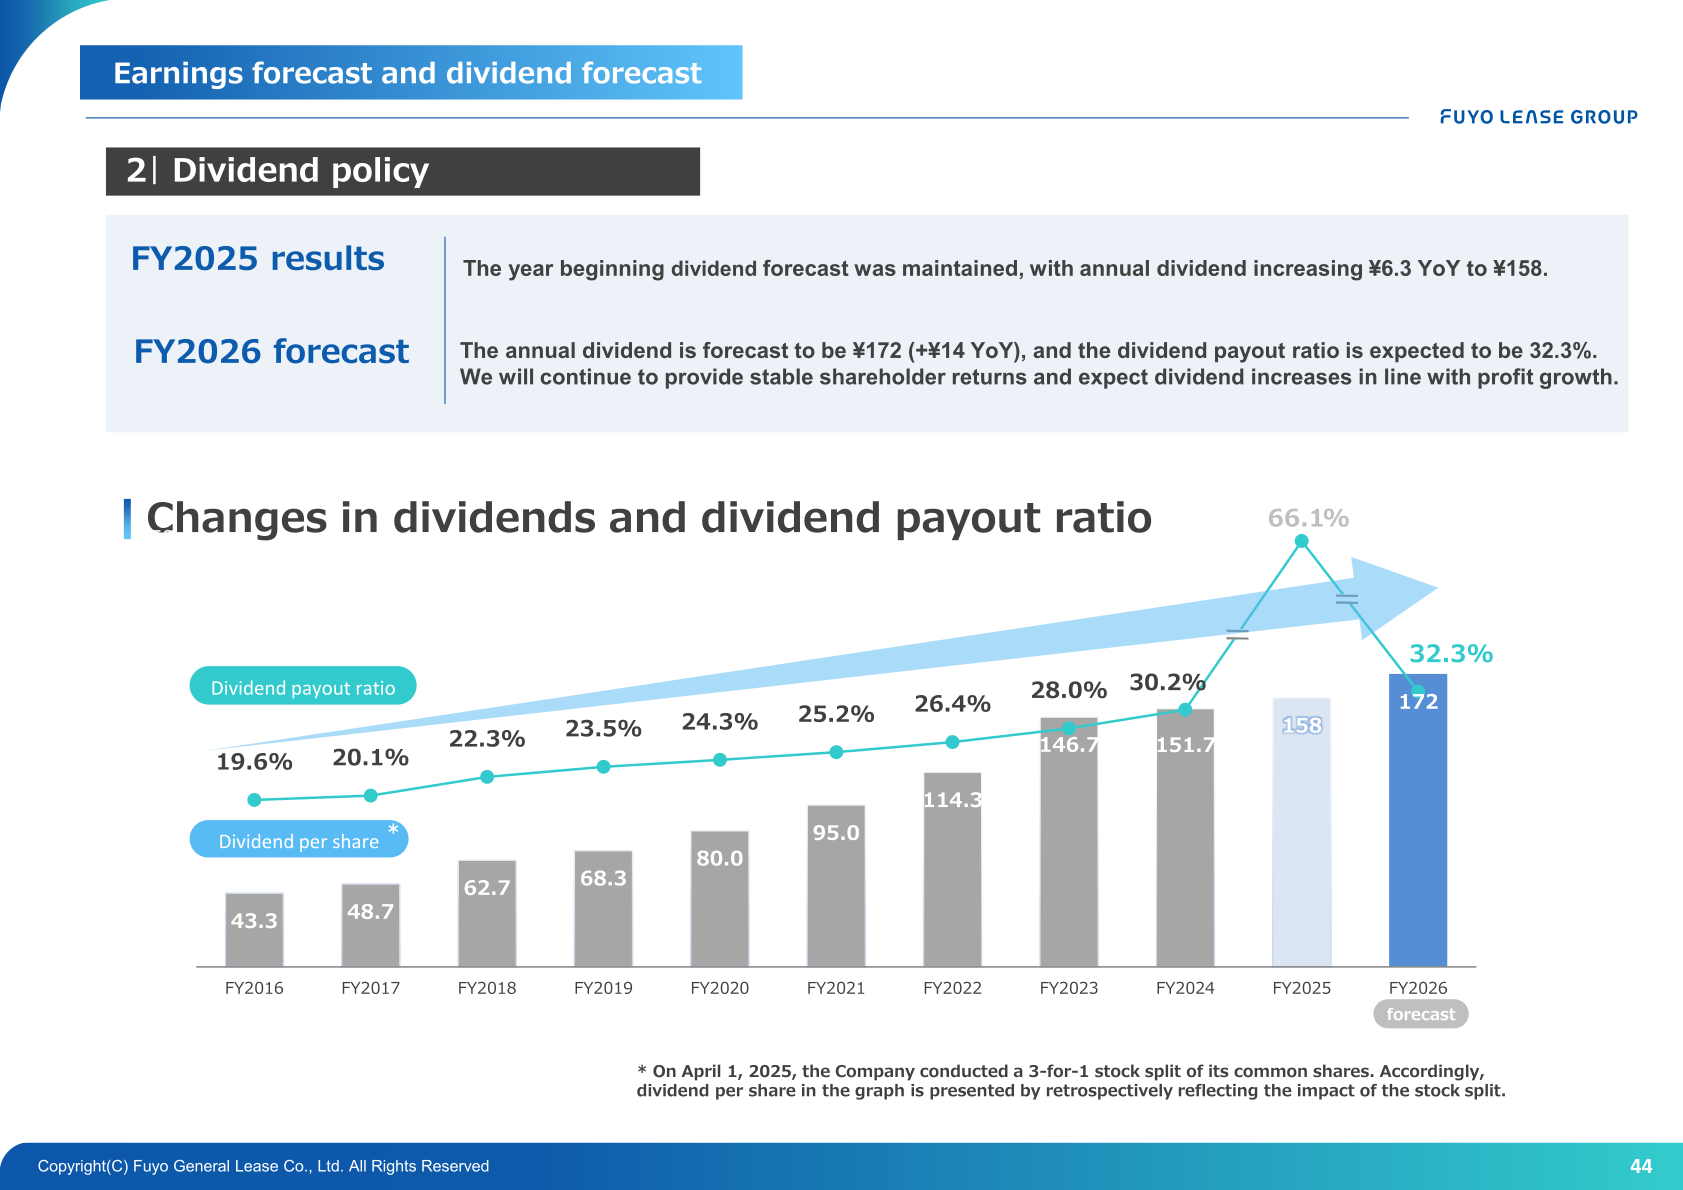
For FY2025, the year beginning dividend forecast was maintained, with the annual dividend increasing ¥6.3 year on year to ¥158; the dividend payout ratio was 66.1%. For FY2026, the annual dividend is forecast to be ¥172 (+¥14 YoY) and the dividend payout ratio is expected to be 32.3%. The company states that it will continue to provide stable shareholder returns and expects dividend increases in line with profit growth. On April 1, 2025, the company conducted a 3-for-1 stock split of its common shares, and dividend per share in the presentation is presented by retrospectively reflecting the impact of the stock split.
| Item | FY2024 | FY2025 | FY2026 forecast |
|---|---|---|---|
| Dividend per share (¥) | 151.7 | 158 | 172 |
| Dividend payout ratio | 30.2% | 66.1% | 32.3% |
Medium-Term Management Plan and Topics
FY2026 is the final year of the medium-term management plan “Fuyo Shared Value 2026”. Against the plan’s financial goals, FY2025 results were ordinary profit of ¥38.2 billion versus a target value of ¥75.0 billion for FY2026; ROA (ratio of ordinary profit to operating assets) of 1.2% versus 2.5%; a shareholders’ equity ratio of 13.1% versus 13% to 15%; and ROE of 4.4% versus 10% or more. On non-financial goals, the company reports steady progress and continued performance at a level exceeding goals for the final year, including contribution to CO2 reduction of 570,000 t-CO2 against a target of 500,000 t-CO2, decarbonization-related investment of ¥361.1 billion against ¥300.0 billion, renewable energy power generation capacity of 1,014MW against 1,000MWdc, and human resource development-related expenses at 310% compared to FY2021 against a target of 300%.
The presentation attributes the shortfall in the Transformation Zone to delays in improving earnings in mobility and the prioritization of risk management in energy & environment, which meant asset accumulation did not progress. In response, the company newly established a Risk Management Division for stronger company-wide risk management, and an Energy Business Management Division for stronger management and monitoring of the energy & environment business portfolio.
As an inorganic strategy, the company concluded a basic agreement on March 30, 2026 to acquire 40% of the outstanding shares (excluding treasury shares) of Sumitomo Mitsui Trust Panasonic Finance from Sumitomo Mitsui Trust Bank, after which Sumitomo Mitsui Trust Panasonic Finance is expected to become an equity-method affiliate and a joint venture between Fuyo General Lease, Sumitomo Mitsui Trust Bank and Yokohama Financial Group. Conclusion of the final contract is planned for July 2026 and the date of execution is planned for October 1, 2026.
This article is an analysis based on publicly available information and is not a recommendation to buy or sell any specific securities. Investment decisions are your own responsibility.
![[Obayashi] Investors’ Guide 2026 — The Complete 24-Article Breakdown](https://japan-equity.com/wp-content/uploads/2026/07/hub_cover-1024x1024.png)
![[Obayashi] IR & SR Policy — Feeding Dialogue Back into Management](https://japan-equity.com/wp-content/uploads/2026/07/p32_sq-1024x1024.jpg)
![[Obayashi] Real Estate Development — 18.7% Margin, ¥287.7bn Unrealized Gains](https://japan-equity.com/wp-content/uploads/2026/07/p20_sq-1024x1024.jpg)
![[Obayashi] Domestic Civil Engineering — Resilience Spending Supports 9.6% Margin](https://japan-equity.com/wp-content/uploads/2026/07/p11_sq-1024x1024.jpg)
![[Obayashi] Share Price & External Ratings — vs TOPIX, ESG Index Inclusion](https://japan-equity.com/wp-content/uploads/2026/07/p40_sq-1024x1024.jpg)
![[Construction] ¥75.5tn Investment, Shrinking Workforce — Big-5 Market Share](https://japan-equity.com/wp-content/uploads/2026/07/p12_sq-1024x1024.jpg)



![[Obayashi] Capital Policy & Shareholder Returns — ROE 10%+, DOE ~5%, ¥100bn Buyback](https://japan-equity.com/wp-content/uploads/2026/07/p27_sq-1024x1024.jpg)
![[Obayashi] Reducing Cross-Shareholdings — ¥285.2bn Sold in Five Years](https://japan-equity.com/wp-content/uploads/2026/07/p29_sq-1024x1024.jpg)
![[Obayashi] ¥750bn Investment Plan — ¥300bn to Development, ¥190bn to Tech/DX](https://japan-equity.com/wp-content/uploads/2026/07/p30_sq-1024x1024.jpg)
![[Obayashi] MTP2022 KPIs — Operating Profit ~2x Target, ROE 14.4%](https://japan-equity.com/wp-content/uploads/2026/07/p25_sq-1024x1024.jpg)
![[Obayashi] Cash Allocation — ¥420bn Investment CF Over Five Years](https://japan-equity.com/wp-content/uploads/2026/07/p26_sq-1024x1024.jpg)
![[Obayashi] Green Energy — 44 Plants, 344MW, and the Green Hydrogen Challenge](https://japan-equity.com/wp-content/uploads/2026/07/p21_sq-1024x1024.jpg)
![[Obayashi] Tackling the Labor Shortage — Robotics Construction®](https://japan-equity.com/wp-content/uploads/2026/07/p14_sq-1024x1024.jpg)
