
This article is based on publicly available IR materials and is not a recommendation to buy or sell any specific securities.
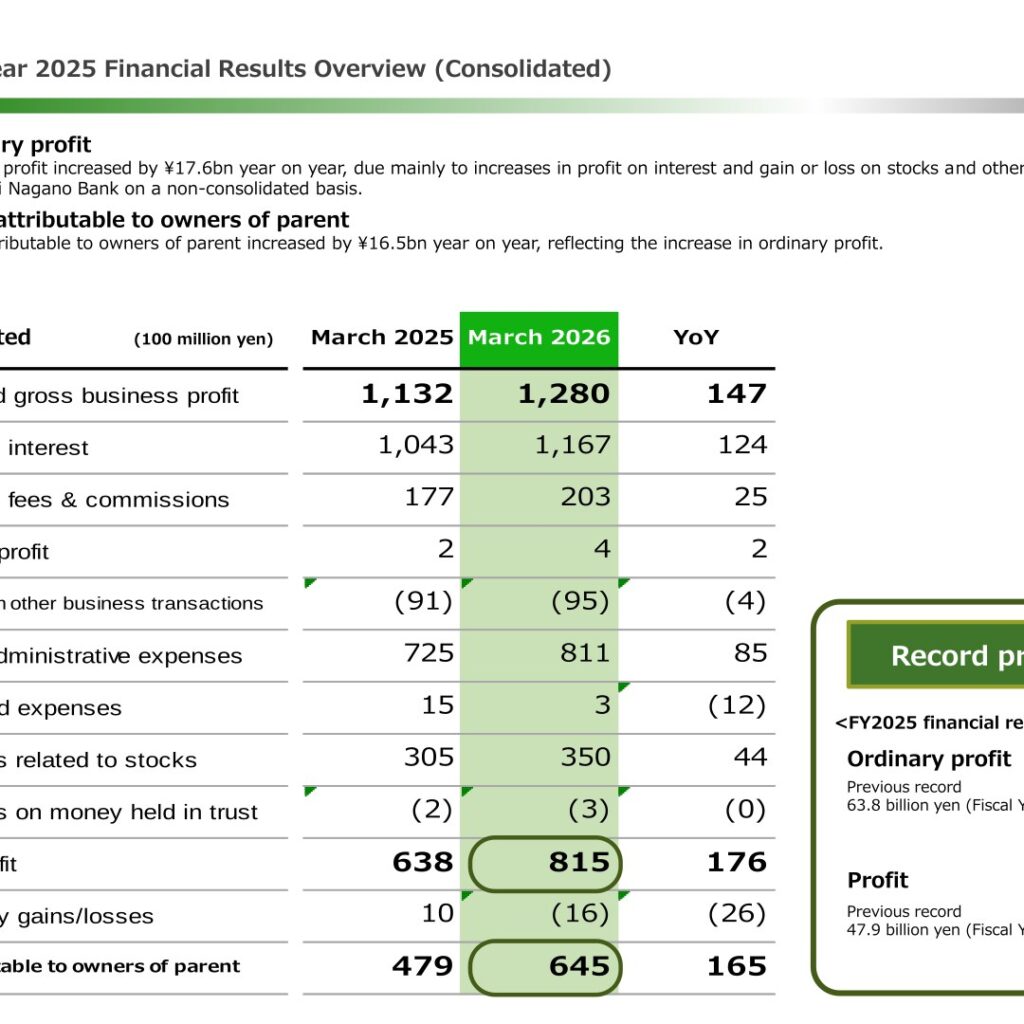
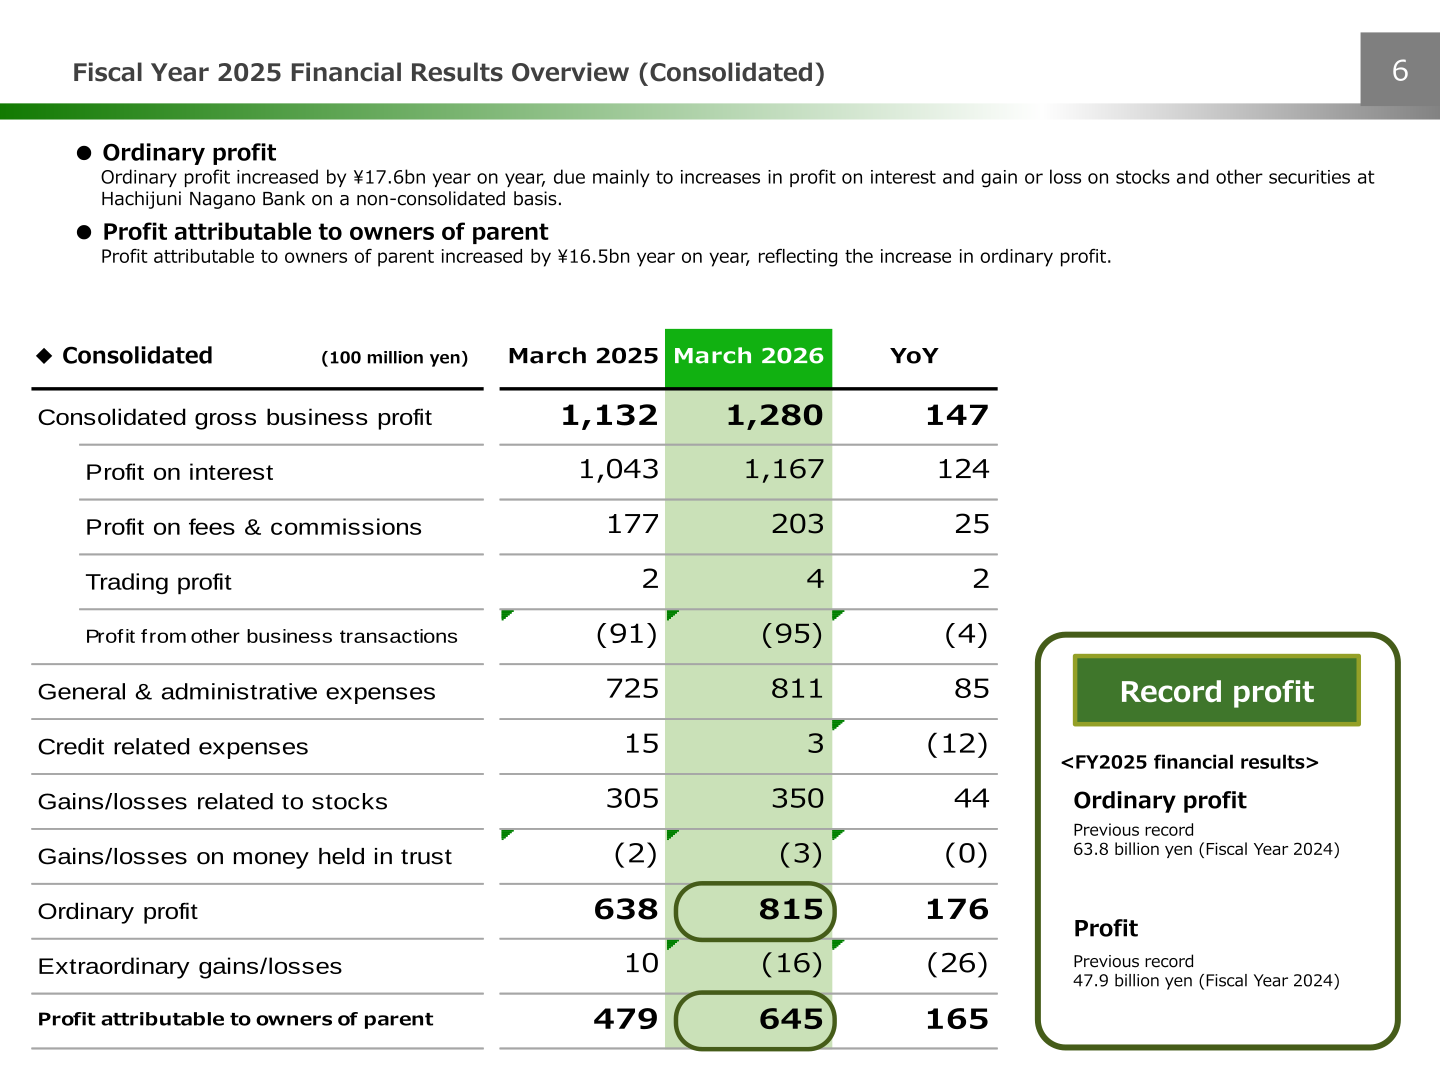
Hachijuni Nagano Bank reported record results for Fiscal Year 2025, the fiscal year ended March 31, 2026. On a consolidated basis, ordinary profit increased by ¥17.6bn year on year and profit attributable to owners of parent increased by ¥16.5bn, both surpassing the previous records of 63.8 billion yen and 47.9 billion yen set in Fiscal Year 2024. The Bank was established on January 1, 2026 through the merger of The Hachijuni Bank and The Nagano Bank, and The Nagano Bank’s final fiscal year was the shortened period from April 1 to December 31, 2025.
Consolidated Results (Full-Year Actual)
The materials state that ordinary profit increased by ¥17.6bn year on year, due mainly to increases in profit on interest and gain or loss on stocks and other securities at Hachijuni Nagano Bank on a non-consolidated basis, and that profit attributable to owners of parent increased by ¥16.5bn year on year, reflecting the increase in ordinary profit.
| Consolidated (100 million yen) | March 2025 | March 2026 | YoY |
|---|---|---|---|
| Consolidated gross business profit | 1,132 | 1,280 | 147 |
| Profit on interest | 1,043 | 1,167 | 124 |
| Profit on fees & commissions | 177 | 203 | 25 |
| Trading profit | 2 | 4 | 2 |
| Profit from other business transactions | (91) | (95) | (4) |
| General & administrative expenses | 725 | 811 | 85 |
| Credit related expenses | 15 | 3 | (12) |
| Gains/losses related to stocks | 305 | 350 | 44 |
| Gains/losses on money held in trust | (2) | (3) | (0) |
| Ordinary profit | 638 | 815 | 176 |
| Extraordinary gains/losses | 10 | (16) | (26) |
| Profit attributable to owners of parent | 479 | 645 | 165 |
Non-Consolidated Results (Hachijuni Nagano Bank)
On a non-consolidated basis, profit on interest increased by ¥15.6bn year on year, due to increases in interest on loans and discounts and interest and dividends on securities in the domestic business division. Core net business profit recorded a +7.7 billion yen change from the previous period as the increases in profit on interest and profit on fees and commissions outweighed higher general & administrative expenses. Ordinary profit increased by 15.8 billion yen compared to the previous period, due primarily to the increase in core net business profit on bonds and gain on sale of equity securities, and profit increased by 20.5 billion yen compared to the previous period, reaching 66.5 billion yen. The March 2025 column represents ‘Hachijuni Bank’ standalone. The materials note that the accounting treatment for investment partnerships has been changed since Fiscal Year 2025; as a result, profit on interest decreased by approximately 5.6 billion yen, but since one-time expenses decreased by the same amount, ordinary profit remains unaffected.
| Hachijuni Nagano Bank standalone (100 million yen) | March 2025 | March 2026 | YoY |
|---|---|---|---|
| Gross business profit (A) | 963 | 1,100 | 137 |
| Profit on interest | 958 | 1,114 | 156 |
| Profit on fees & commissions | 104 | 127 | 22 |
| Profit from other business transactions | (101) | (146) | (44) |
| Gains/losses related to bonds (B) | (119) | (163) | (44) |
| General & administrative expenses (C) | 614 | 718 | 104 |
| Actual net business profit (A-C) | 348 | 381 | 32 |
| Core net business profit (A-B-C) | 467 | 545 | 77 |
| Net business profit (A-C-D) | 353 | 381 | 27 |
| Gains/losses related to stocks (E) | 295 | 352 | 56 |
| Ordinary profit | 599 | 758 | 158 |
| Profit | 459 | 665 | 205 |
| Profit/losses related to securities (B+E+F) | 173 | 184 | 10 |
| Credit related expenses | 17 | (3) | (20) |
Asset Quality and Capital Adequacy
Credit related expenses on a non-consolidated basis were negative, shown as (3) in the table above, because gains on reversal of allowance for loan losses were recorded even though the number of downgraded borrowers increased. Non-performing loans totaled 1,322 (100 million yen) at March 2026 for Hachijuni Nagano Bank, against 1,063 at March 2025 for The Hachijuni Bank, and the non-performing loan ratio was 1.91%, compared with 1.73% a year earlier. The allowance for credit losses totaled 458 (100 million yen) at March 2026, of which the general allowance was 209 and the specific allowance 248. Under Basel III standards, the non-consolidated capital adequacy ratio, tier 1 ratio and common equity tier 1 ratio were all 15.22%, down 0.43 points, as these three ratios are the same because the Bank has not procured funds through means such as subordinated debt. The consolidated capital adequacy ratio was 16.72% at March 2026, against 16.29% at March 2025.
Group Company Results
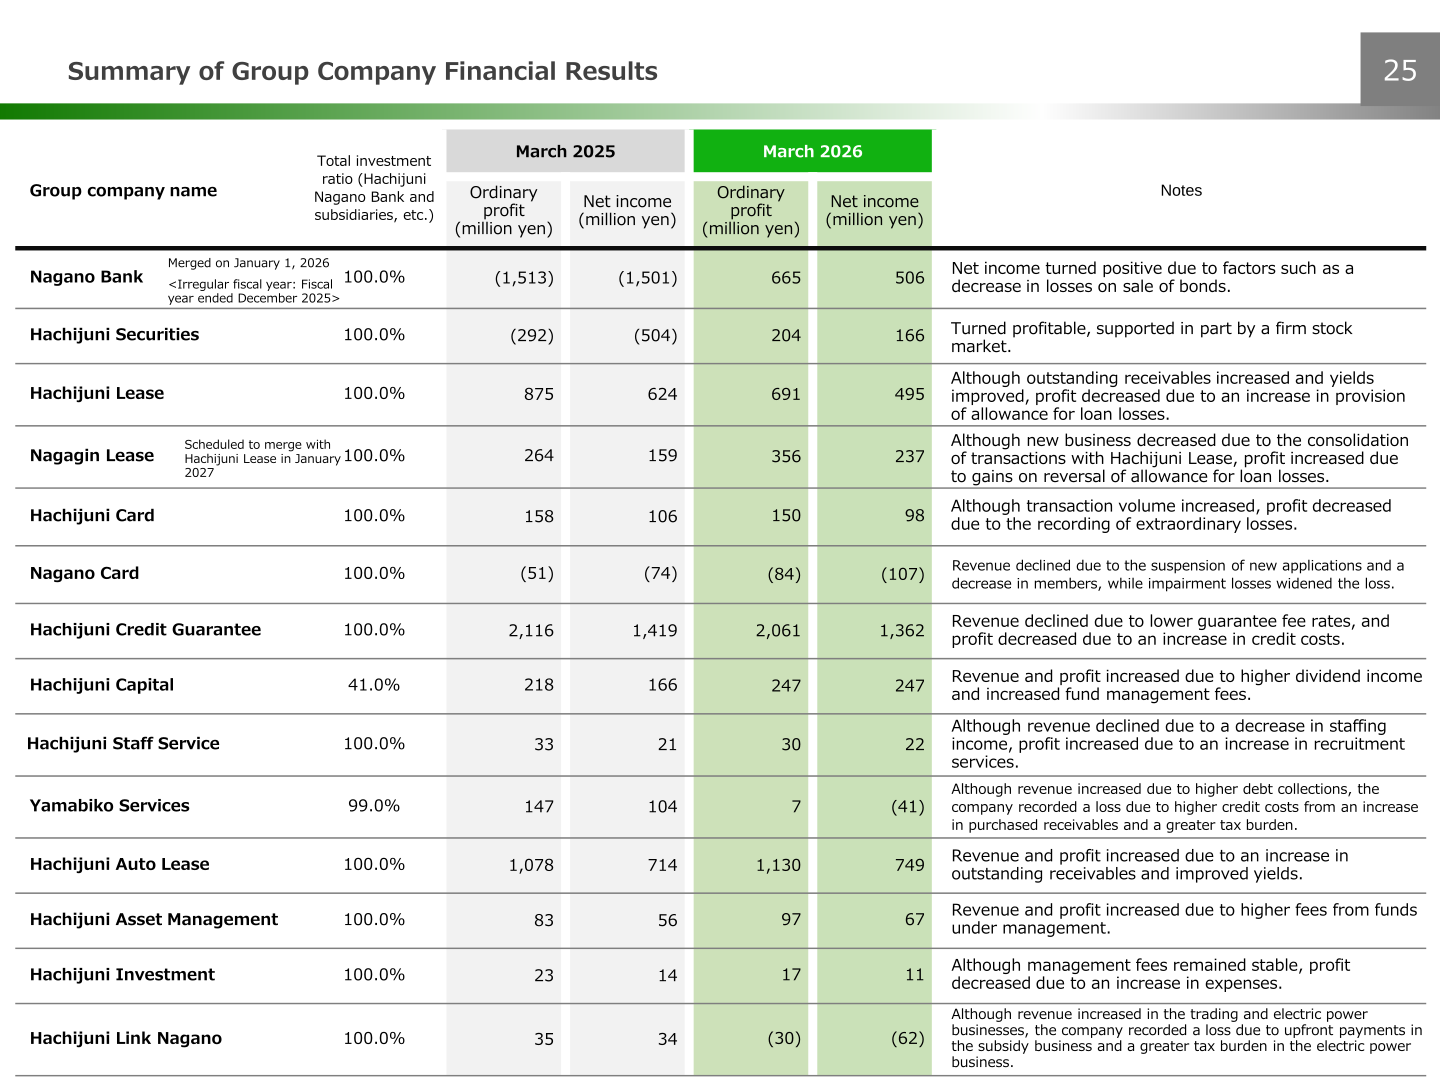
The materials disclose ordinary profit and net income for each group company. The Nagano Bank’s net income turned positive due to factors such as a decrease in losses on sale of bonds, and Hachijuni Securities turned profitable, supported in part by a firm stock market. The Nagano Bank figures for March 2026 cover the irregular fiscal year ended December 2025, and Nagagin Lease is scheduled to merge with Hachijuni Lease in January 2027.
| Group company (million yen) | Ordinary profit March 2025 | Net income March 2025 | Ordinary profit March 2026 | Net income March 2026 |
|---|---|---|---|---|
| Nagano Bank | (1,513) | (1,501) | 665 | 506 |
| Hachijuni Securities | (292) | (504) | 204 | 166 |
| Hachijuni Lease | 875 | 624 | 691 | 495 |
| Nagagin Lease | 264 | 159 | 356 | 237 |
| Hachijuni Card | 158 | 106 | 150 | 98 |
| Nagano Card | (51) | (74) | (84) | (107) |
| Hachijuni Credit Guarantee | 2,116 | 1,419 | 2,061 | 1,362 |
| Hachijuni Capital | 218 | 166 | 247 | 247 |
| Hachijuni Staff Service | 33 | 21 | 30 | 22 |
| Yamabiko Services | 147 | 104 | 7 | (41) |
| Hachijuni Auto Lease | 1,078 | 714 | 1,130 | 749 |
| Hachijuni Asset Management | 83 | 56 | 97 | 67 |
| Hachijuni Investment | 23 | 14 | 17 | 11 |
| Hachijuni Link Nagano | 35 | 34 | (30) | (62) |
FY2026 Forecast
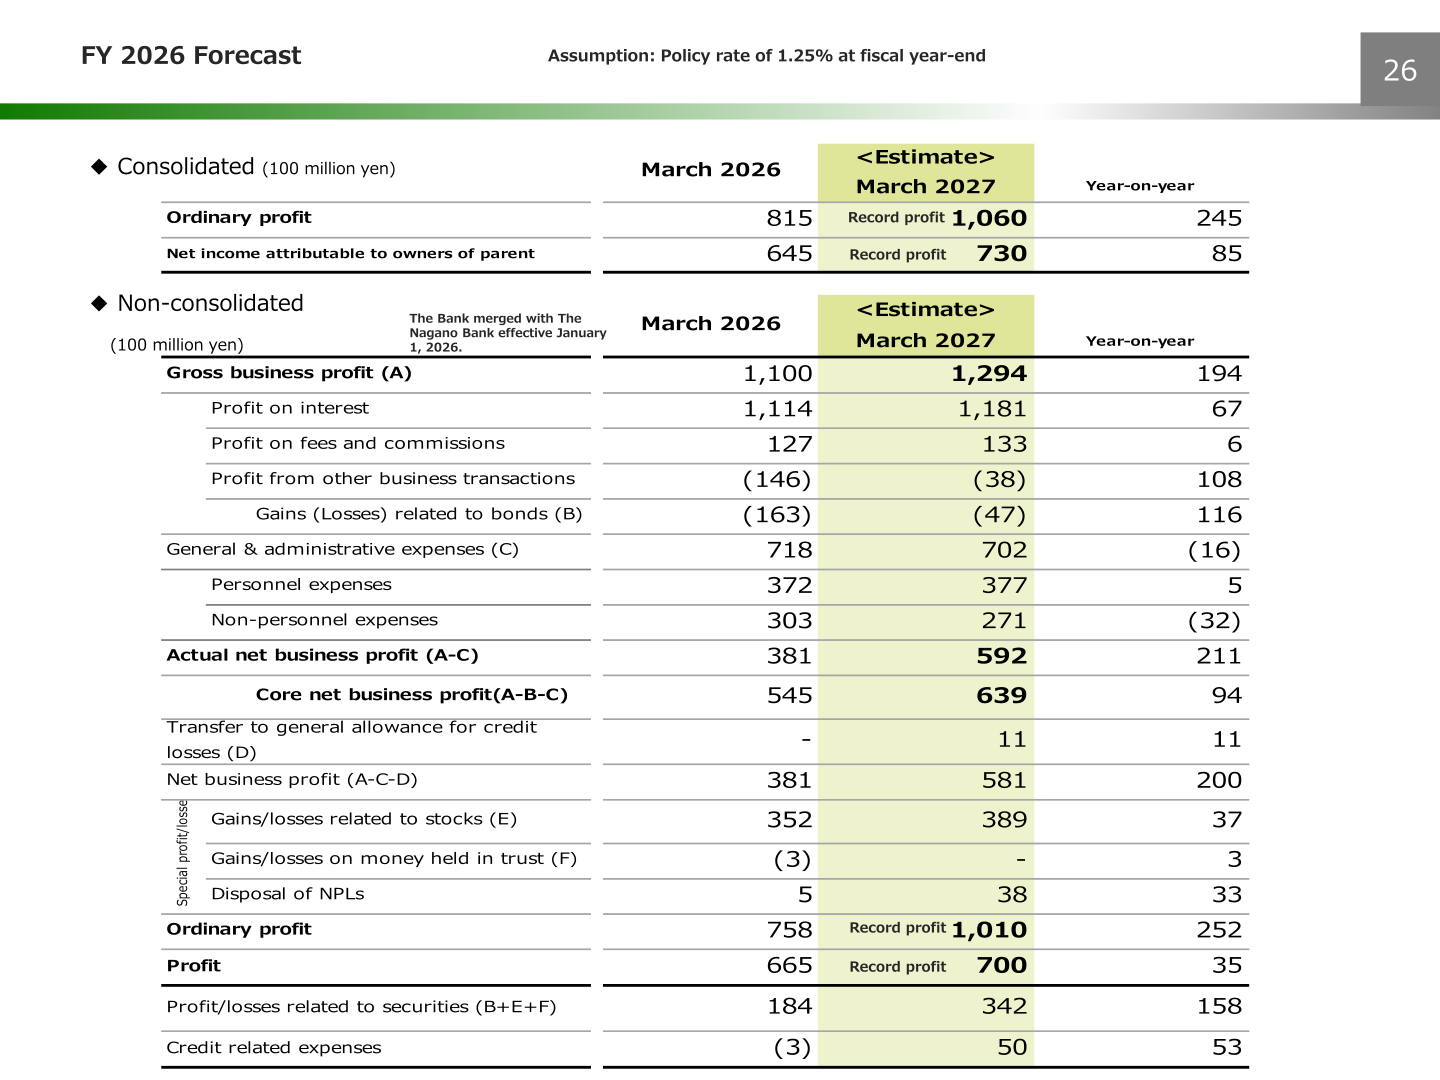
For FY2026, the Bank forecasts record profit at both the consolidated and non-consolidated levels, based on an assumption of a policy rate of 1.25% at fiscal year-end.
| Item (100 million yen) | March 2026 | <Estimate> March 2027 | Year-on-year |
|---|---|---|---|
| Consolidated: Ordinary profit | 815 | 1,060 | 245 |
| Consolidated: Net income attributable to owners of parent | 645 | 730 | 85 |
| Non-consolidated: Gross business profit (A) | 1,100 | 1,294 | 194 |
| Non-consolidated: Profit on interest | 1,114 | 1,181 | 67 |
| Non-consolidated: Profit on fees and commissions | 127 | 133 | 6 |
| Non-consolidated: General & administrative expenses (C) | 718 | 702 | (16) |
| Non-consolidated: Actual net business profit (A-C) | 381 | 592 | 211 |
| Non-consolidated: Core net business profit (A-B-C) | 545 | 639 | 94 |
| Non-consolidated: Ordinary profit | 758 | 1,010 | 252 |
| Non-consolidated: Profit | 665 | 700 | 35 |
| Non-consolidated: Credit related expenses | (3) | 50 | 53 |
Shareholder Returns
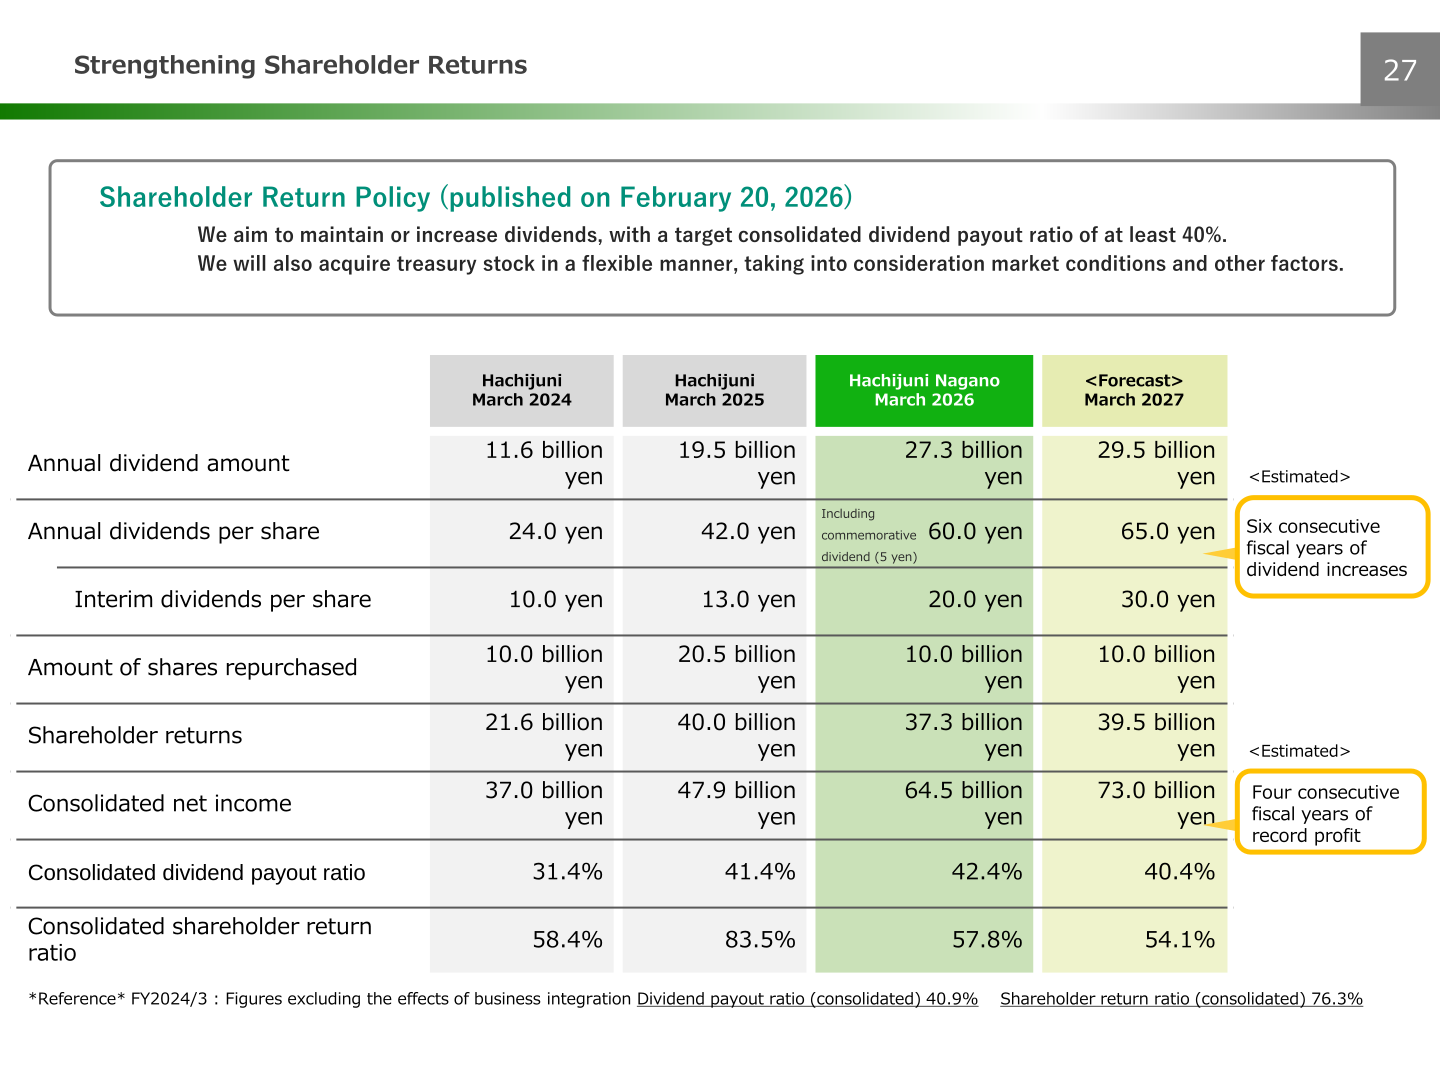
Under the Shareholder Return Policy published on February 20, 2026, the Bank aims to maintain or increase dividends, with a target consolidated dividend payout ratio of at least 40%, and will also acquire treasury stock in a flexible manner, taking into consideration market conditions and other factors. The annual dividend per share for March 2026 was 60.0 yen, including a commemorative dividend of 5 yen, and the forecast for March 2027 is 65.0 yen, which the materials describe as six consecutive fiscal years of dividend increases.
| Item | Hachijuni March 2024 | Hachijuni March 2025 | Hachijuni Nagano March 2026 | <Forecast> March 2027 |
|---|---|---|---|---|
| Annual dividend amount | 11.6 billion yen | 19.5 billion yen | 27.3 billion yen | 29.5 billion yen |
| Annual dividends per share | 24.0 yen | 42.0 yen | 60.0 yen | 65.0 yen |
| Interim dividends per share | 10.0 yen | 13.0 yen | 20.0 yen | 30.0 yen |
| Amount of shares repurchased | 10.0 billion yen | 20.5 billion yen | 10.0 billion yen | 10.0 billion yen |
| Shareholder returns | 21.6 billion yen | 40.0 billion yen | 37.3 billion yen | 39.5 billion yen |
| Consolidated net income | 37.0 billion yen | 47.9 billion yen | 64.5 billion yen | 73.0 billion yen |
| Consolidated dividend payout ratio | 31.4% | 41.4% | 42.4% | 40.4% |
| Consolidated shareholder return ratio | 58.4% | 83.5% | 57.8% | 54.1% |
Medium-Term Management Plan and PBR/ROE Initiatives
The Hachijuni Group First Medium-term Management Plan, announced on February 20, 2026, covers Fiscal Years 2026 to 2028 and is the first phase toward Long-term Vision 2035, “Building a Prosperous Future Together with the Region.” Management targets for fiscal 2028 include consolidated ROE of at least 8.0%, profit attributable to owners of parent of ¥85 billion or more, an average deposit and NCD balance of ¥10,000 billion, an average loan balance of ¥7,100 billion and services-related profit of ¥21 billion, against fiscal 2025 figures of 6.1%, ¥64.5 billion, ¥9,136.3 billion, ¥6,291.2 billion and ¥17.1 billion respectively. The plan also sets a cumulative three-year total of 300,000 consulting engagements and an increase of 250 people in human resource allocation linked to the management plan.
The materials state that improving ROE is the key to increasing the Bank’s low PBR, and that the previous ROE target of 5.0% or more in FY2027 was achieved in FY2025 ahead of schedule. The Bank plans a three-year cumulative total of ¥20 billion in system investments and an M&A strategic investment framework of ¥150 billion, and intends to conduct capital management with an aim of maintaining a CET1 ratio of approximately 12.5%, which is based on the minimum level necessary to maintain dividends (10.5%) while also being prepared for strategic investments such as M&A and for natural disasters.
This article is an analysis based on publicly available information and is not a recommendation to buy or sell any specific securities. Investment decisions are your own responsibility.
![[Obayashi] Investors’ Guide 2026 — The Complete 24-Article Breakdown](https://japan-equity.com/wp-content/uploads/2026/07/hub_cover-1024x1024.png)
![[Obayashi] IR & SR Policy — Feeding Dialogue Back into Management](https://japan-equity.com/wp-content/uploads/2026/07/p32_sq-1024x1024.jpg)
![[Obayashi] Domestic Civil Engineering — Resilience Spending Supports 9.6% Margin](https://japan-equity.com/wp-content/uploads/2026/07/p11_sq-1024x1024.jpg)
![[Obayashi] Overseas Construction — Orders Reach ¥1.2tn](https://japan-equity.com/wp-content/uploads/2026/07/p15_sq-1024x1024.jpg)
![[Obayashi] Share Price & External Ratings — vs TOPIX, ESG Index Inclusion](https://japan-equity.com/wp-content/uploads/2026/07/p40_sq-1024x1024.jpg)
![[Construction] ¥75.5tn Investment, Shrinking Workforce — Big-5 Market Share](https://japan-equity.com/wp-content/uploads/2026/07/p12_sq-1024x1024.jpg)



![[Obayashi] Capital Policy & Shareholder Returns — ROE 10%+, DOE ~5%, ¥100bn Buyback](https://japan-equity.com/wp-content/uploads/2026/07/p27_sq-1024x1024.jpg)
![[Obayashi] Reducing Cross-Shareholdings — ¥285.2bn Sold in Five Years](https://japan-equity.com/wp-content/uploads/2026/07/p29_sq-1024x1024.jpg)
![[Obayashi] ¥750bn Investment Plan — ¥300bn to Development, ¥190bn to Tech/DX](https://japan-equity.com/wp-content/uploads/2026/07/p30_sq-1024x1024.jpg)
![[Obayashi] MTP2022 KPIs — Operating Profit ~2x Target, ROE 14.4%](https://japan-equity.com/wp-content/uploads/2026/07/p25_sq-1024x1024.jpg)
![[Obayashi] Cash Allocation — ¥420bn Investment CF Over Five Years](https://japan-equity.com/wp-content/uploads/2026/07/p26_sq-1024x1024.jpg)
![[Obayashi] Green Energy — 44 Plants, 344MW, and the Green Hydrogen Challenge](https://japan-equity.com/wp-content/uploads/2026/07/p21_sq-1024x1024.jpg)
![[Obayashi] Tackling the Labor Shortage — Robotics Construction®](https://japan-equity.com/wp-content/uploads/2026/07/p14_sq-1024x1024.jpg)
