
This article is based on publicly available IR materials and is not a recommendation to buy or sell any specific securities.
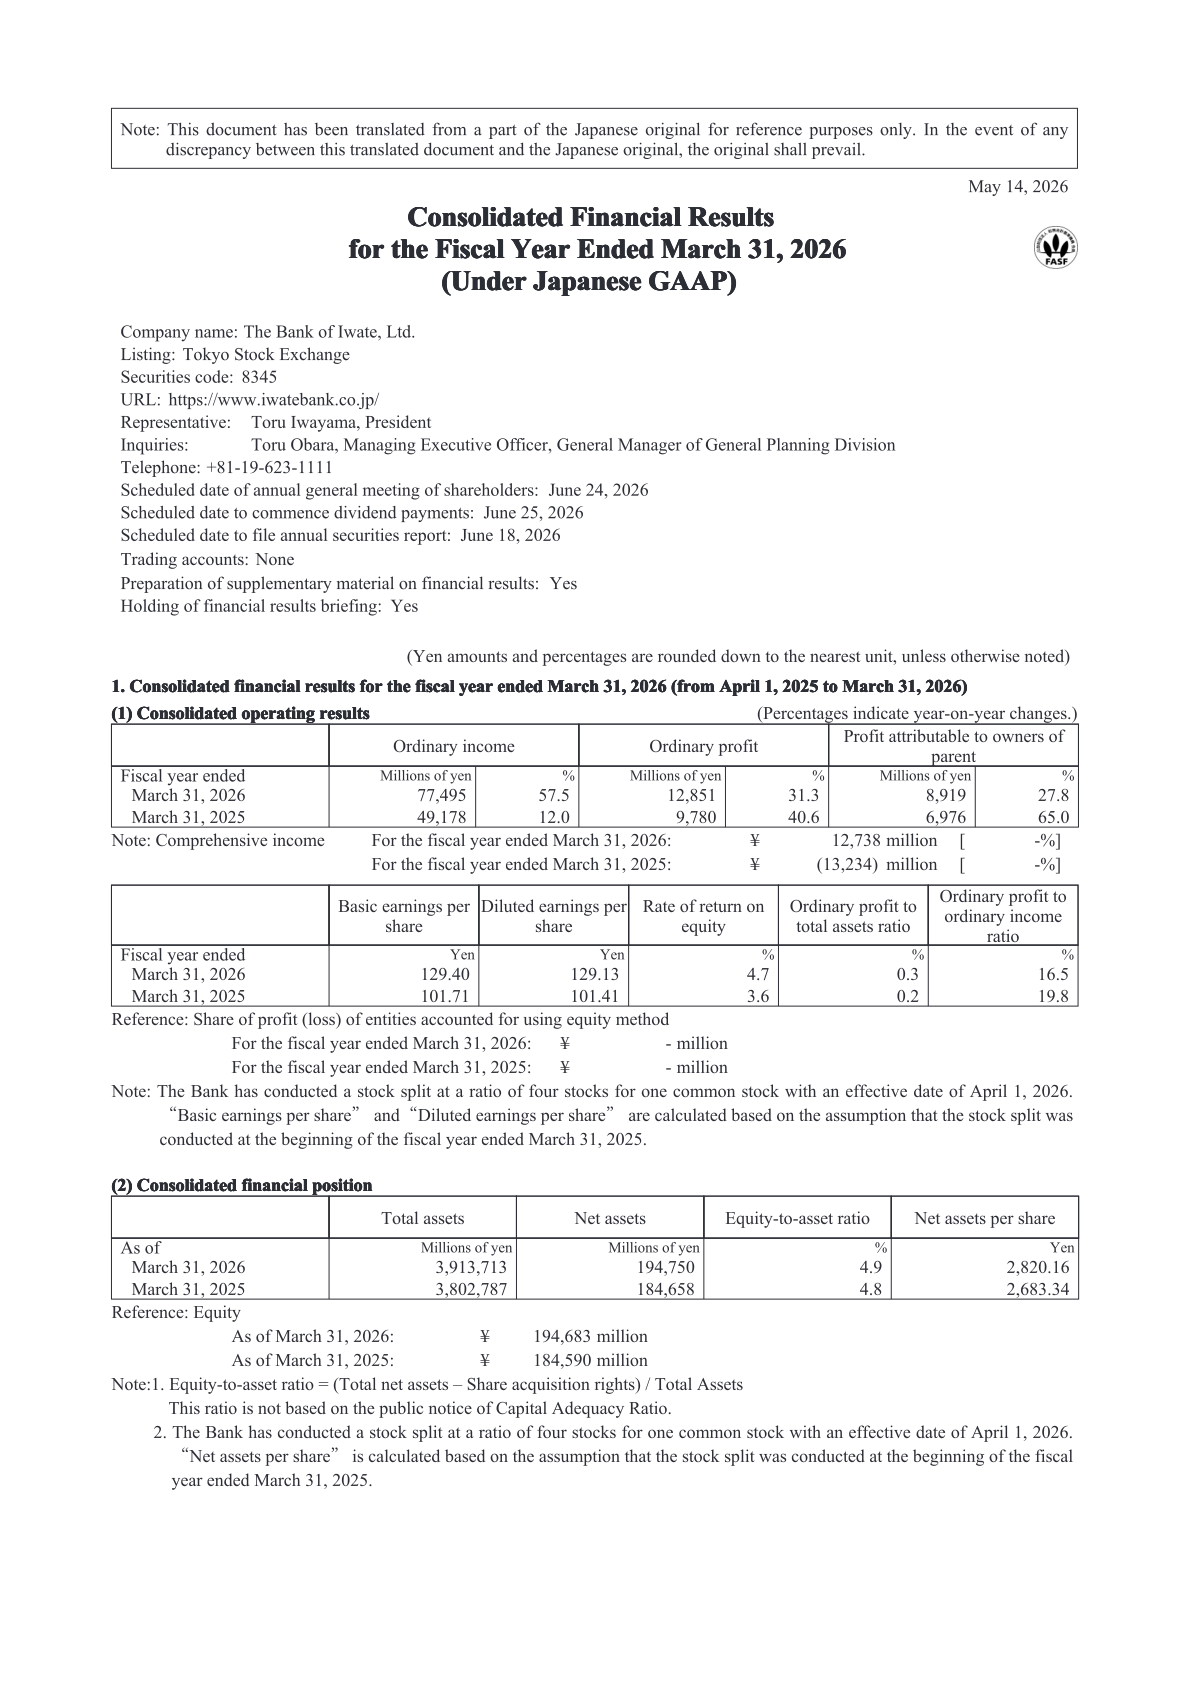
The Bank of Iwate, Ltd. reported consolidated ordinary income of 77,495 million yen for the fiscal year ended March 31, 2026, up 57.5% year on year, with ordinary profit of 12,851 million yen (up 31.3%) and profit attributable to owners of parent of 8,919 million yen (up 27.8%). Note: japan-equity.com refers to the fiscal year ended March 31, 2026 as FY2025 and the fiscal year ended March 31, 2025 as FY2024, following this site’s naming convention; the source document itself labels these periods “the fiscal year ended March 31, 2026” (FYE 3/2026) and “the fiscal year ended March 31, 2025” (FYE 3/2025) respectively.
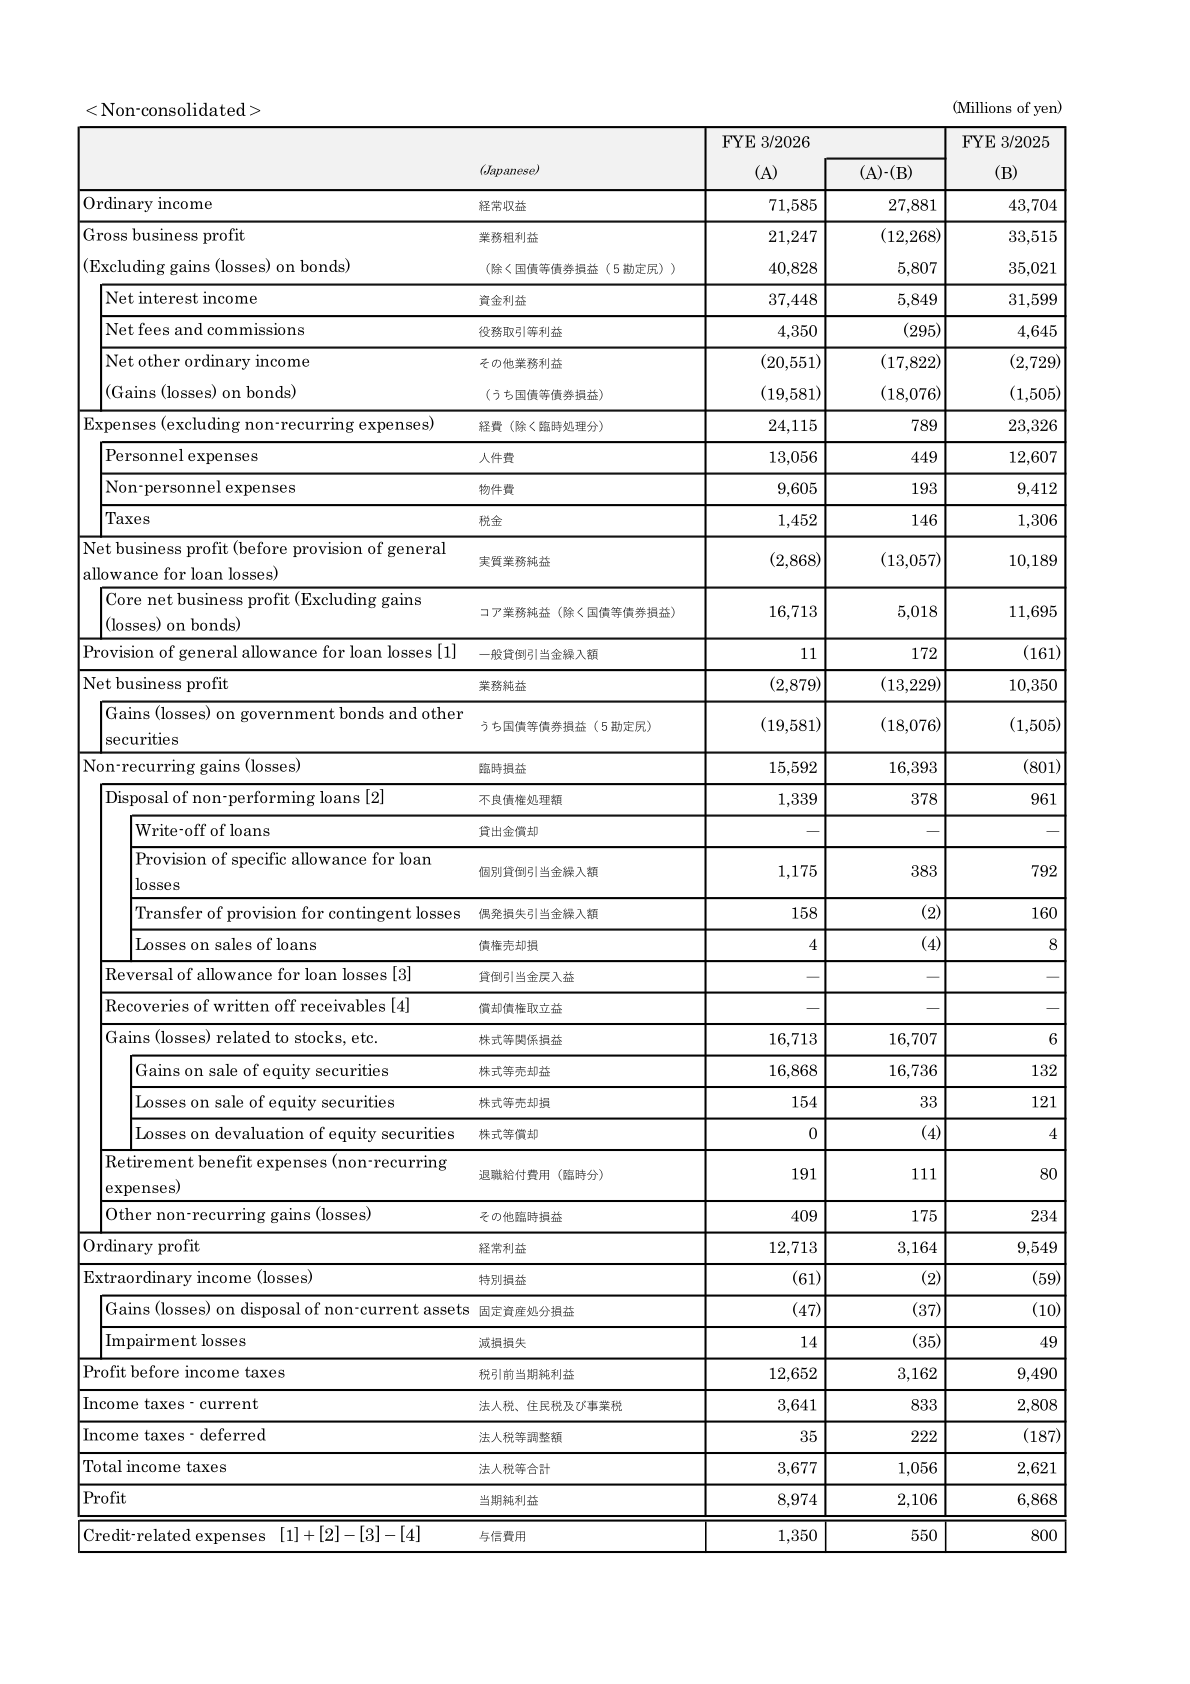
On a non-consolidated basis, net business profit (before provision of general allowance for loan losses) swung to a loss of (2,868) million yen from a profit of 10,189 million yen a year earlier, as gains (losses) on bonds fell to a loss of (19,581) million yen from a loss of (1,505) million yen. This was more than offset by gains (losses) related to stocks, etc. of 16,713 million yen (versus 6 million yen a year earlier), which included gains on sale of equity securities of 16,868 million yen (versus 132 million yen). Core net business profit (excluding gains (losses) on bonds), a key measure of core banking profitability, rose to 16,713 million yen from 11,695 million yen.
Consolidated Results (Full-Year Actual)
Consolidated operating results and financial position for the fiscal year ended March 31, 2026, as reported in the Bank’s Consolidated Financial Results (Under Japanese GAAP):
| Item | FY2025 (FYE 3/2026) | FY2024 (FYE 3/2025) | Change (YoY) |
|---|---|---|---|
| Ordinary income (Millions of yen) | 77,495 | 49,178 | +57.5% |
| Ordinary profit (Millions of yen) | 12,851 | 9,780 | +31.3% |
| Profit attributable to owners of parent (Millions of yen) | 8,919 | 6,976 | +27.8% |
| Comprehensive income (Millions of yen) | 12,738 | (13,234) | – |
| Basic earnings per share (Yen) | 129.40 | 101.71 | – |
| Rate of return on equity (%) | 4.7 | 3.6 | – |
| Total assets (Millions of yen) | 3,913,713 | 3,802,787 | – |
| Net assets (Millions of yen) | 194,750 | 184,658 | – |
| Equity-to-asset ratio (%) | 4.9 | 4.8 | – |
Note: The Bank conducted a four-for-one stock split effective April 1, 2026. Basic earnings per share and net assets per share for the fiscal year ended March 31, 2025 are stated as if the stock split had been conducted at the beginning of that fiscal year.
Non-Consolidated Core Banking Metrics
As a bank, the company’s supplementary information breaks out profit and loss on a non-consolidated basis using bank-specific line items such as gross business profit, core net business profit, and credit-related expenses. Figures below are non-consolidated, in millions of yen, with (A)-(B) as printed in the source.
| Item | FY2025 (FYE 3/2026) (A) | (A)-(B) | FY2024 (FYE 3/2025) (B) |
|---|---|---|---|
| Ordinary income | 71,585 | 27,881 | 43,704 |
| Gross business profit | 21,247 | (12,268) | 33,515 |
| (Excluding gains (losses) on bonds) | 40,828 | 5,807 | 35,021 |
| Net interest income | 37,448 | 5,849 | 31,599 |
| Net fees and commissions | 4,350 | (295) | 4,645 |
| Net other ordinary income | (20,551) | (17,822) | (2,729) |
| Expenses (excluding non-recurring expenses) | 24,115 | 789 | 23,326 |
| Net business profit (before provision of general allowance for loan losses) | (2,868) | (13,057) | 10,189 |
| Core net business profit (Excluding gains (losses) on bonds) | 16,713 | 5,018 | 11,695 |
| Net business profit | (2,879) | (13,229) | 10,350 |
| Credit-related expenses | 1,350 | 550 | 800 |
| Ordinary profit | 12,713 | 3,164 | 9,549 |
| Profit | 8,974 | 2,106 | 6,868 |
Capital Adequacy and Asset Quality
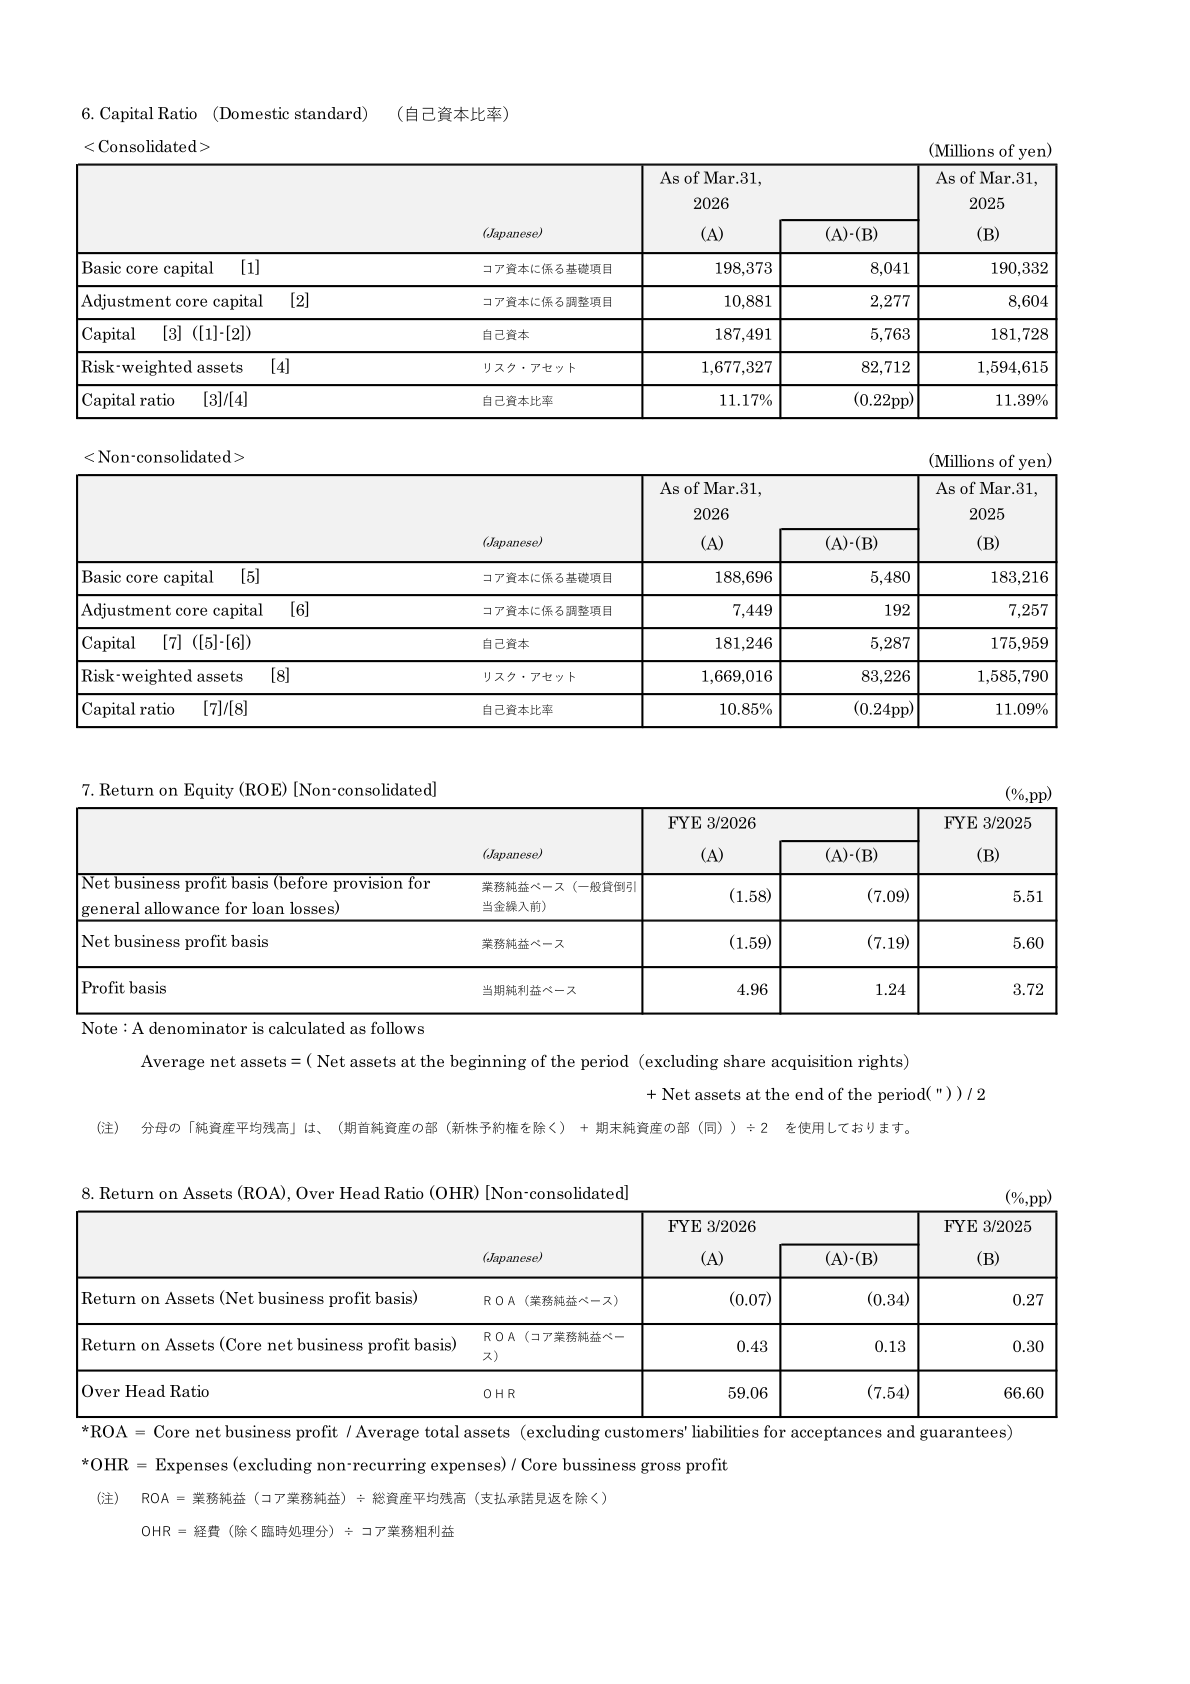
| Item | As of Mar. 31, 2026 (A) | (A)-(B) | As of Mar. 31, 2025 (B) |
|---|---|---|---|
| Capital ratio, Consolidated (%) | 11.17 | (0.22pp) | 11.39 |
| Capital ratio, Non-consolidated (%) | 10.85 | (0.24pp) | 11.09 |
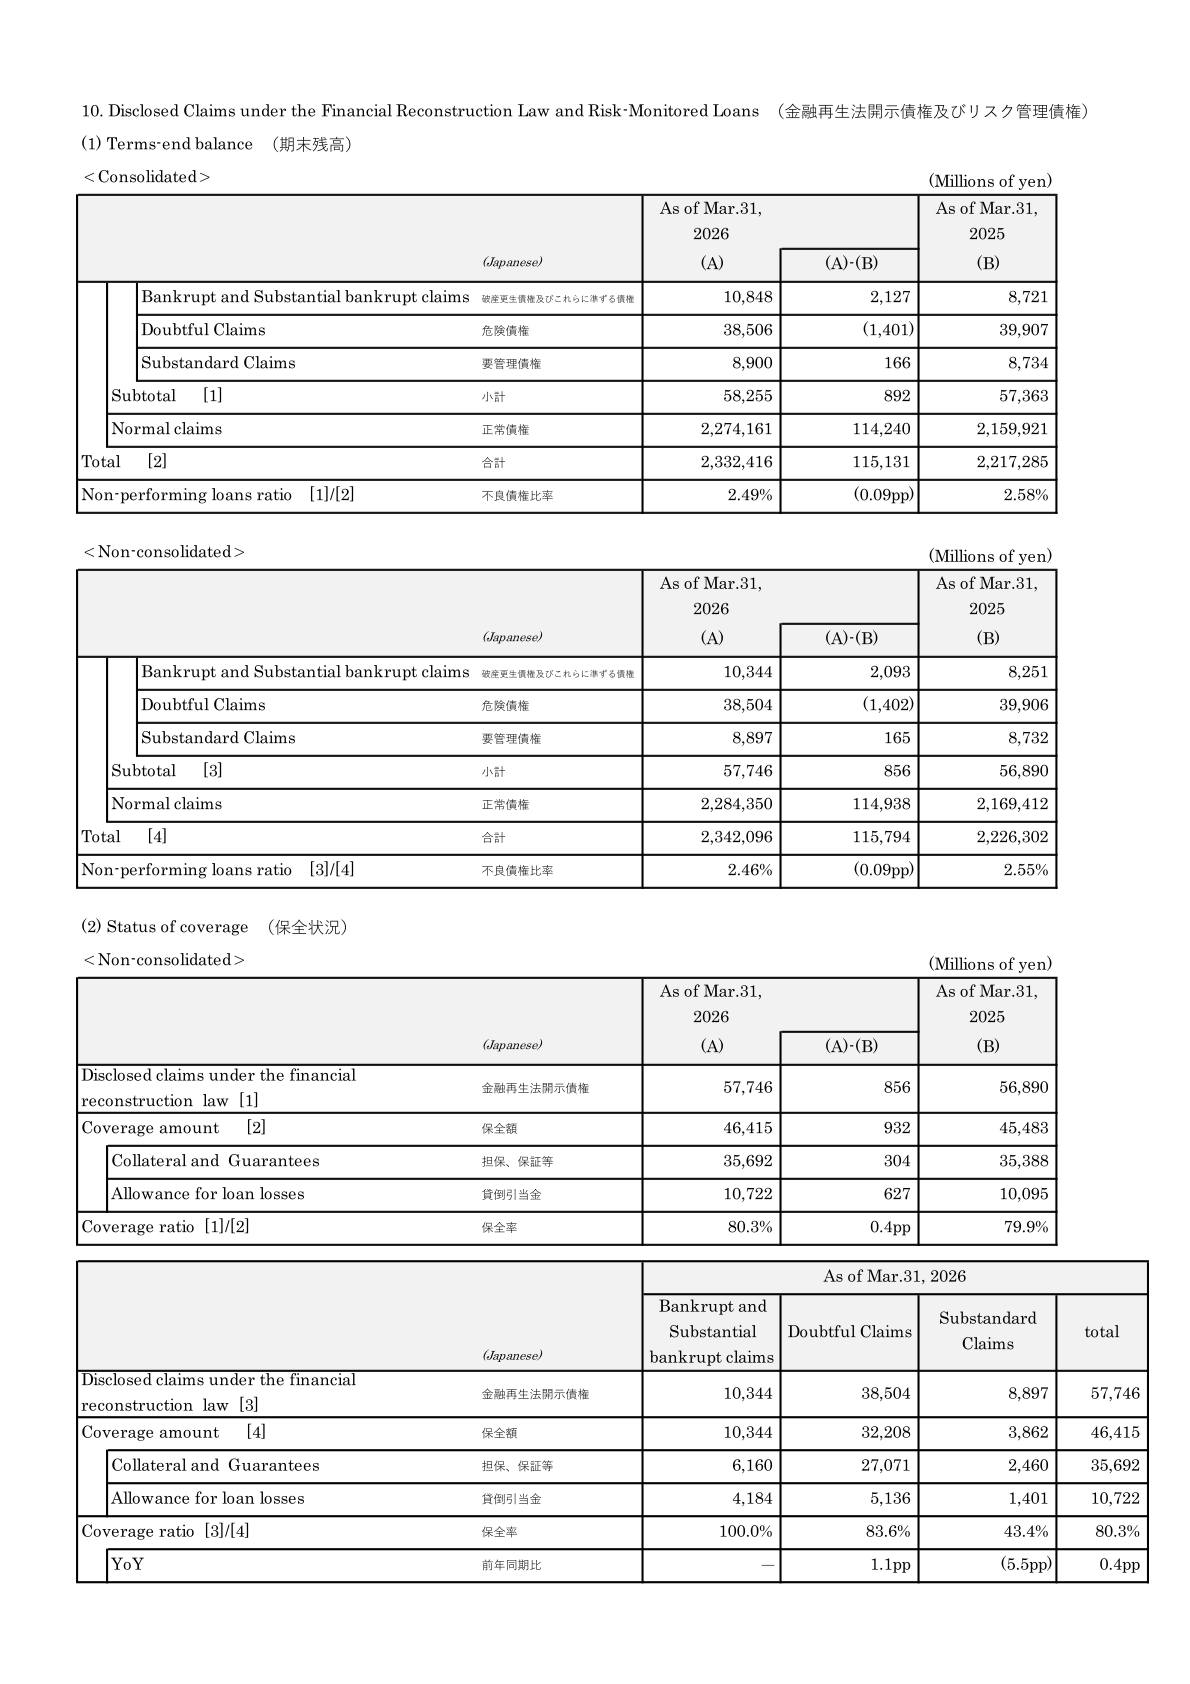
| Non-performing loans ratio, Non-consolidated (%) | 2.46 | (0.09pp) | 2.55 |
| Coverage ratio, Non-consolidated (%) | 80.3 | 0.4pp | 79.9 |
| ROE (Profit basis), Non-consolidated (%) | 4.96 | 1.24pp | 3.72 |
| ROA (Core net business profit basis), Non-consolidated (%) | 0.43 | 0.13pp | 0.30 |
| Over Head Ratio (OHR), Non-consolidated (%) | 59.06 | (7.54pp) | 66.60 |
Deposits and Loans (Non-Consolidated, Term-End Balance)
| Item | As of Mar. 31, 2026 (A) | (A)-(B) | As of Mar. 31, 2025 (B) |
|---|---|---|---|
| Deposits and Negotiable certificates of deposit (Millions of yen) | 3,463,887 | 41,612 | 3,422,275 |
| Deposits (Millions of yen) | 3,229,497 | 27,238 | 3,202,259 |
| Loans and bills discounted (Millions of yen) | 2,323,787 | 117,107 | 2,206,680 |
| Loans and bills discounted, within Iwate Prefecture (Millions of yen) | 1,681,281 | 78,734 | 1,602,547 |
| Loans and bills discounted, to individuals (Millions of yen) | 563,052 | 11,165 | 551,887 |
FY2026 Forecast
For the fiscal year ending March 31, 2027, the Bank forecasts consolidated ordinary profit of 14,500 million yen (up 12.8% year on year) and profit attributable to owners of parent of 10,000 million yen (up 12.1%), with basic earnings per share of 144.85 yen (stated after the four-for-one stock split effective April 1, 2026). For the six months ending September 30, 2026, the Bank forecasts ordinary profit of 7,200 million yen (up 12.2%) and profit attributable to owners of parent of 5,000 million yen (up 14.7%), with basic earnings per share of 72.42 yen.
| Item | FY2026 Forecast (FYE 3/2027) | FY2025 (Actual, FYE 3/2026) |
|---|---|---|
| Ordinary profit, Full year (Millions of yen) | 14,500 | 12,851 |
| Profit attributable to owners of parent, Full year (Millions of yen) | 10,000 | 8,919 |
| Basic earnings per share, Full year (Yen) | 144.85 | 129.40 |
| Ordinary profit, Six months ending Sept. 30, 2026 (Millions of yen) | 7,200 | – |
| Profit attributable to owners of parent, Six months ending Sept. 30, 2026 (Millions of yen) | 5,000 | – |
Shareholder Returns
Annual dividends per share for the fiscal year ended March 31, 2026 totaled 208.00 yen (second quarter-end 96.00 yen, fiscal year-end 112.00 yen), up from 125.00 yen a year earlier (second quarter-end 60.00 yen, fiscal year-end 65.00 yen). Total cash dividends were 3,627 million yen, with a consolidated payout ratio of 40.1% and a ratio of dividends to consolidated net assets of 1.8%. For the fiscal year ending March 31, 2027, the Bank forecasts annual dividends per share of 58.00 yen (second quarter-end 29.00 yen, fiscal year-end 29.00 yen) with a consolidated payout ratio of 40.0%; these forecast figures are stated after the Bank’s four-for-one stock split effective April 1, 2026, and the annual total would be 232.00 yen on a pre-split basis.
| Item | FY2025 (FYE 3/2026) | FY2024 (FYE 3/2025) | FY2026 Forecast (FYE 3/2027) |
|---|---|---|---|
| Second quarter-end dividend (Yen) | 96.00 | 60.00 | 29.00 |
| Fiscal year-end dividend (Yen) | 112.00 | 65.00 | 29.00 |
| Total annual dividend (Yen) | 208.00 | 125.00 | 58.00 |
| Total cash dividends (Total) (Millions of yen) | 3,627 | 2,178 | – |
| Payout ratio (Consolidated) (%) | 40.1 | 30.7 | 40.0 |
| Ratio of dividends to net assets (Consolidated) (%) | 1.8 | 1.1 | – |
Medium-Term Plan / Topics
This cannot be confirmed from the materials.
This article is an analysis based on publicly available information and is not a recommendation to buy or sell any specific securities. Investment decisions are your own responsibility.
















