
This article is based on publicly available IR materials and is not a recommendation to buy or sell any specific securities.
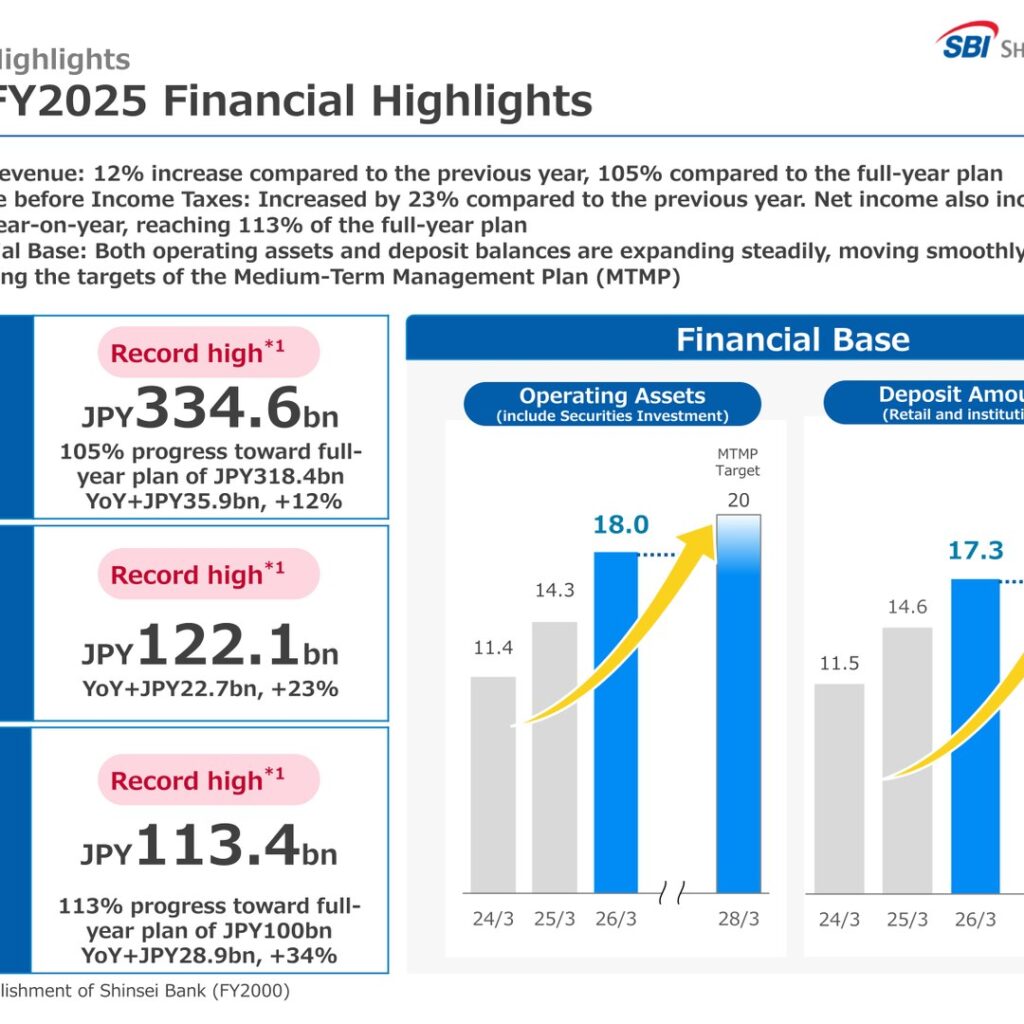
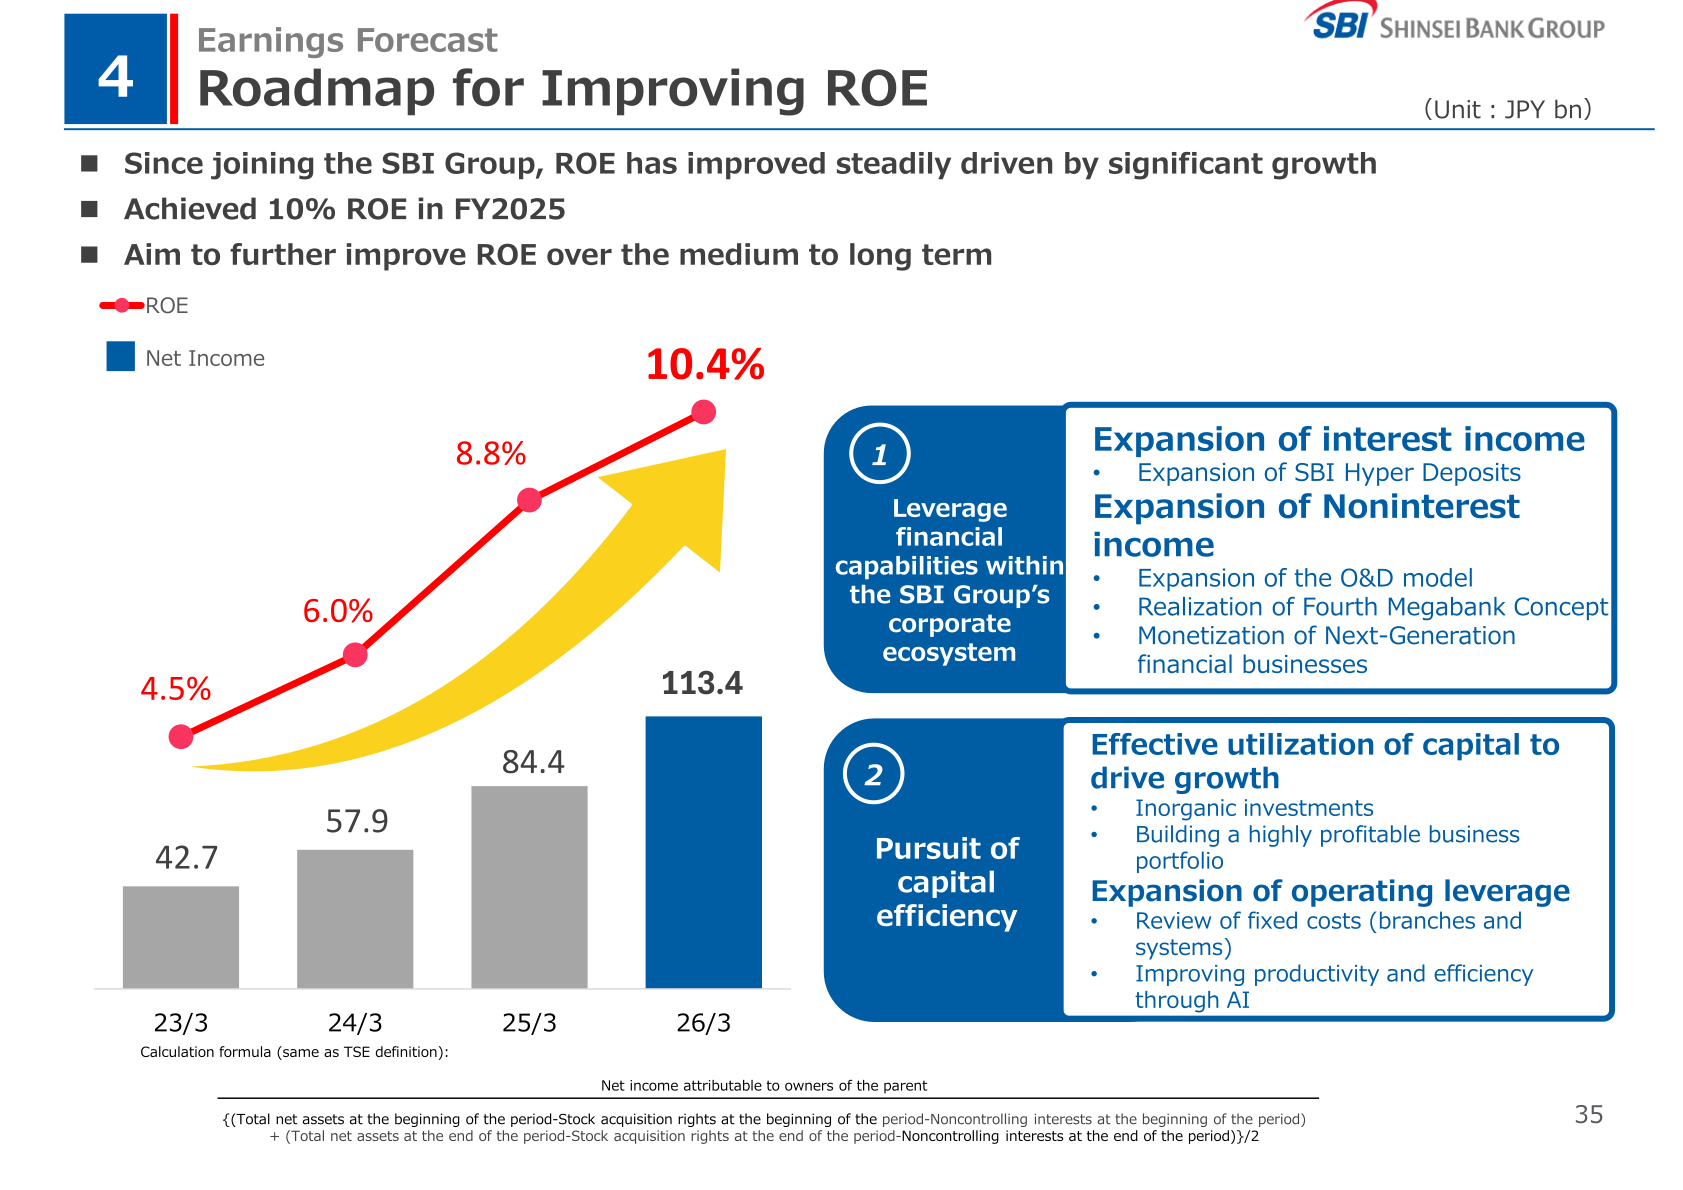
SBI Shinsei Bank posted record-high total revenue, income before income taxes and net income in FY2025 (the fiscal year for which the Bank released full-year financial statements in May 2026). Total revenue rose 12% year-on-year to JPY334.6bn and net income attributable to owners of the parent company rose 34% to JPY113.4bn, reaching 113% of the full-year plan of JPY100bn. ROE improved from 8.8% in FY2024 to 10.4% in FY2025, and the dividend per share forecast was revised upward from JPY34 to JPY42. The Bank describes FY2025 as the entry into a new stage of growth following the completion of the repayment of public funds and the relisting on the Tokyo Stock Exchange Prime Market.
Consolidated Results (Full-Year Actual)
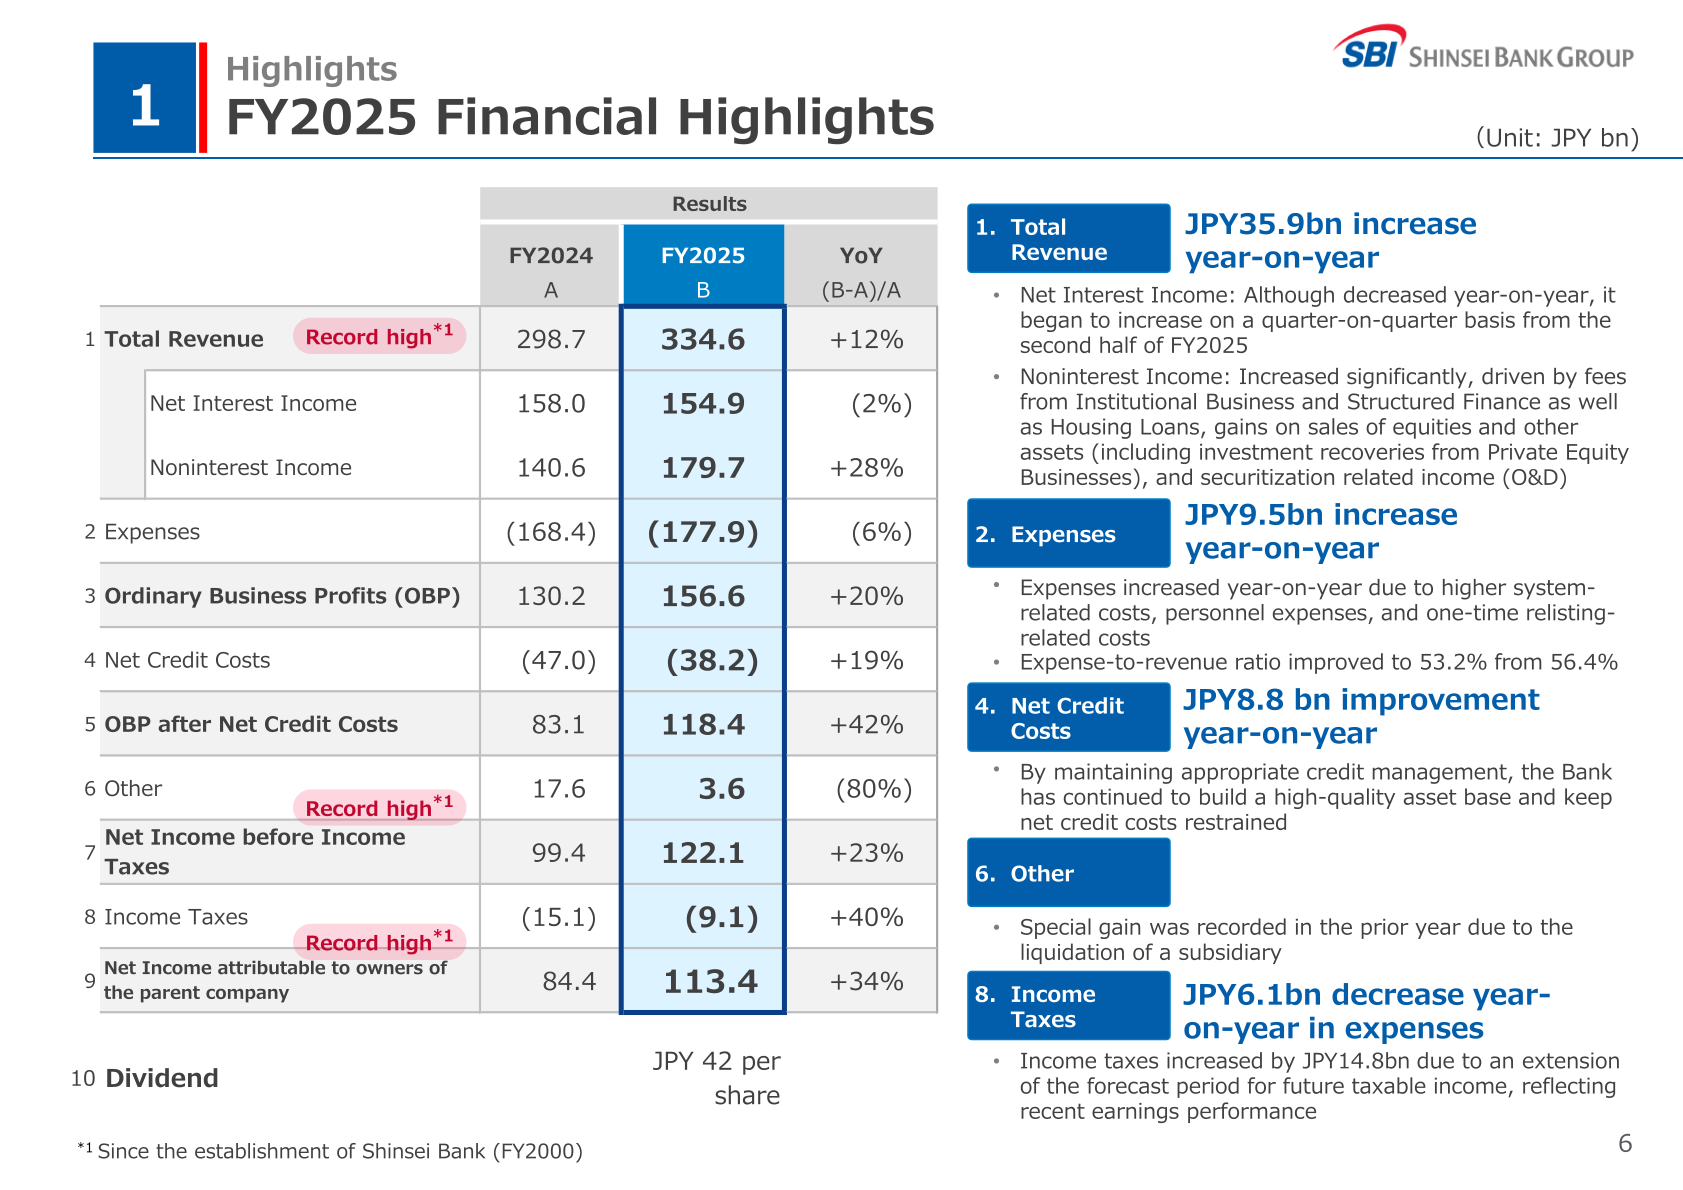
Total revenue increased by JPY35.9bn year-on-year. Net interest income decreased year-on-year, although the Bank notes that it began to increase on a quarter-on-quarter basis from the second half of FY2025. Noninterest income increased significantly, driven by fees from Institutional Business and Structured Finance as well as Housing Loans, gains on sales of equities and other assets (including investment recoveries from Private Equity Businesses), and securitization related income (O&D). Expenses rose by JPY9.5bn due to higher system-related costs, personnel expenses and one-time relisting-related costs, while the expense-to-revenue ratio improved to 53.2% from 56.4%. Net credit costs improved by JPY8.8bn year-on-year. Income taxes decreased by JPY6.1bn year-on-year in expenses; the Bank explains that income taxes increased by JPY14.8bn due to an extension of the forecast period for future taxable income, reflecting recent earnings performance. Total revenue, net income before income taxes and net income attributable to owners of the parent company were each a record high since the establishment of Shinsei Bank (FY2000).
| Item (Unit: JPY bn) | FY2024 | FY2025 | YoY |
|---|---|---|---|
| Total Revenue | 298.7 | 334.6 | +12% |
| Net Interest Income | 158.0 | 154.9 | (2%) |
| Noninterest Income | 140.6 | 179.7 | +28% |
| Expenses | (168.4) | (177.9) | (6%) |
| Ordinary Business Profits (OBP) | 130.2 | 156.6 | +20% |
| Net Credit Costs | (47.0) | (38.2) | +19% |
| OBP after Net Credit Costs | 83.1 | 118.4 | +42% |
| Other | 17.6 | 3.6 | (80%) |
| Net Income before Income Taxes | 99.4 | 122.1 | +23% |
| Income Taxes | (15.1) | (9.1) | +40% |
| Net Income attributable to owners of the parent company | 84.4 | 113.4 | +34% |
Interest Rates, Deposits and Noninterest Income
Deposit balances increased to JPY17.3tn and core earning assets expanded to JPY18.0tn. The interest rate spread between loans and deposits (attributed to the Bank only) widened to 0.55% at the end of March 2026 from 0.45% at the end of March 2025, with the loan interest rate rising 0.28% pts versus the end of March 2025. Institutional loan rates increased to 1.42%, while the institutional deposit rate rose to 0.93% and the individual deposit rate was 0.53% as of March 2026. SBI Hyper Deposits reached balances of approximately JPY1.3tn and more than 470K accounts approximately six months after launch (as of April 13, 2026). Noninterest income of JPY179.7bn comprised income from leasing and installments of 80.0, money trust management of 7.9, fees (Institutional O&D) of 14.9, fees (APLUS, etc.) of 21.1, fees (Housing loan) of 14.7, securitization (Non-bank O&D) of 14.1, capital gain of 25.0, and inorganic etc. of 1.7 (Unit: JPY bn).
Segment Results
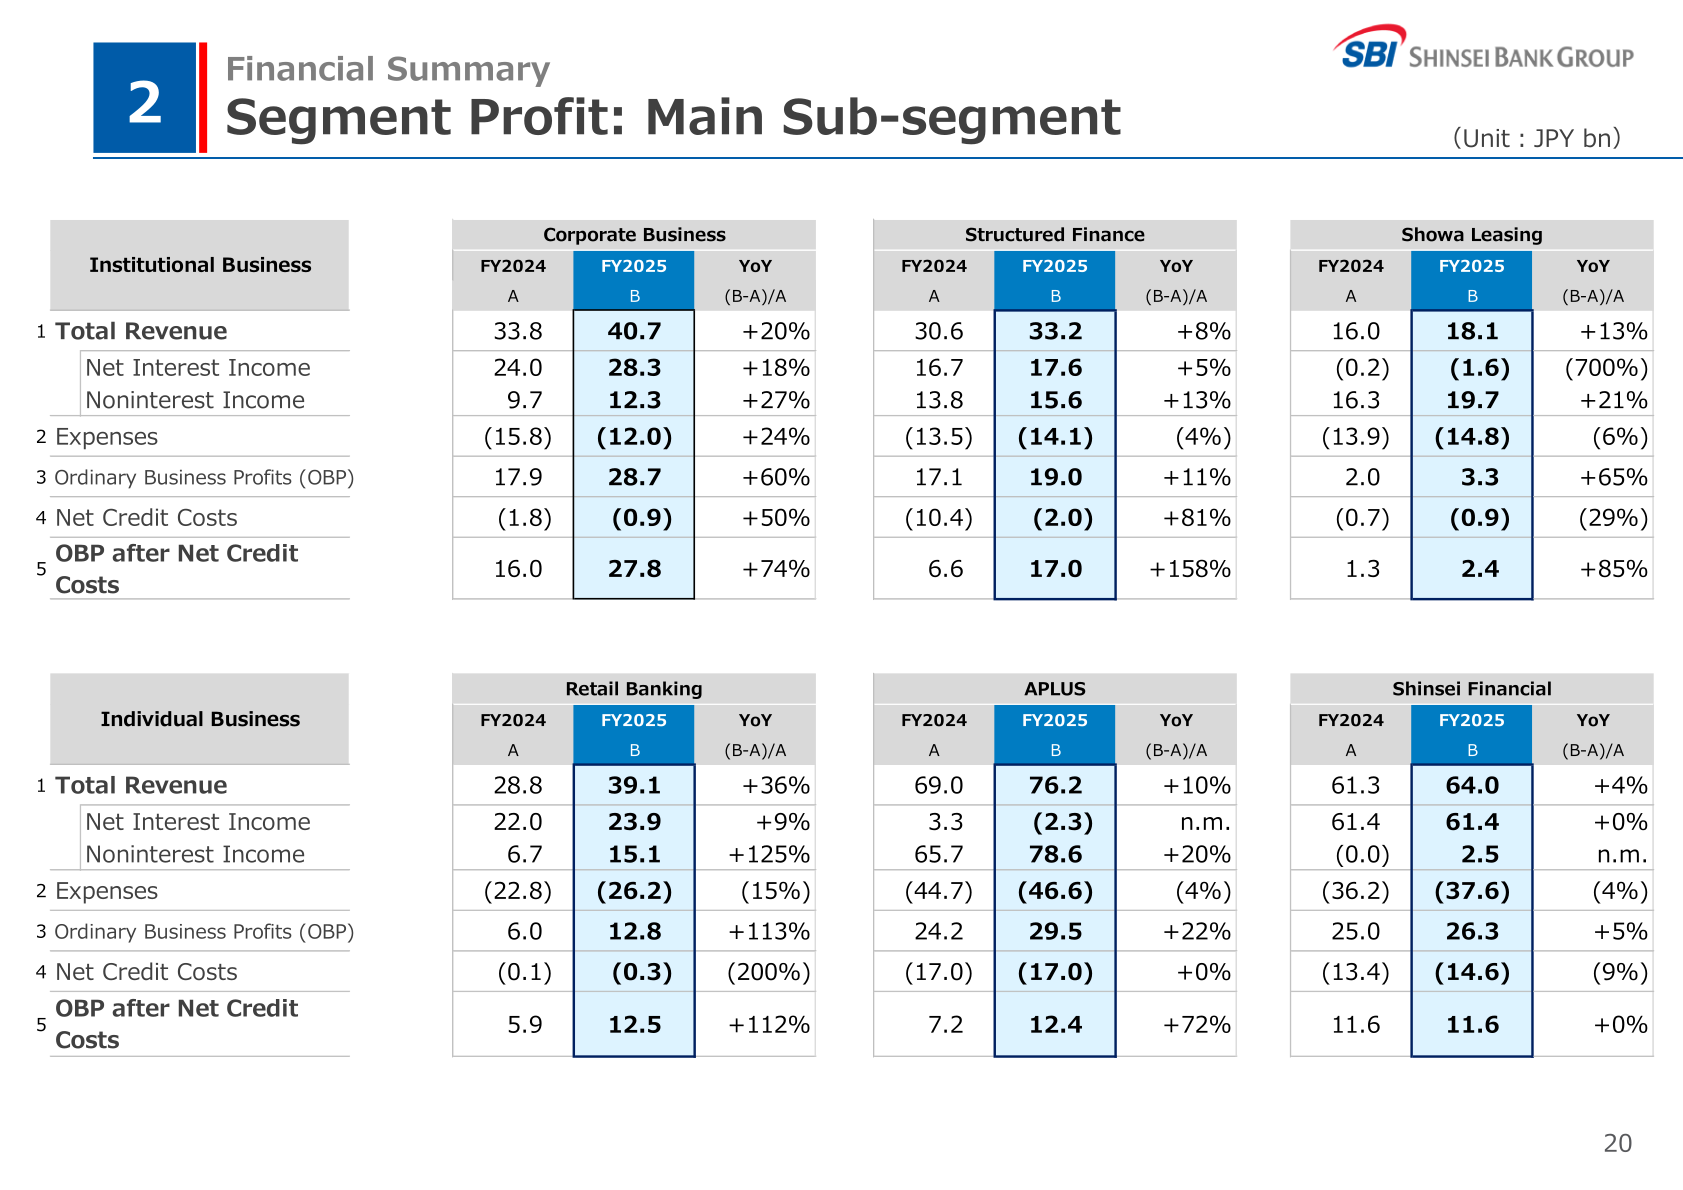
The Institutional Business segment comprises Corporate Business, Structured Finance, Showa Leasing, Principal Transactions and Financial Markets; the Individual Business segment consists of Retail Banking, Shinsei Financial, APLUS and other individual segments. In Institutional Business, noninterest income rose significantly due to factors such as the realization of PE investment returns and an increase in loan-related fees, and net credit costs improved substantially year-on-year. In Individual Business, net interest income declined mainly due to higher funding costs at APLUS despite increased income from housing loans, while noninterest income increased significantly on higher housing loan fees and securitization-related income (O&D) at non-bank subsidiaries. Securities Investment profits increased mainly on dividend income from privately placed investment trusts and interest income from the accumulation of CLO and RMBS balances.
| Segment | Item (Unit: JPY bn) | FY2024 | FY2025 | YoY |
|---|---|---|---|---|
| Institutional Business | Total Revenue | 91.9 | 120.0 | +31% |
| Institutional Business | Ordinary Business Profits (OBP) | 40.8 | 70.7 | +73% |
| Institutional Business | Net Credit Costs | (13.0) | (4.5) | +65% |
| Institutional Business | OBP after Net Credit Costs | 27.7 | 66.1 | +139% |
| Individual Business | Total Revenue | 167.2 | 190.3 | +14% |
| Individual Business | Ordinary Business Profits (OBP) | 60.1 | 76.4 | +27% |
| Individual Business | Net Credit Costs | (30.5) | (32.3) | (6%) |
| Individual Business | OBP after Net Credit Costs | 29.5 | 44.1 | +49% |
| Securities Investment | Total Revenue | 10.8 | 15.0 | +39% |
| Securities Investment | Ordinary Business Profits (OBP) | 8.0 | 10.0 | +25% |
| Securities Investment | Net Credit Costs | – | – | n.m. |
| Securities Investment | OBP after Net Credit Costs | 8.0 | 10.0 | +25% |
Asset Quality and Capital
Net credit costs decreased year-on-year to JPY38.2bn from JPY47.0bn, which the Bank attributes to strict risk control and solid recoveries, with measures for large-scale exposures largely completed in the previous fiscal year. The consolidated NPL ratio (including non-bank subsidiaries) improved to 1.01% as of March 2026 from 1.18% as of March 2025, and the non-consolidated NPL ratio improved to 0.22% from 0.27%. The capital adequacy ratio (domestic standards) was 9.68%, with total capital of JPY1,035.3bn against risk assets of JPY10,693bn; the reference CET1 ratio was 9.54% versus 8.68% a year earlier. RWA density (risk assets divided by operating assets) declined to 59% from 66%, and RORA (income before income taxes divided by risk assets) improved to 1.23% from 0.96%. Total assets rose by JPY4.4tn versus the end of March 2025 to JPY24,741.3bn, with loans of JPY10,945.6bn and deposits and NCD of JPY17,358.4bn.
FY2026 Forecast
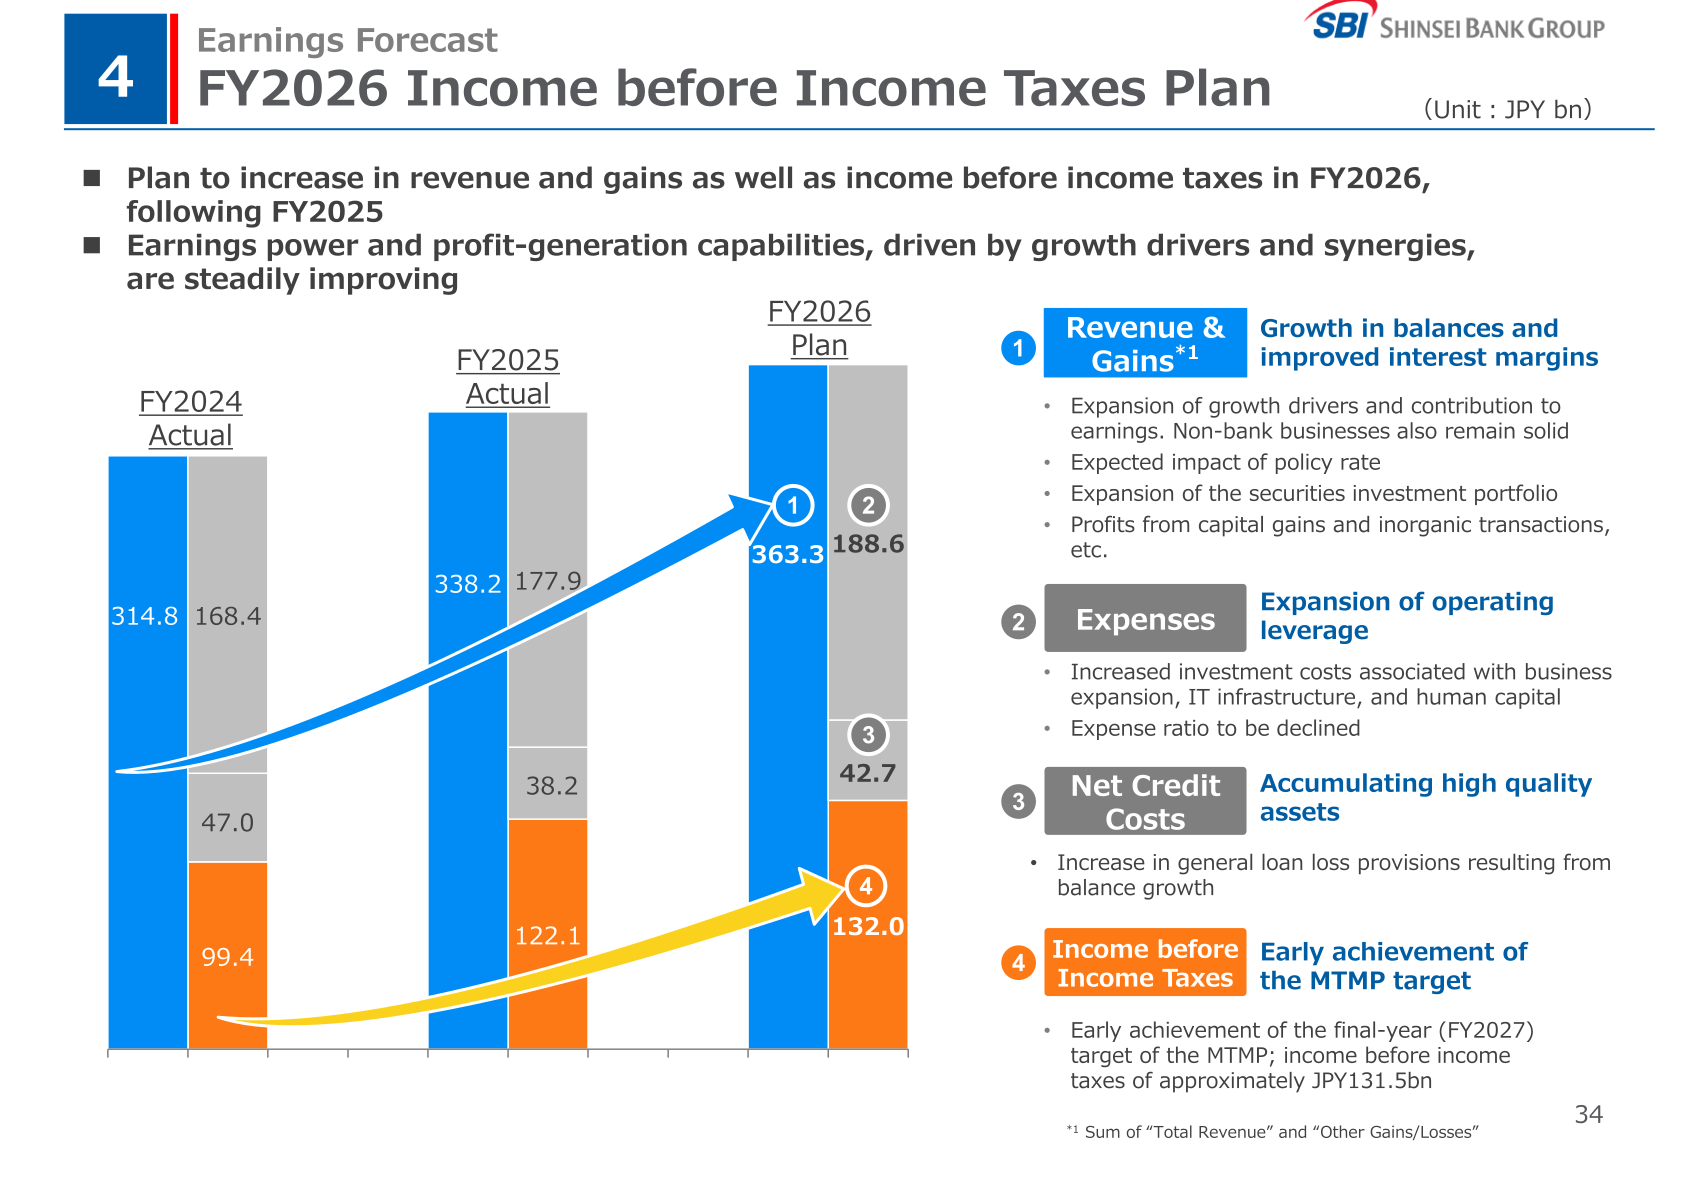
For FY2026, the Bank plans income before income taxes of JPY132.0bn, which would achieve the Medium-Term Management Plan’s FY2027 profitability target of approximately JPY131.5bn one year ahead of schedule. The plan assumes growth in balances and improved interest margins, increased investment costs associated with business expansion, IT infrastructure and human capital with a declining expense ratio, and an increase in general loan loss provisions resulting from balance growth. “Revenue & Gains” is the sum of “Total Revenue” and “Other Gains/Losses”.
| Item (Unit: JPY bn) | FY2024 Actual | FY2025 Actual | FY2026 Plan |
|---|---|---|---|
| Revenue & Gains | 314.8 | 338.2 | 363.3 |
| Expenses | 168.4 | 177.9 | 188.6 |
| Net Credit Costs | 47.0 | 38.2 | 42.7 |
| Income before Income Taxes | 99.4 | 122.1 | 132.0 |
Shareholder Returns
Based on profit growth, the dividend per share forecast for FY2025 was revised upward from JPY34 to JPY42, and the dividend for FY2025 is JPY42 per share. The forecast dividend for FY2026 is also JPY42 per share, and the Bank states that it aims to increase the dividend per share in line with the level of net income.
Medium-Term Management Plan Progress
The Bank reports that progress against its Medium-Term Management Plan (MTMP) KPIs remains on track. The FY2024 result for income before income taxes of JPY87.7bn shown in the KPI table excludes a large one-off gain on negative goodwill of JPY11.7bn. Target assumptions include a Bank of Japan policy rate of 0.75% for fiscal year 2027 (compared with 0.50% in fiscal year 2025) and a 10-year Japanese government bond yield of 1.50%. Among the four growth driving businesses, the balance of operating assets in Corporate Business and Structured Finance rose to JPY8.0tn from JPY6.7tn, housing loan origination amounts rose to JPY890.3bn in FY2025 from JPY443.2bn in FY2024, the securities investment balance increased to JPY3.4tn, and retail deposits reached JPY8.1tn with approximately 4,336K retail accounts. ROE improved to 10.4% in FY2025 from 8.8% in FY2024, 6.0% in FY2023 and 4.5% in FY2022.
| KPI | FY2024 Results | FY2025 Results | FY2027 (Final Year of the MTMP) Targets |
|---|---|---|---|
| Income before Income Taxes | JPY 87.7bn | JPY 122.1bn | Around +50% compared to FY2024 |
| RORA (Income before Income Taxes / Risk Assets) | 0.96% | 1.23% | Around 1.15% |
| Amount of Deposits (Individual + Institutional Deposits) | JPY 14.6tn | JPY 17.3tn | JPY 18tn |
| Amounts of Operating Assets (including Securities Investment) | JPY 14.3tn | JPY 18.0tn | JPY 20tn |
| Consolidated Capital Adequacy Ratio (Basel III, Domestic Standard) | 9.33% | 9.68% | 8.5% or more |
Topics
Under the “Fourth Megabank Concept”, the Bank reports transactions with 93 of 96 regional financial institutions (including holding companies), FY2025 loan arrangement distribution to 76 banks totalling JPY538.7bn, and the adoption of a cloud-based, fully API-enabled Next-Generation banking system. In next-generation finance, SBI Shinsei Trust Bank is to act as the issuer of the Japanese yen-denominated stablecoin “JPYSC”, targeting a launch in the first quarter of FY2026, and the Bank completed a live issuance pilot for delivery-versus-payment settlement of security tokens using the tokenized deposit “DCJPY”. The Bank has decided to transfer a portion (49%) of the shares of Shinsei Trust Bank to SBI Holdings, and Shinsei Trust Bank changed its trade name to “SBI Shinsei Trust Bank” effective April 1, 2026.
This article is an analysis based on publicly available information and is not a recommendation to buy or sell any specific securities. Investment decisions are your own responsibility.
![[Obayashi] Investors’ Guide 2026 — The Complete 24-Article Breakdown](https://japan-equity.com/wp-content/uploads/2026/07/hub_cover-1024x1024.png)
![[Obayashi] IR & SR Policy — Feeding Dialogue Back into Management](https://japan-equity.com/wp-content/uploads/2026/07/p32_sq-1024x1024.jpg)
![[Obayashi] Domestic Civil Engineering — Resilience Spending Supports 9.6% Margin](https://japan-equity.com/wp-content/uploads/2026/07/p11_sq-1024x1024.jpg)
![[Obayashi] Overseas Construction — Orders Reach ¥1.2tn](https://japan-equity.com/wp-content/uploads/2026/07/p15_sq-1024x1024.jpg)
![[Obayashi] Share Price & External Ratings — vs TOPIX, ESG Index Inclusion](https://japan-equity.com/wp-content/uploads/2026/07/p40_sq-1024x1024.jpg)
![[Construction] ¥75.5tn Investment, Shrinking Workforce — Big-5 Market Share](https://japan-equity.com/wp-content/uploads/2026/07/p12_sq-1024x1024.jpg)



![[Obayashi] Capital Policy & Shareholder Returns — ROE 10%+, DOE ~5%, ¥100bn Buyback](https://japan-equity.com/wp-content/uploads/2026/07/p27_sq-1024x1024.jpg)
![[Obayashi] Reducing Cross-Shareholdings — ¥285.2bn Sold in Five Years](https://japan-equity.com/wp-content/uploads/2026/07/p29_sq-1024x1024.jpg)
![[Obayashi] ¥750bn Investment Plan — ¥300bn to Development, ¥190bn to Tech/DX](https://japan-equity.com/wp-content/uploads/2026/07/p30_sq-1024x1024.jpg)
![[Obayashi] MTP2022 KPIs — Operating Profit ~2x Target, ROE 14.4%](https://japan-equity.com/wp-content/uploads/2026/07/p25_sq-1024x1024.jpg)
![[Obayashi] Cash Allocation — ¥420bn Investment CF Over Five Years](https://japan-equity.com/wp-content/uploads/2026/07/p26_sq-1024x1024.jpg)
![[Obayashi] Green Energy — 44 Plants, 344MW, and the Green Hydrogen Challenge](https://japan-equity.com/wp-content/uploads/2026/07/p21_sq-1024x1024.jpg)
![[Obayashi] Tackling the Labor Shortage — Robotics Construction®](https://japan-equity.com/wp-content/uploads/2026/07/p14_sq-1024x1024.jpg)
