
This article is based on publicly available IR materials and is not a recommendation to buy or sell any specific securities.
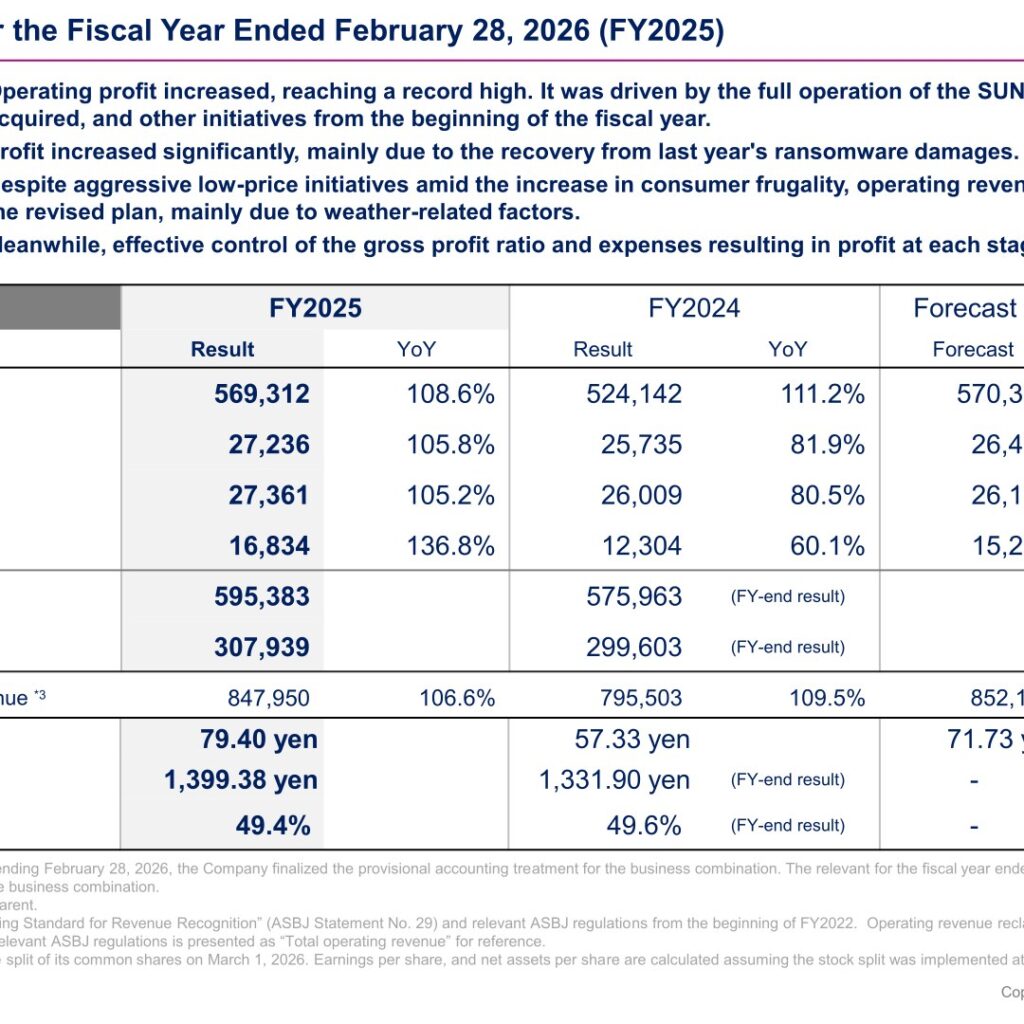
IZUMI CO., LTD. (TSE: 8273) reported consolidated results for the fiscal year ended February 28, 2026 (FY2025), with operating revenue of ¥569,312 million, equivalent to 108.6% of the previous year, and operating profit of ¥27,236 million (105.8% of the previous year), a record high. Profit attributable to owners of parent rose sharply to ¥16,834 million (136.8% of the previous year), reflecting a rebound from the previous fiscal year’s ransomware-related damages. While operating revenue came in slightly below the company’s revised plan due to weather-related factors amid heightened consumer frugality, profit at every stage exceeded the revised plan through effective control of the gross profit ratio and expenses.
Consolidated Results (Full-Year Actual)
Operating revenue increased on a rebound from the prior year’s ransomware attack, the addition of the SUNNY business and SUNLIFE through M&A, and measures addressing heightened consumer frugality. The operating gross profit margin was 39.1%, down 0.5 points year on year, while the SG&A expense ratio was 34.3%, down 0.4 points year on year. The operating profit margin fell 0.1 points year on year to 4.8%, and the ordinary profit margin declined 0.1 points to 4.8% on higher interest expenses. Profit margin rose 0.7 points to 3.0%, mainly due to a significant decrease in extraordinary losses (impairment losses of ¥7.7 billion in the previous fiscal year versus ¥1.7 billion in the fiscal year under review).
| Item (Million yen) | FY2025 Result | FY2025 YoY | FY2024 Result | FY2024 YoY |
|---|---|---|---|---|
| Operating revenue | 569,312 | 108.6% | 524,142 | 111.2% |
| Operating profit | 27,236 | 105.8% | 25,735 | 81.9% |
| Ordinary profit | 27,361 | 105.2% | 26,009 | 80.5% |
| Profit attributable to owners of parent | 16,834 | 136.8% | 12,304 | 60.1% |
| Total assets | 595,383 | – | 575,963 | – |
| Net assets | 307,939 | – | 299,603 | – |
| Earnings per share | 79.40 yen | – | 57.33 yen | – |
| Equity ratio | 49.4% | – | 49.6% | – |
Segment Results
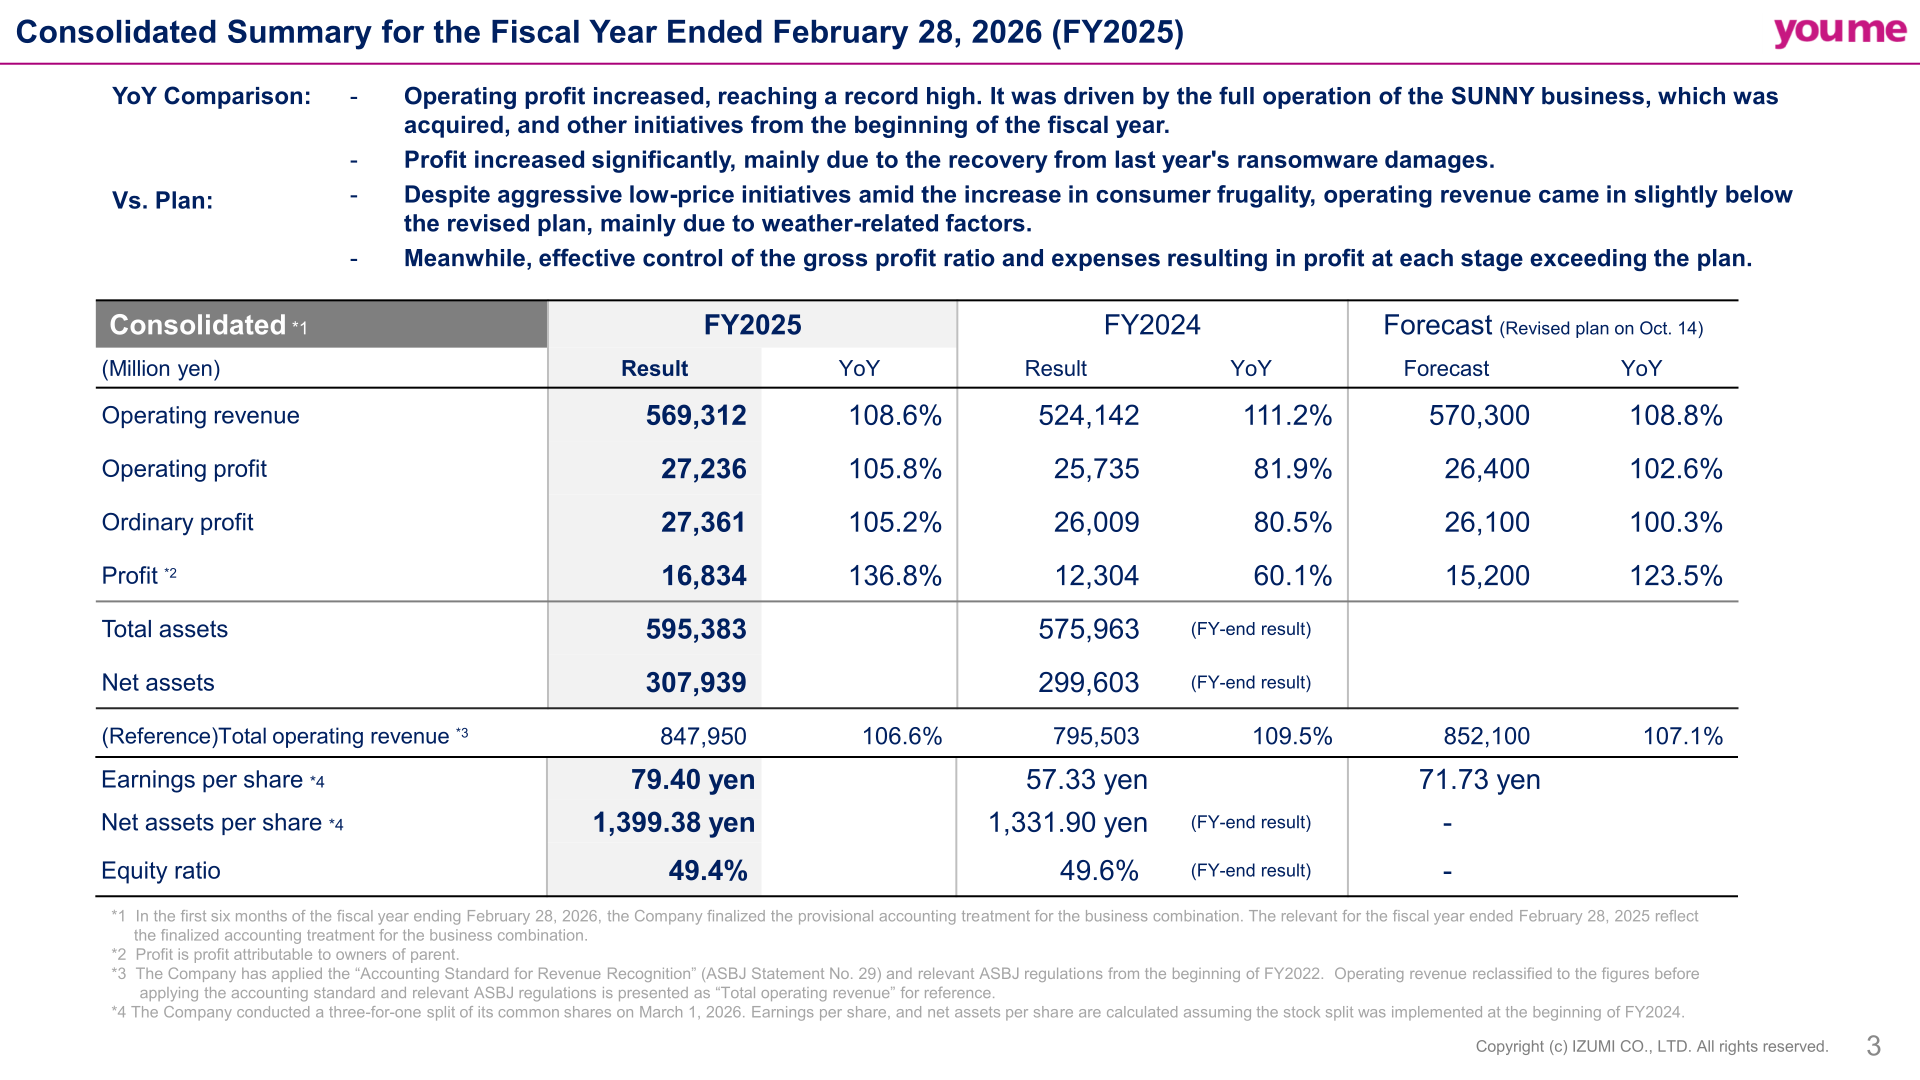
Retail operations revenue increased on a recovery in retail sales, while revenue and profit from retail-peripheral operations also rose, driven mainly by Izumi Techno. Youme Mart Kumamoto, excluding the SUNNY business, showed a recovery trend, and Youme Mart Kitakyushu opened Youme Mart Sone in September, incurring start-up costs of ¥0.14 billion. The SUNNY business completed its system migration and the rollout of the private-brand line Kurashi More in the first half; third-quarter sales were steady, though cost structure remained a challenge, with a steady improvement trend in the fourth quarter. Yours recorded strong sales of the group’s private brand Youme-Ichi and returned to operating profitability excluding new-store start-up costs (¥0.07 billion). Izumi Techno’s construction and designated-administration businesses were strong, and while Youme Card and Izumi Food Service performed well operationally, their full-year profits declined mainly due to strengthened promotions and higher personnel expenses from wage increases.
| Segment / Company | Metric | FY2025 Result | FY2025 YoY |
|---|---|---|---|
| Retail operations | Operating revenue | 551,029 | 108.7% |
| Retail operations | Operating profit | 20,782 | 104.0% |
| Retail-peripheral operations | Operating revenue | 53,922 | 112.5% |
| Retail-peripheral operations | Operating profit | 5,997 | 108.8% |
| Others and adjustments | Operating revenue | △35,640 | – |
| Others and adjustments | Operating profit | 456 | – |
| Consolidated total | Operating revenue | 569,312 | 108.6% |
| Consolidated total | Operating profit | 27,236 | 105.8% |
| Izumi (non-consolidated) | Operating revenue | 381,215 | 102.2% |
| Izumi (non-consolidated) | Operating profit | 21,471 | 101.0% |
| Youme Mart Kumamoto | Operating revenue | 108,709 | 142.3% |
| Youme Mart Kumamoto | Operating profit | 165 | 172.0% |
| Youme Mart Kitakyushu | Operating revenue | 25,391 | 103.5% |
| Youme Mart Kitakyushu | Operating profit | 237 | 145.0% |
| Yours | Operating revenue | 24,027 | 107.4% |
| Yours | Operating profit | 63 | 105.3% |
| Youme Card | Operating revenue | 8,670 | 105.6% |
| Youme Card | Operating profit | 1,400 | 98.9% |
| Izumi Techno | Operating revenue | 22,029 | 110.5% |
| Izumi Techno | Operating profit | 2,628 | 109.0% |
| Izumi Food Service | Operating revenue | 8,095 | 105.1% |
| Izumi Food Service | Operating profit | 453 | 79.7% |
FY2026 Forecast
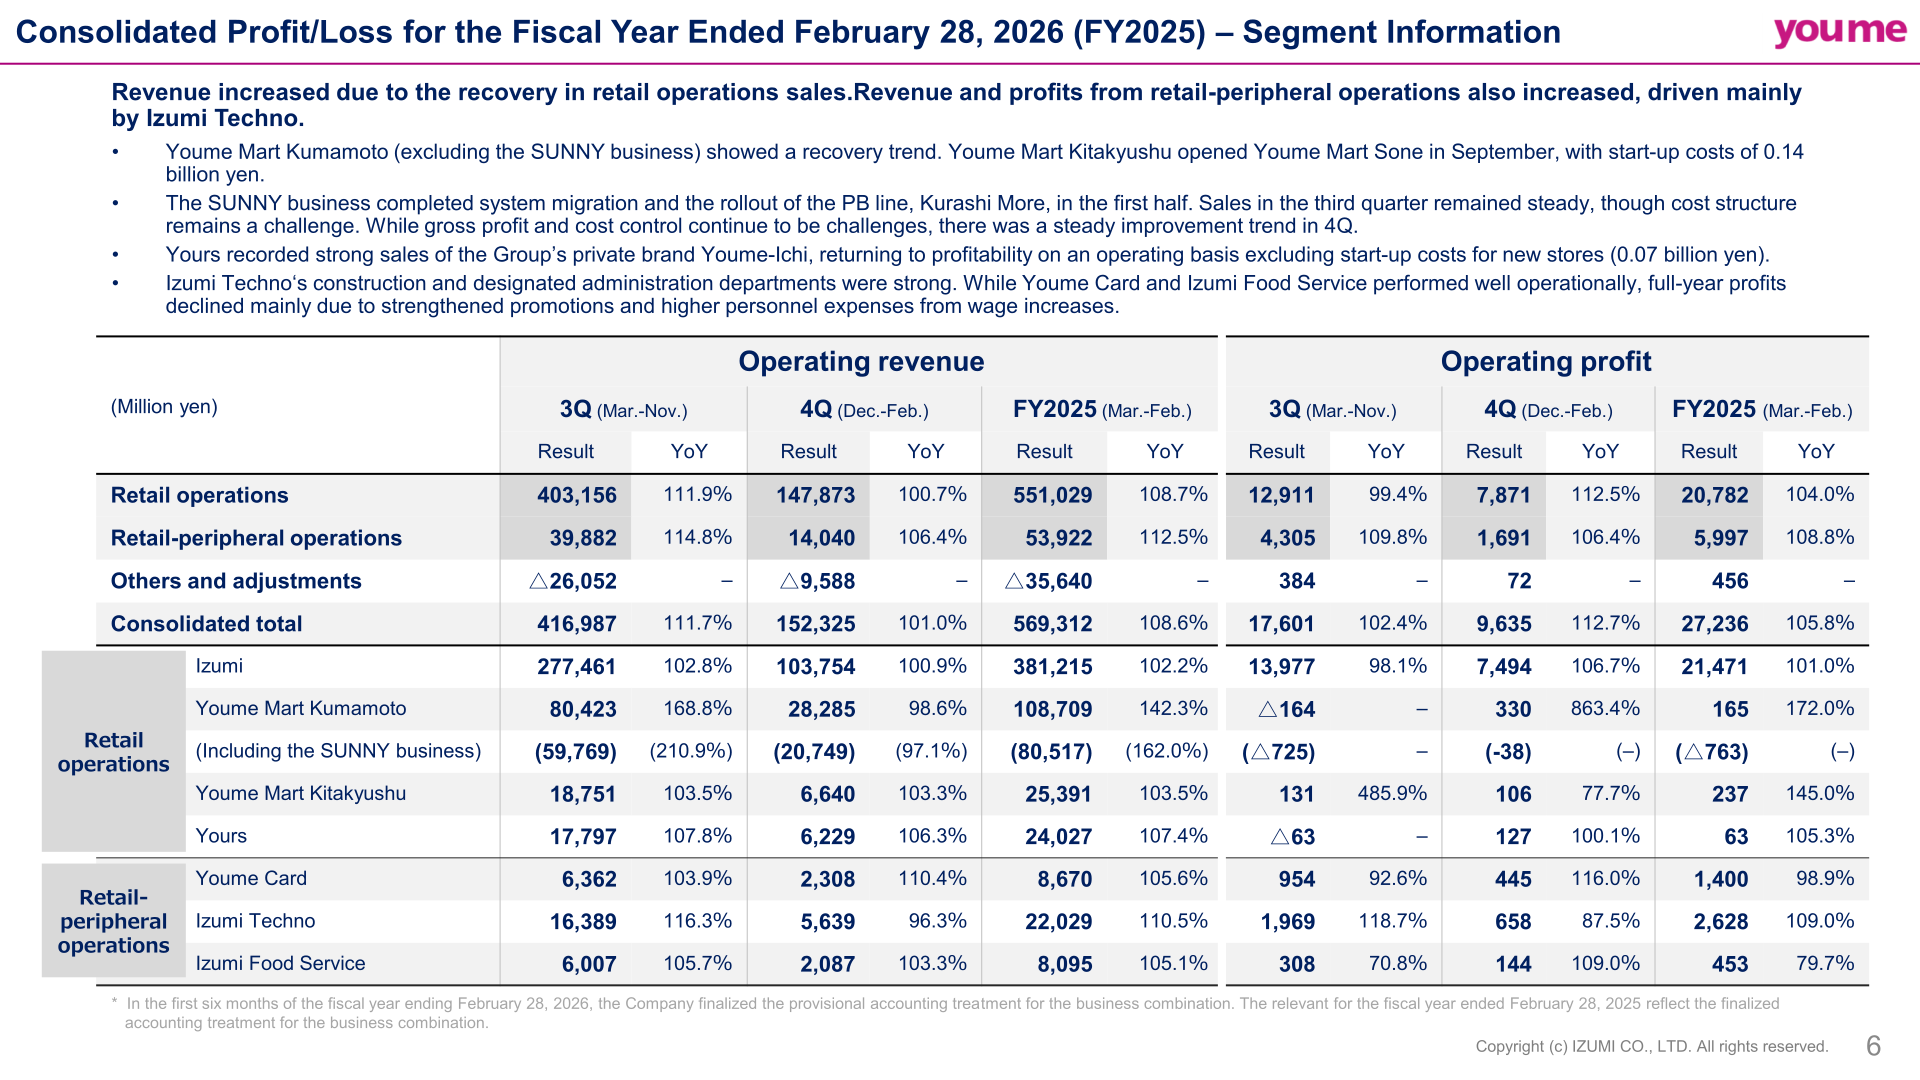
The first fiscal year of the Third Medium-Term Management Plan is positioned as the first year of structural reforms to transform Izumi’s business model toward its FY2030 targets. The company will continue initiatives addressing consumer frugality amid prolonged inflation, align product strategy with consumer behavior, and strengthen sales promotion of the private brand Youme-Ichi. For the SUNNY business, which Izumi began operating in-house in the previous fiscal year, the company will drive sales promotion and low-cost operation of the Nichiryu private brand Kurashi More and its own Youme-Ichi brand to stabilize operations, targeting a year-on-year improvement of ¥1.0 billion in operating profit. One new store is planned for the fiscal year, and the company will also operate pilot stores for a new supermarket format. Operating profit is projected to increase 6.5% to ¥29.0 billion, reflecting growth in operating gross profit (+¥5.7 billion) partly offset by higher personnel expenses (-¥1.7 billion) and increased expenses for repairs at headquarters-managed stores (-¥1.0 billion). On a non-consolidated basis, Izumi forecasts operating revenue of ¥392,800 million (103.0% of FY2025) and operating profit of ¥21,500 million (100.1% of FY2025).
| Item (Million yen, Consolidated) | FY2026 Forecast | FY2026 YoY | FY2025 Actual |
|---|---|---|---|
| Operating revenue | 587,100 | 103.1% | 569,312 |
| Operating profit | 29,000 | 106.5% | 27,236 |
| Ordinary profit | 28,400 | 103.8% | 27,361 |
| Profit attributable to owners of parent | 17,400 | 103.4% | 16,834 |
| EBITDA | 49,400 | 101.6% | 48.6 billion yen (as stated on the EBITDA waterfall slide) |
| Earnings per share | 82.82 yen | – | 79.40 yen |
Shareholder Returns
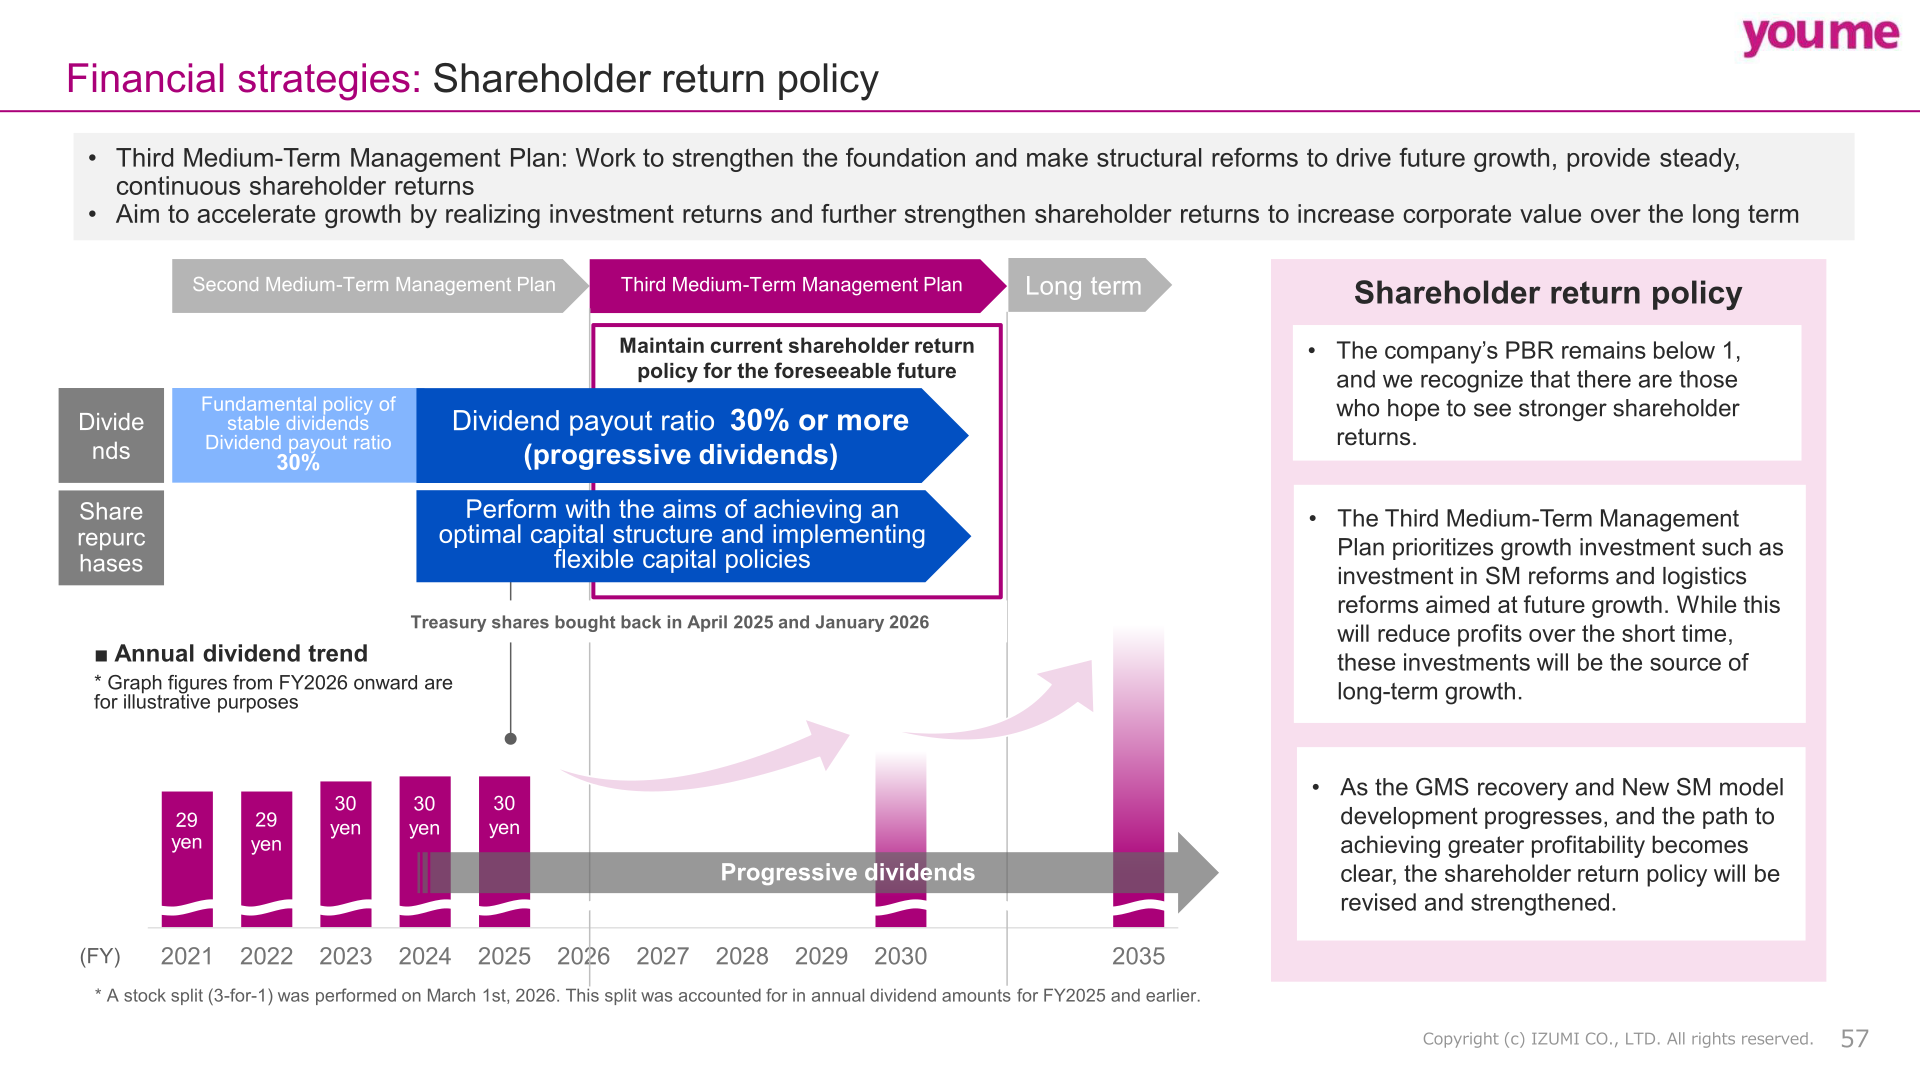
Izumi’s fundamental shareholder return policy is a dividend payout ratio of 30% or more, with progressive dividends, alongside share repurchases aimed at achieving an optimal capital structure and executing a flexible capital strategy. In April 2025 and January 2026, the company purchased treasury shares totaling ¥4.9 billion. Izumi also carried out a three-for-one stock split of its common shares with a record date of February 28, 2026, to lower the investment unit price, improve stock liquidity, and expand its individual investor base.
| Item | FY2024 | FY2025 | FY2026 Forecast |
|---|---|---|---|
| Annual dividend per share | 30 yen | 30 yen | 30.00 yen |
Note: the FY2024 and FY2025 dividend-per-share figures above are shown on a post-stock-split basis, as the annual dividend trend chart in the presentation states that dividend amounts for FY2025 and earlier were restated to reflect the three-for-one stock split effective March 1, 2026.
Medium-Term Plan / Topics
Izumi’s 2035 Long-Term Vision targets operating revenue of over ¥1 trillion (on the new revenue recognition standard), together with sustained improvement in its customer engagement score and an employee engagement score of 70 points or higher. As an intermediate step, the Third Medium-Term Management Plan (FY2026-FY2030) targets, on a “commit” basis, operating revenue of 7,000 and operating profit of 350 (both in units of 100 millions of yen as stated in the presentation), versus FY2025 results of 5,693 and 272 respectively, lifting the operating profit margin from 4.8% to 5.0%. Including the effect of M&A, the FY2030 targets rise to operating revenue of 8,000 and operating profit of 400 (100 millions of yen). The plan targets ROE of 6% or more and ROIC of 5% or more by FY2030, rising further under the Long-Term Vision to ROE of 10% or more and ROIC of 7% or more.
This article is an analysis based on publicly available information and is not a recommendation to buy or sell any specific securities. Investment decisions are your own responsibility.
















