
This article is based on publicly available IR materials and is not a recommendation to buy or sell any specific securities.
Takashimaya Co., Ltd. released its “Financial Results for the Fiscal Year Ended February 28, 2026 (FY2025)” presentation on April 14, 2026. Total operating revenue remained at the same level as FY2024 at ¥1.0 tn despite the pullback in inbound demand from FY2024, while operating profit, business profit and ordinary profit all came in at levels exceeding the forecasts. The company purchased and cancelled its Zero Coupon Convertible Bonds (CB) due 2028 to alleviate concerns about EPS dilution and enhance medium- to long-term shareholder value, and the resulting temporary extraordinary loss pushed profit attributable to owners of parent to ¥(8.2) bn. Excluding the impact of that extraordinary loss, net profit was higher than the forecast as of Oct. 2025 of ¥40.0 billion.
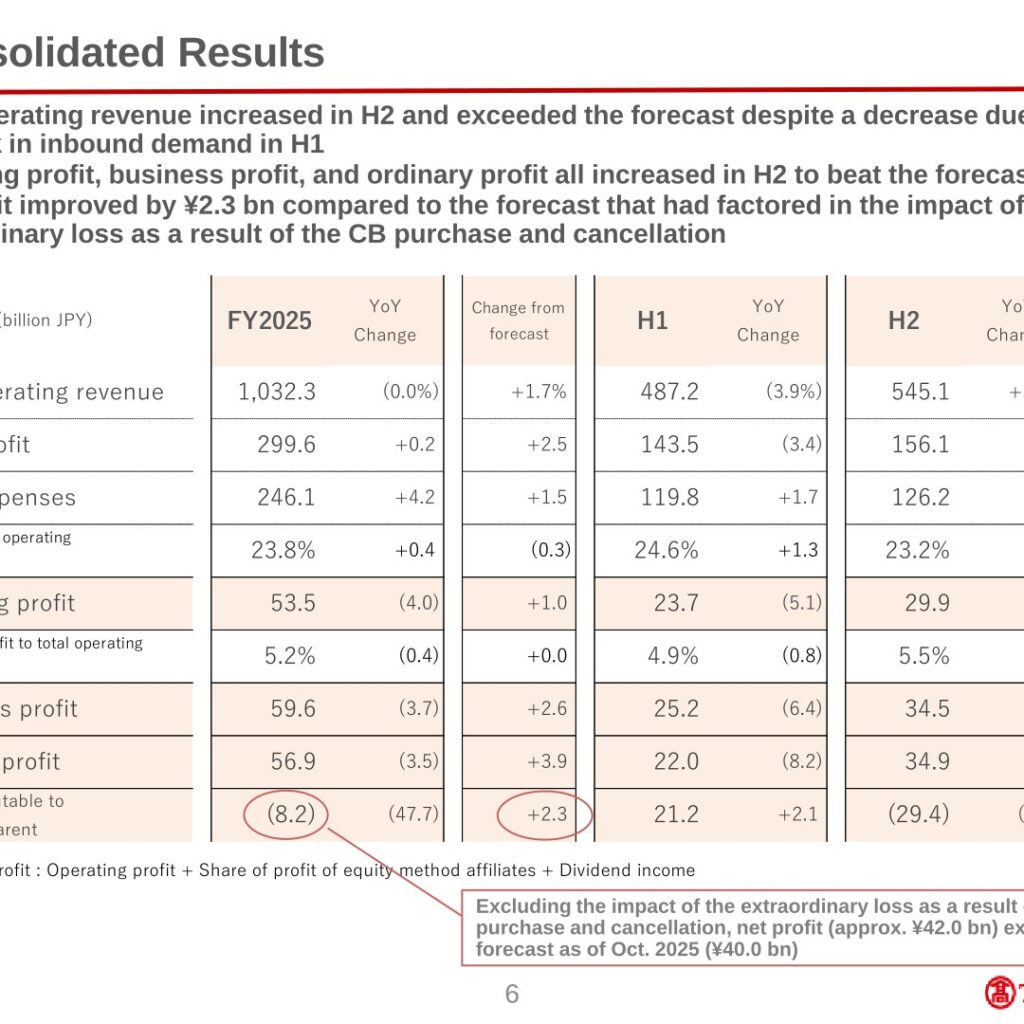
Consolidated Results (Full-Year Actual)
Total operating revenue increased in H2 and exceeded the forecast despite a decrease due to the pullback in inbound demand in H1. Operating profit, business profit and ordinary profit all increased in H2 to beat the forecasts, and net profit improved by ¥2.3 bn compared to the forecast that had factored in the impact of the extraordinary loss from the CB purchase and cancellation. From FY2025 the company introduced a profit indicator unique to Takashimaya called “business profit,” calculated as operating profit + equity in earnings of affiliates + dividend income, in order to improve the effectiveness of its ROIC management.
| Item (billion JPY) | FY2025 | YoY Change | Change from forecast | H1 | H2 |
|---|---|---|---|---|---|
| Total operating revenue | 1,032.3 | (0.0%) | +1.7% | 487.2 | 545.1 |
| Gross profit | 299.6 | +0.2 | +2.5 | 143.5 | 156.1 |
| SG&A expenses | 246.1 | +4.2 | +1.5 | 119.8 | 126.2 |
| SG&A to total operating revenue ratio | 23.8% | +0.4 | (0.3) | 24.6% | 23.2% |
| Operating profit | 53.5 | (4.0) | +1.0 | 23.7 | 29.9 |
| Operating profit to total operating revenue ratio | 5.2% | (0.4) | +0.0 | 4.9% | 5.5% |
| Business profit | 59.6 | (3.7) | +2.6 | 25.2 | 34.5 |
| Ordinary profit | 56.9 | (3.5) | +3.9 | 22.0 | 34.9 |
| Profit attributable to owners of parent | (8.2) | (47.7) | +2.3 | 21.2 | (29.4) |
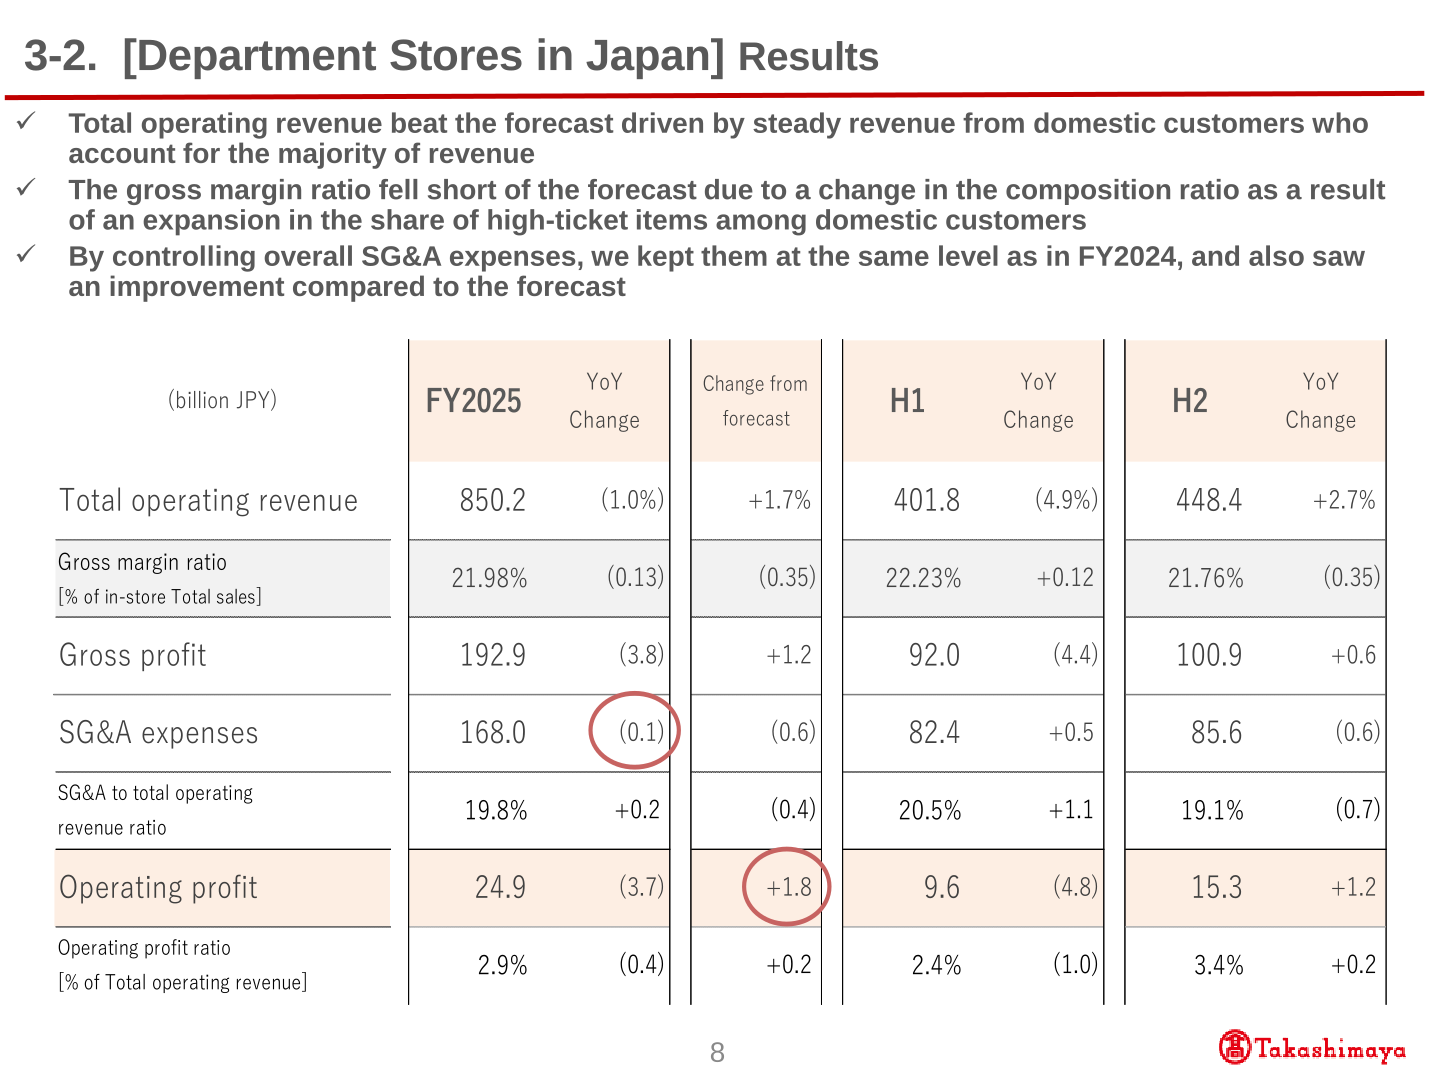
In the Department Stores in Japan segment, total operating revenue was ¥850.2 bn, down 1.0% YoY but 1.7% above the forecast, driven by steady revenue from domestic customers who account for the majority of revenue. The gross margin ratio (as a percentage of in-store total sales) was 21.98%, down 0.13 pt YoY and 0.35 pt below the forecast due to a change in the composition ratio as a result of an expansion in the share of high-ticket items among domestic customers. SG&A expenses of ¥168.0 bn were kept at the same level as in FY2024 and ¥0.6 bn below the forecast, and segment operating profit was ¥24.9 bn, down ¥3.7 bn YoY but ¥1.8 bn above the forecast. Total assets rose ¥50.2 bn to ¥1,346.2 bn as of Feb. 28, 2026, while shareholders’ equity decreased by ¥31.0 bn due to the temporary net loss, share buybacks and payment of dividends.
Segment Results
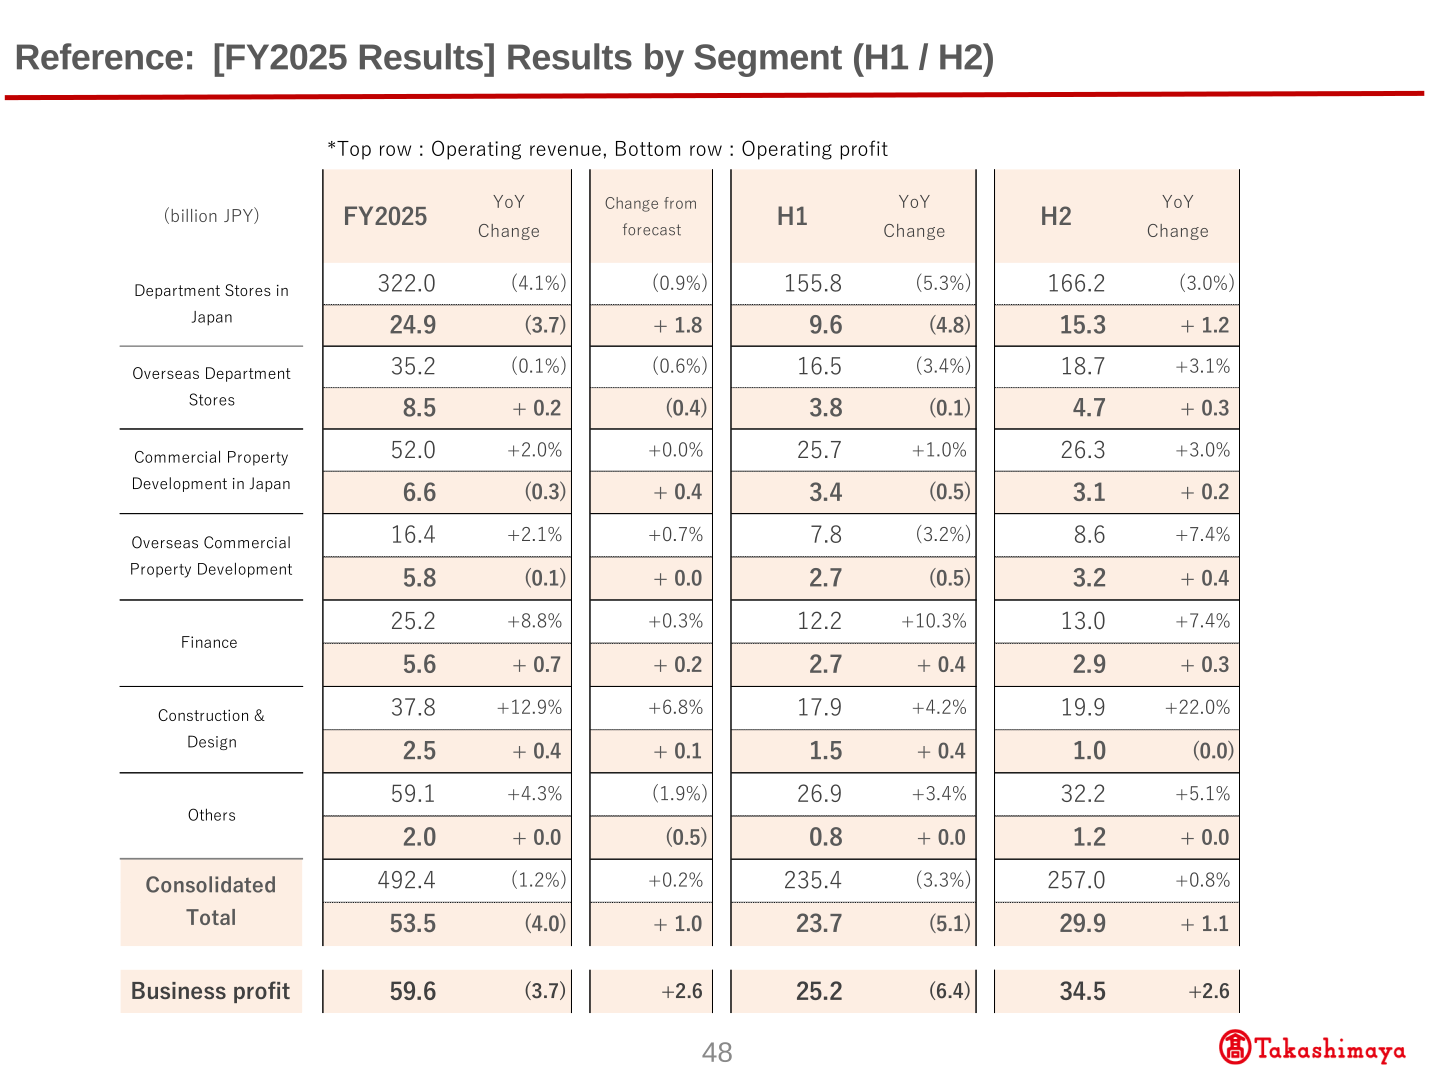
The main reason for both the ¥4.0 bn fall in operating profit and the ¥1.0 bn outperformance of the forecast was the Department Stores in Japan segment. The Commercial Property Development (in Japan / Overseas) segment is in a phase until FY2026 under the current Medium-Term Management Plan, while the Finance segment, positioned as a growth driver, is steadily growing. Within Overseas Department Stores, Takashimaya Singapore Ltd. posted operating revenue of ¥26.5 bn with operating profit of ¥7.7 bn; Shanghai Takashimaya Co., Ltd. ¥2.1 bn and ¥(0.0) bn; Takashimaya Vietnam Ltd. ¥4.2 bn and ¥1.2 bn, with revenue and profit up and accumulated losses eliminated; and Siam Takashimaya (Thailand) Co., Ltd. ¥2.4 bn and ¥(0.3) bn.
| Segment (billion JPY) | Operating revenue FY2025 | YoY Change | Operating profit FY2025 | YoY Change |
|---|---|---|---|---|
| Department Stores in Japan | 322.0 | (4.1%) | 24.9 | (3.7) |
| Overseas Department Stores | 35.2 | (0.1%) | 8.5 | + 0.2 |
| Commercial Property Development in Japan | 52.0 | +2.0% | 6.6 | (0.3) |
| Overseas Commercial Property Development | 16.4 | +2.1% | 5.8 | (0.1) |
| Finance | 25.2 | +8.8% | 5.6 | + 0.7 |
| Construction & Design | 37.8 | +12.9% | 2.5 | + 0.4 |
| Others | 59.1 | +4.3% | 2.0 | + 0.0 |
| Consolidated Total | 492.4 | (1.2%) | 53.5 | (4.0) |
| Business profit | — | — | 59.6 | (3.7) |
FY2026 Forecast
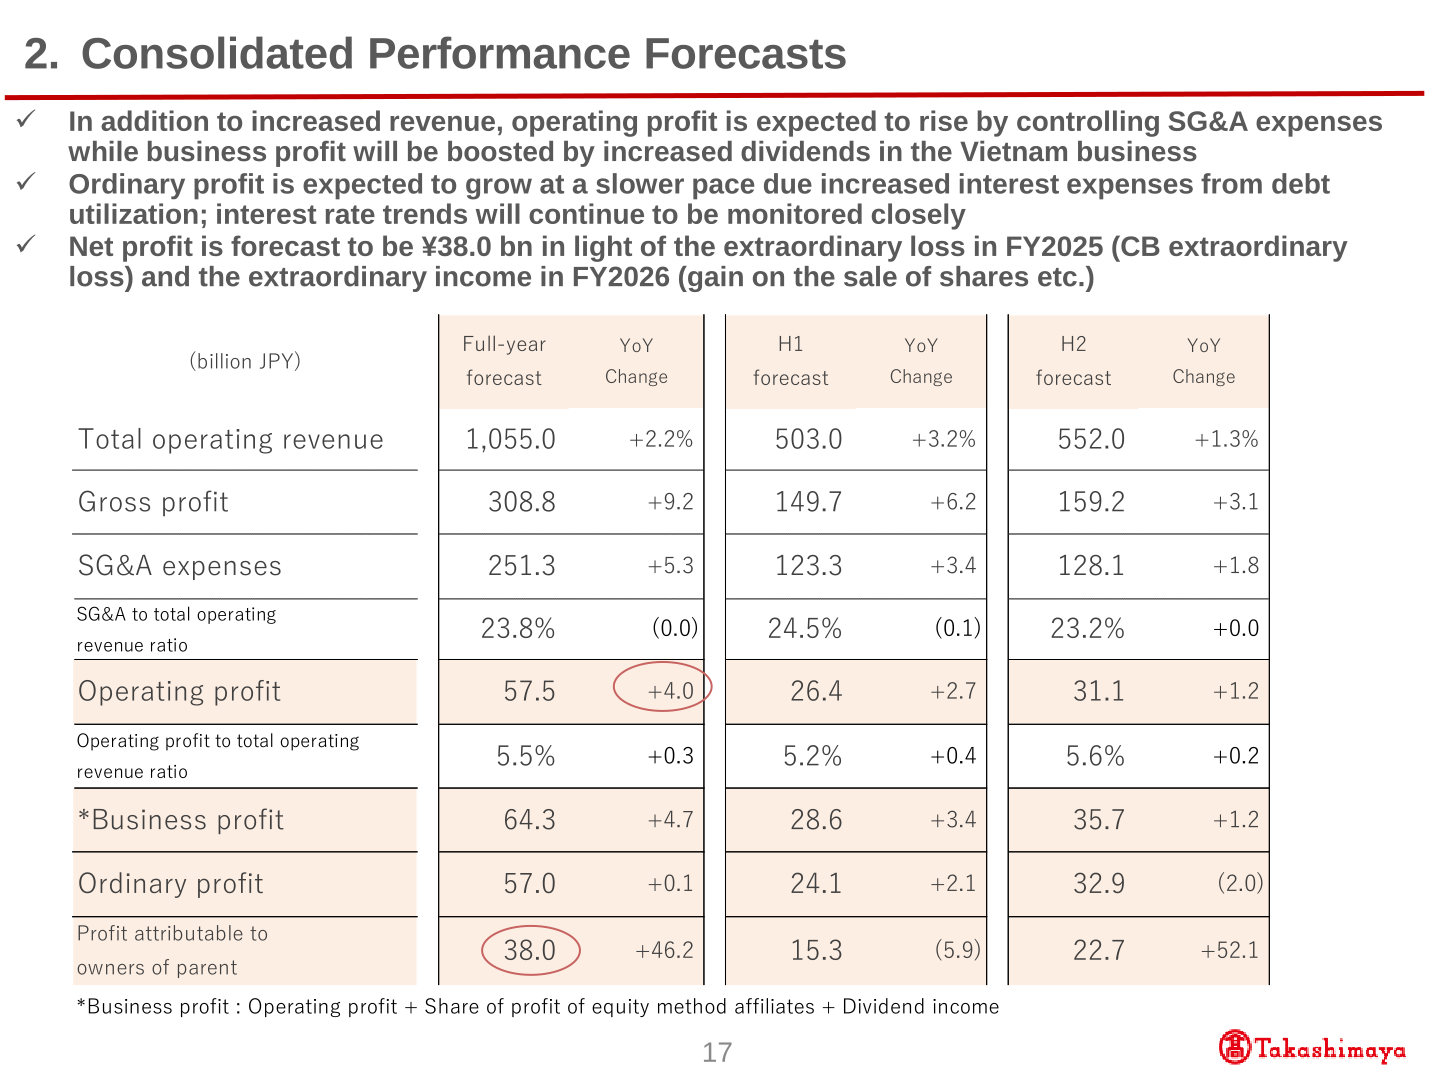
For FY2026, the final year of the current Medium-Term Management Plan, the forecast calls for an increase in total operating revenue even under an uncertain external environment. Operating profit, business profit and ordinary profit are all expected to increase, with no revision to operating profit and business profit revised upward from the levels announced in October 2025. Ordinary profit is expected to grow at a slower pace due increased interest expenses from debt utilization. Net profit is forecast to be ¥38.0 bn in light of the extraordinary loss in FY2025 (CB extraordinary loss) and the extraordinary income in FY2026 (gain on the sale of shares etc.).
| Item (billion JPY) | FY2026 Full-year forecast | YoY Change | H1 forecast | H2 forecast |
|---|---|---|---|---|
| Total operating revenue | 1,055.0 | +2.2% | 503.0 | 552.0 |
| Gross profit | 308.8 | +9.2 | 149.7 | 159.2 |
| SG&A expenses | 251.3 | +5.3 | 123.3 | 128.1 |
| SG&A to total operating revenue ratio | 23.8% | (0.0) | 24.5% | 23.2% |
| Operating profit | 57.5 | +4.0 | 26.4 | 31.1 |
| Operating profit to total operating revenue ratio | 5.5% | +0.3 | 5.2% | 5.6% |
| Business profit | 64.3 | +4.7 | 28.6 | 35.7 |
| Ordinary profit | 57.0 | +0.1 | 24.1 | 32.9 |
| Profit attributable to owners of parent | 38.0 | +46.2 | 15.3 | 22.7 |
By segment, the main reason for the ¥4.0 bn increase in operating profit is the Department Stores (in Japan / Overseas) segment. In Department Stores in Japan, total operating revenue is expected to be up 2% YoY, with revenue from domestic customers (existing stores) up 6% for the full year and revenue from inbound customers down 11% (¥84.5 bn for the full year). The Commercial Property Development (in Japan / Overseas) segment remains in the phase and is expected to contribute to revenue from FY2027 onward, while the Finance segment is expected to see sustained growth with an increase in revenue and profit.
| Segment (billion JPY) | Operating revenue FY2026 forecast | YoY Change | Operating profit FY2026 forecast | YoY Change |
|---|---|---|---|---|
| Department Stores in Japan | 328.5 | +2.0% | 27.7 | + 2.8 |
| Overseas Department Stores | 38.0 | +7.9% | 9.7 | + 1.1 |
| Commercial Property Development in Japan | 53.1 | +2.0% | 6.4 | (0.1) |
| Overseas Commercial Property Development | 18.0 | +9.7% | 6.3 | + 0.5 |
| Finance | 27.0 | +7.0% | 5.9 | + 0.3 |
| Construction & Design | 38.1 | +0.9% | 2.5 | (0.0) |
| Others | 61.0 | +3.3% | 2.2 | + 0.2 |
| Consolidated Total | 503.0 | +2.2% | 57.5 | + 4.0 |
| Business profit | — | — | 64.3 | +4.7 |
Shareholder Returns
The year-end dividend for FY2025 was ¥17 to maintain the latest forecast despite a temporary net loss (annual: ¥34). The annual dividends per share for FY2026 will increase to ¥40 for a dividend payout ratio of 30%. Under the cash allocation plan for FY2024–FY2026, shareholder returns have been strengthened with a dividend increase of ¥6.0 and share buybacks of ¥15.0 bn in FY2024, a dividend increase of ¥9.5, share buybacks of ¥15.0 bn and the CB purchase and cancellation of ¥130.0 bn in FY2025, and a dividend increase of ¥6.0 in FY2026 (after taking into consideration the 2-for-1 stock split of September 2024). Cancellation of 10 million treasury shares purchased in November 2025 — 3.3% of the total number of outstanding shares before cancellation — has been completed.
| KPI | FY2024 Results | FY2025 Results | FY2026 Forecasts |
|---|---|---|---|
| Operating Profit (bn yen) | 57.5 | 53.5 | 57.5 |
| Core operating profit (bn yen) | 63.4 | 59.6 | 64.3 |
| Net profit (bn yen) | 39.5 | -8.2 (42.0 excluding the CB impact) | 38.0 |
| ROIC (%) | 6.4 | 5.7 | 5.5 |
| ROE (%) | 8.5 | -1.8 (8.6 excluding the CB impact) | 8.3 |
| Net interest bearing debt (bn yen) | 111.1 | 202.2 | 243.4 |
| Equity ratio (%) | 36.5 | 33.4 | 33.9 |
| EPS (yen) | 126 | -27 (143 excluding the CB impact) | 130 |
| Dividend payout ratio (%) | 19.2 | -122.9 (24.0 excluding the CB impact) | 30.8 |
| DOE <Dividends on equity> (%) | 1.43 | 2.24 | 2.49 |
Medium-Term Plan and Topics
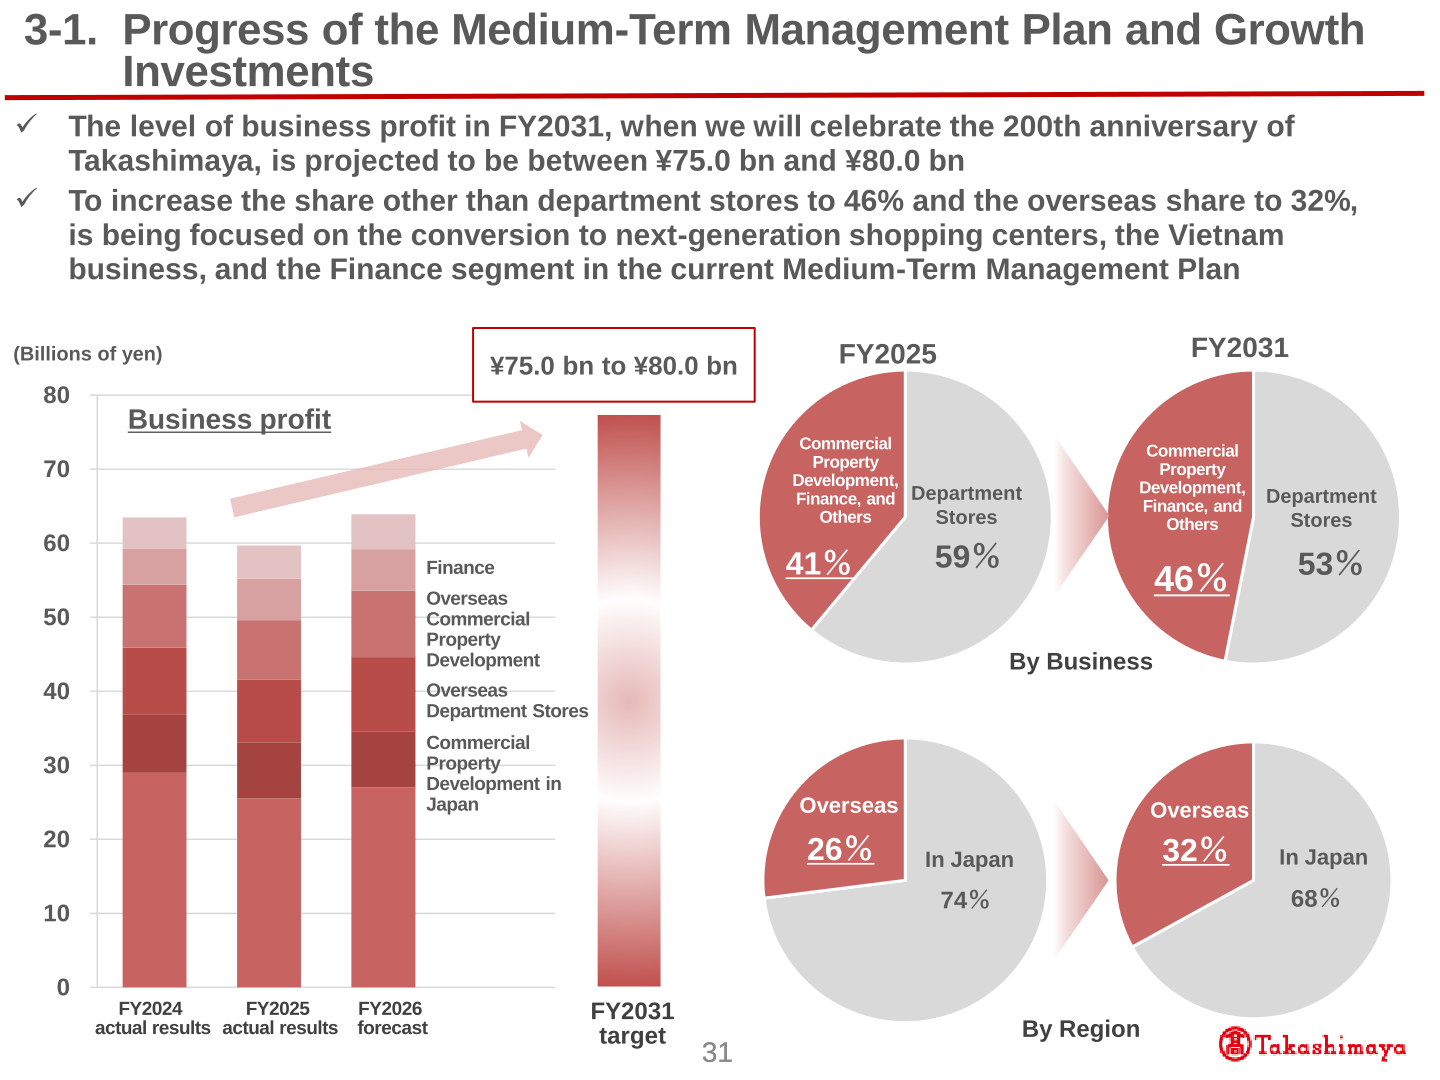
Investments in the Commercial Property Development (in Japan / Overseas) and Finance segments, which are positioned as growth drivers, and profit distribution and investments to multi-stakeholders such as human capital and ESG, are progressing as planned. In terms of cash allocation, while ensuring financial health, a shift is underway from debt reduction to utilization. The level of business profit in FY2031, when the company will celebrate the 200th anniversary of Takashimaya, is projected to be between ¥75.0 bn and ¥80.0 bn, with a target ROIC of 7.0%, a dividend payout ratio of 30% or more and progressive dividends with a DOE of 2.5% or more. Cumulative growth investment under the current Medium-Term Management Plan is allocated as ¥51.0 bn to Overseas Commercial Property Development, ¥38.0 bn to Commercial Property Development in Japan, ¥31.0 bn to Department Stores, ¥20.0 bn to Finance and ¥7.0 bn to Others.
On the CB purchase and cancellation, the target was the entire amount of the Zero Coupon Convertible Bonds due 2028 outstanding (issued face value ¥60.0 bn, maturity Dec. 6, 2028, conversion price ¥1,066.1). Purchase face value was ¥59.99 billion against a face value of ¥60.0 billion, and upon completion of the calculation period the total purchase amount was ¥131.36 billion with an extraordinary loss of ¥71.29 billion (finalized). The company also plans to transition to a company with an audit and supervisory committee, subject to approval at the General Meeting of Shareholders, to strengthen the supervisory functions of the Board of Directors.
This article is an analysis based on publicly available information and is not a recommendation to buy or sell any specific securities. Investment decisions are your own responsibility.
![[Obayashi] Investors’ Guide 2026 — The Complete 24-Article Breakdown](https://japan-equity.com/wp-content/uploads/2026/07/hub_cover-1024x1024.png)
![[Obayashi] IR & SR Policy — Feeding Dialogue Back into Management](https://japan-equity.com/wp-content/uploads/2026/07/p32_sq-1024x1024.jpg)
![[Obayashi] Real Estate Development — 18.7% Margin, ¥287.7bn Unrealized Gains](https://japan-equity.com/wp-content/uploads/2026/07/p20_sq-1024x1024.jpg)
![[Obayashi] Domestic Civil Engineering — Resilience Spending Supports 9.6% Margin](https://japan-equity.com/wp-content/uploads/2026/07/p11_sq-1024x1024.jpg)
![[Obayashi] Share Price & External Ratings — vs TOPIX, ESG Index Inclusion](https://japan-equity.com/wp-content/uploads/2026/07/p40_sq-1024x1024.jpg)
![[Construction] ¥75.5tn Investment, Shrinking Workforce — Big-5 Market Share](https://japan-equity.com/wp-content/uploads/2026/07/p12_sq-1024x1024.jpg)



![[Obayashi] Capital Policy & Shareholder Returns — ROE 10%+, DOE ~5%, ¥100bn Buyback](https://japan-equity.com/wp-content/uploads/2026/07/p27_sq-1024x1024.jpg)
![[Obayashi] Reducing Cross-Shareholdings — ¥285.2bn Sold in Five Years](https://japan-equity.com/wp-content/uploads/2026/07/p29_sq-1024x1024.jpg)
![[Obayashi] ¥750bn Investment Plan — ¥300bn to Development, ¥190bn to Tech/DX](https://japan-equity.com/wp-content/uploads/2026/07/p30_sq-1024x1024.jpg)
![[Obayashi] MTP2022 KPIs — Operating Profit ~2x Target, ROE 14.4%](https://japan-equity.com/wp-content/uploads/2026/07/p25_sq-1024x1024.jpg)
![[Obayashi] Cash Allocation — ¥420bn Investment CF Over Five Years](https://japan-equity.com/wp-content/uploads/2026/07/p26_sq-1024x1024.jpg)
![[Obayashi] Green Energy — 44 Plants, 344MW, and the Green Hydrogen Challenge](https://japan-equity.com/wp-content/uploads/2026/07/p21_sq-1024x1024.jpg)
![[Obayashi] Tackling the Labor Shortage — Robotics Construction®](https://japan-equity.com/wp-content/uploads/2026/07/p14_sq-1024x1024.jpg)
