
This article is based on publicly available IR materials and is not a recommendation to buy or sell any specific securities.
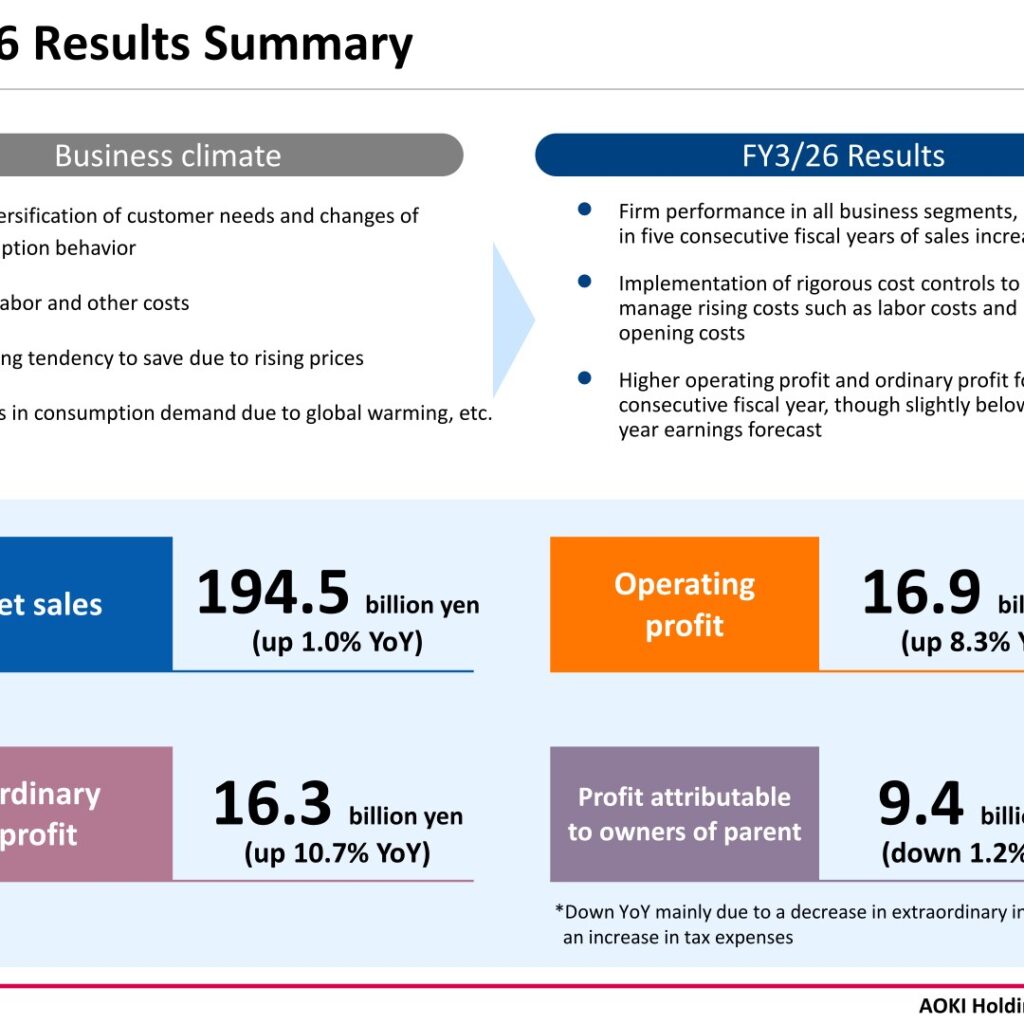
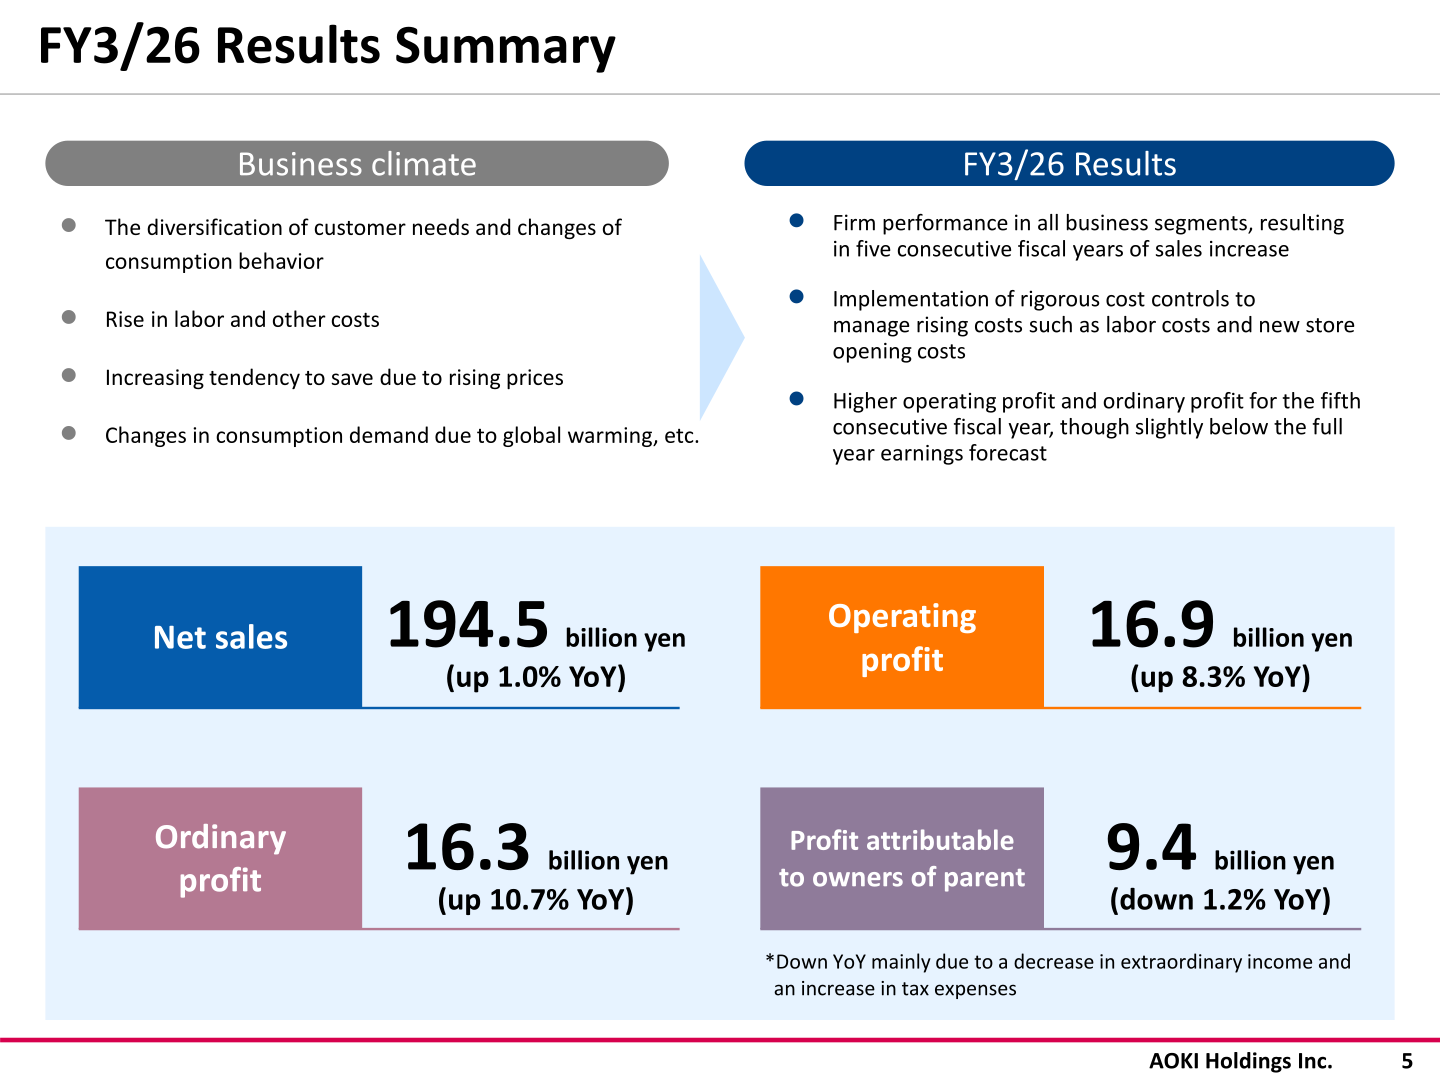
AOKI Holdings, a Japanese retail group operating the Fashion, Entertainment, and Anniversaire and Bridal businesses, reported consolidated results for the fiscal year ended March 31, 2026. Note: the company’s earnings presentation labels this fiscal year “FY3/26” throughout the main results sections, while the medium-term plan section of the same presentation labels the identical period “FY2025,” consistent with this site’s naming convention for the most recently completed fiscal year; both labels are used below as they appear in the source tables. Net sales rose 1.0% year on year to 194.5 billion yen, marking five consecutive fiscal years of sales growth. Operating profit increased 8.3% to 16.9 billion yen and ordinary profit rose 10.7% to 16.3 billion yen, both up for a fifth straight year, while profit attributable to owners of parent decreased 1.2% to 9.4 billion yen, mainly due to a decrease in extraordinary income and an increase in tax expenses. For the fiscal year ending March 31, 2027 (FY3/27), the company forecasts record-high net sales of 200.0 billion yen and a sixth consecutive year of higher operating and ordinary profit.
Consolidated Results (FY3/26 Actual)
The table below summarizes AOKI Holdings’ consolidated results for FY3/26 compared with FY3/25, as reported in the company’s earnings presentation.
| Item | FY3/25 | FY3/26 | YoY Change | YoY % |
|---|---|---|---|---|
| Net Sales | 192,688 | 194,532 | 1,843 | 101.0 |
| Gross profit (Gross margin) | 80,690 (41.9%) | 82,881 (42.6%) | 2,191 (+0.7pt) | 102.7 |
| Selling, general and administrative expenses | 65,043 | 65,933 | 889 | 101.4 |
| Operating profit (Operating margin) | 15,646 (8.1%) | 16,947 (8.7%) | 1,301 (+0.6pt) | 108.3 |
| Non-operating profit | 271 | 235 | -35 | 86.8 |
| Non-operating expenses | 1,135 | 813 | -322 | 71.6 |
| Ordinary profit | 14,782 | 16,370 | 1,587 | 110.7 |
| Extraordinary income | 905 | 318 | -586 | 35.2 |
| Extraordinary losses | 1,743 | 1,713 | -30 | 98.3 |
| Profit attributable to owners of parent | 9,574 | 9,461 | -113 | 98.8 |
| Net income per share (yen) | 113.89 | 112.45 | -1.44 | – |
Segment Results
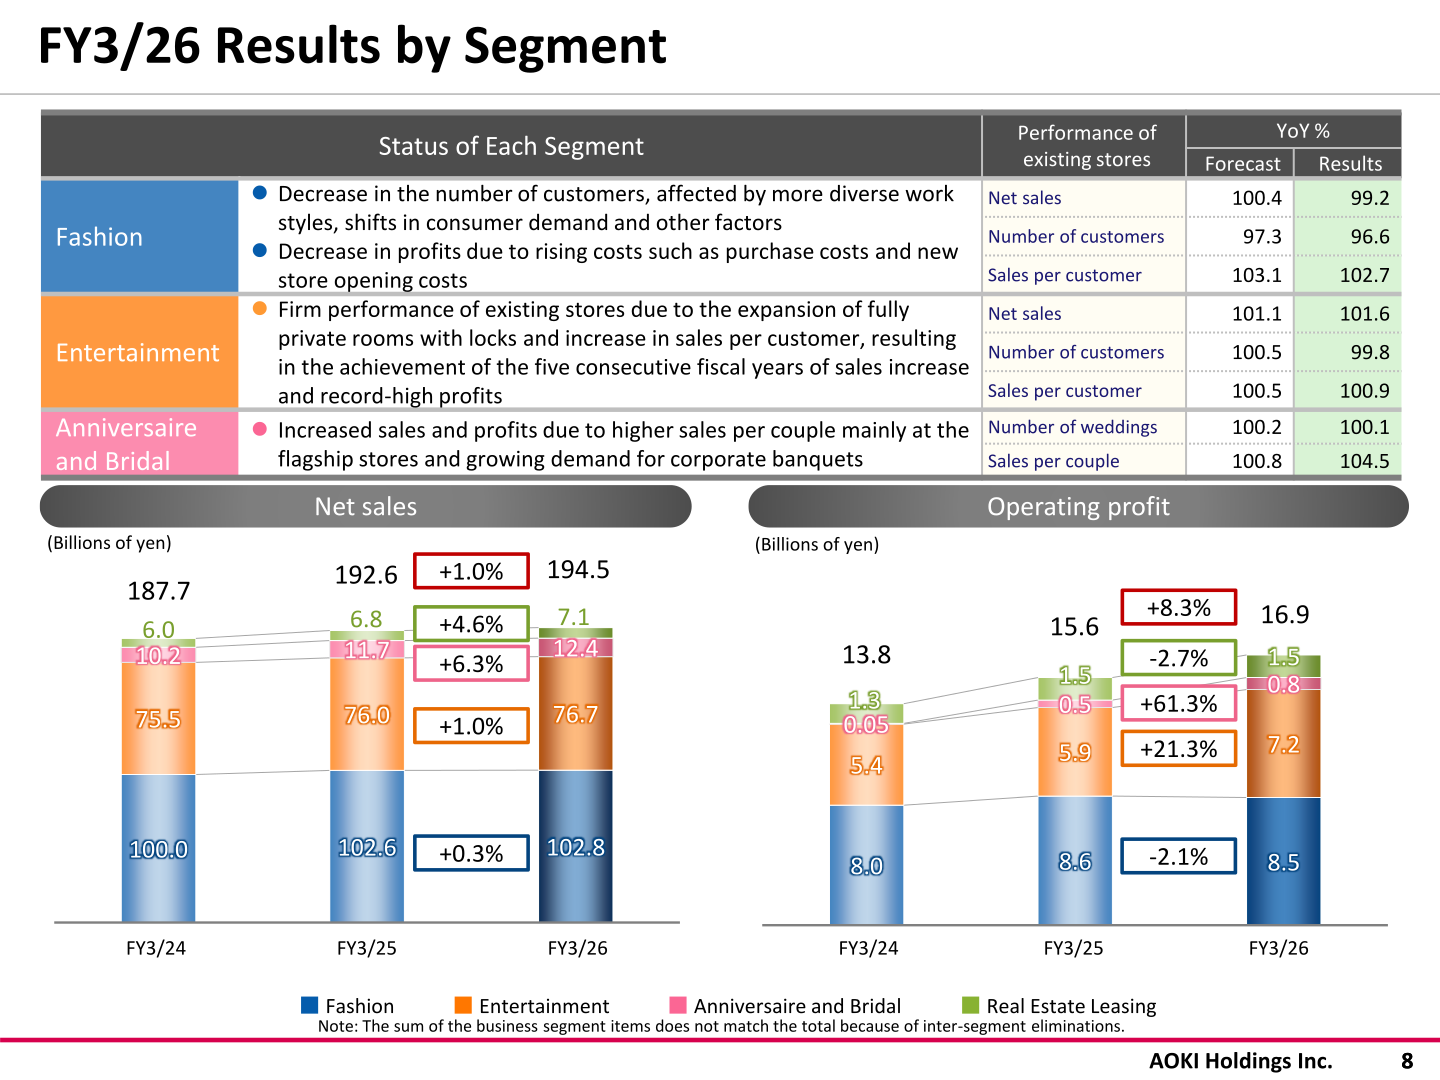
AOKI Holdings operates three core business segments — Fashion, Entertainment, and Anniversaire and Bridal — plus a Real Estate Leasing segment. All segments contributed to the fifth consecutive year of sales growth; the sum of segment figures does not equal the consolidated total because of inter-segment eliminations.
| Segment | Metric | FY3/25 | FY3/26 | YoY Change | YoY % |
|---|---|---|---|---|---|
| Fashion | Net sales | 102,621 | 102,894 | 272 | 100.3 |
| Entertainment | Net sales | 76,040 | 76,783 | 743 | 101.0 |
| Anniversaire and Bridal | Net sales | 11,713 | 12,448 | 735 | 106.3 |
| Real Estate Leasing | Net sales | 6,877 | 7,195 | 318 | 104.6 |
| Fashion | Operating profit | 8,690 | 8,508 | -181 | 97.9 |
| Entertainment | Operating profit | 5,991 | 7,267 | 1,275 | 121.3 |
| Anniversaire and Bridal | Operating profit | 541 | 874 | 332 | 161.3 |
| Real Estate Leasing | Operating profit | 1,587 | 1,544 | -42 | 97.3 |
FY2026 (FY3/27) Forecast
For FY3/27, AOKI Holdings forecasts continued growth across the business, supported by planned new store openings, renovations, and rigorous cost controls to manage rising costs.
| Item | FY3/26 | FY3/27 Forecast | YoY Change | YoY % |
|---|---|---|---|---|
| Net Sales | 194,532 | 200,000 | 5,467 | 102.8 |
| Gross profit (Gross margin) | 82,881 (42.6%) | 87,000 (43.5%) | 4,118 (+0.9pt) | 105.0 |
| Selling, general and administrative expenses | 65,933 | 69,000 | 3,066 | 104.7 |
| Operating profit (Operating margin) | 16,947 (8.7%) | 18,000 (9.0%) | 1,052 (+0.3%) | 106.2 |
| Non-operating profit | 235 | 300 | 64 | 127.4 |
| Non-operating expenses | 813 | 800 | -13 | 98.4 |
| Ordinary profit | 16,370 | 17,500 | 1,129 | 106.9 |
| Extraordinary income | 318 | – | -318 | – |
| Extraordinary losses | 1,713 | 1,700 | -13 | 99.2 |
| Profit attributable to owners of parent | 9,461 | 10,000 | 538 | 105.7 |
| Net income per share (yen) | 112.45 | 118.82 | 6.37 | – |
Shareholder Returns
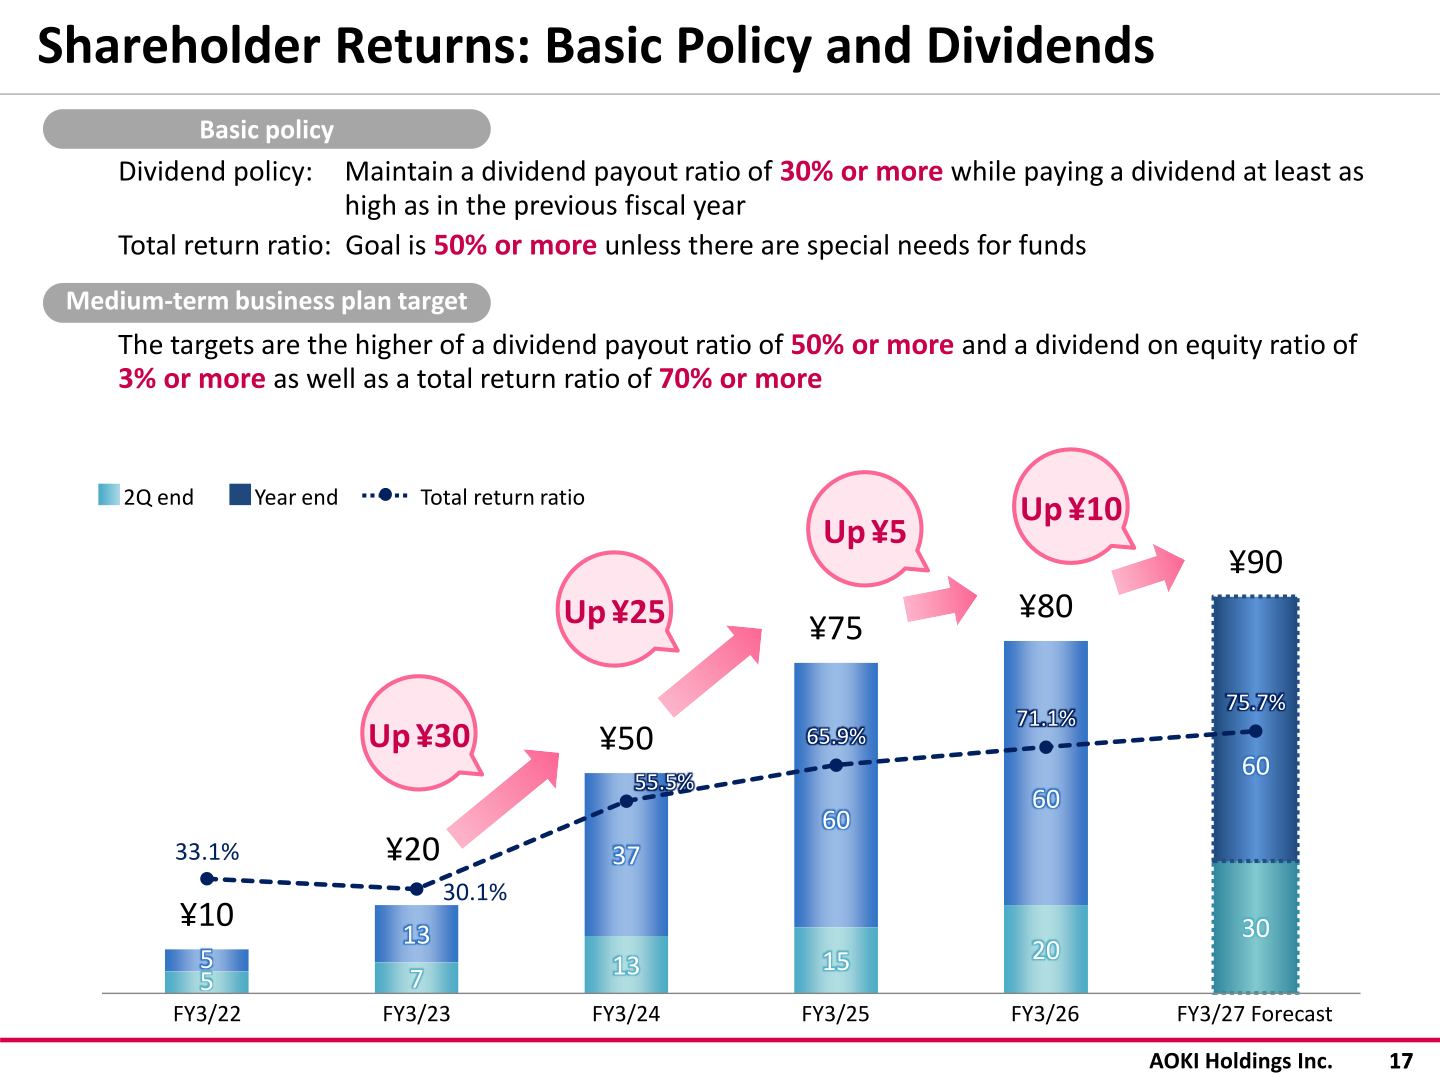
AOKI Holdings’ basic dividend policy is to maintain a payout ratio of 30% or more while paying a dividend at least as high as in the previous fiscal year, with a total return ratio goal of 50% or more unless there are special needs for funds. Under the RISING2026 medium-term plan target, the goal is the higher of a dividend payout ratio of 50% or more or a dividend on equity ratio of 3% or more, together with a total return ratio of 70% or more. The annual dividend per share has increased every year, from 10 yen in FY3/22 to a forecast 90 yen in FY3/27, and the total return ratio has risen from 33.1% in FY3/22 to a forecast 75.7% in FY3/27.
| Item | FY3/22 | FY3/23 | FY3/24 | FY3/25 | FY3/26 | FY3/27 Forecast |
|---|---|---|---|---|---|---|
| Interim (2Q-end) dividend per share (yen) | 5 | 7 | 13 | 15 | 20 | 30 |
| Year-end dividend per share (yen) | 5 | 13 | 37 | 60 | 60 | 60 |
| Annual dividend per share (yen) | 10 | 20 | 50 | 75 | 80 | 90 |
| Total return ratio | 33.1% | 30.1% | 55.5% | 65.9% | 71.1% | 75.7% |
Medium-Term Plan / Topics
AOKI Holdings is in the final year of its three-year medium-term management plan “RISING2026,” covering the period through March 2027. The company stated that FY2025 (FY3/26) sales were mostly consistent with the initial plan and operating profit was slightly higher, that ROE declined slightly while ROIC and stock price valuation increased, and that it expects progress in FY2026 (FY3/27), the plan’s final year, in line with its targets.
| Item | FY2023 results | FY2024 results | FY2025 results | FY2026 plan | FY2026 target |
|---|---|---|---|---|---|
| Net sales | 187.7 billion yen | 192.6 billion yen | 194.5 billion yen | 200.0 billion yen | 200.0 billion yen |
| Operating profit | 13.8 billion yen | 15.6 billion yen | 16.9 billion yen | 18.0 billion yen | 18.0 billion yen |
| Operating margin | 7.4% | 8.1% | 8.7% | 9.0% | 9.0% |
| ROIC (Return on invested capital) | 5.2% | 6.0% | 6.6% | – | 6.7% |
| ROE (Return on equity) | 5.6% | 6.9% | 6.6% | – | 7.0% |
| EPS (yen) | 90.00 | 113.89 | 112.45 | – | 120.00 |
| PBR (Price book-value ratio) | 0.7x | 0.8x | 0.9x | – | 1.0x |
| Group overall store numbers (directly managed stores) | 1,334 | 1,332 | 1,348 | 1,382 | 1,434 |
This article is an analysis based on publicly available information and is not a recommendation to buy or sell any specific securities. Investment decisions are your own responsibility.
















