
This article is based on publicly available IR materials and is not a recommendation to buy or sell any specific securities.
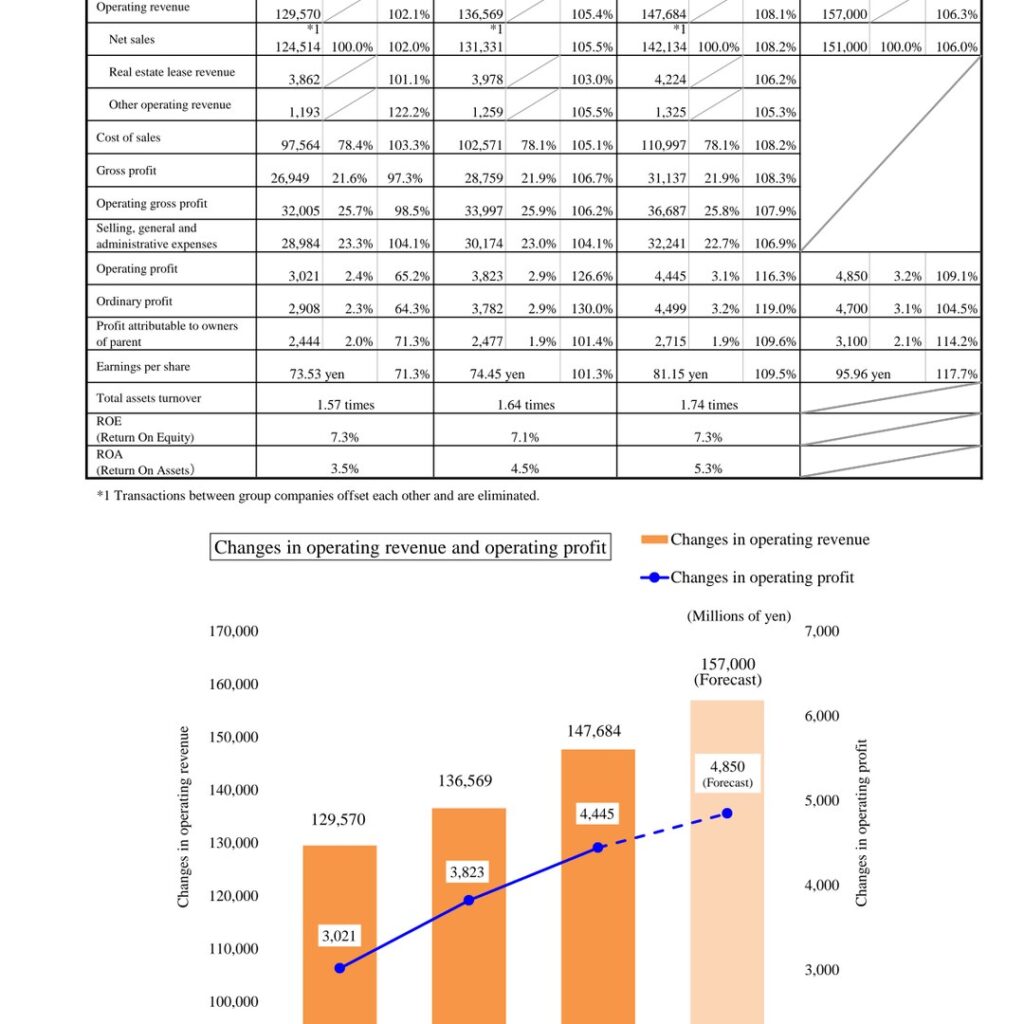
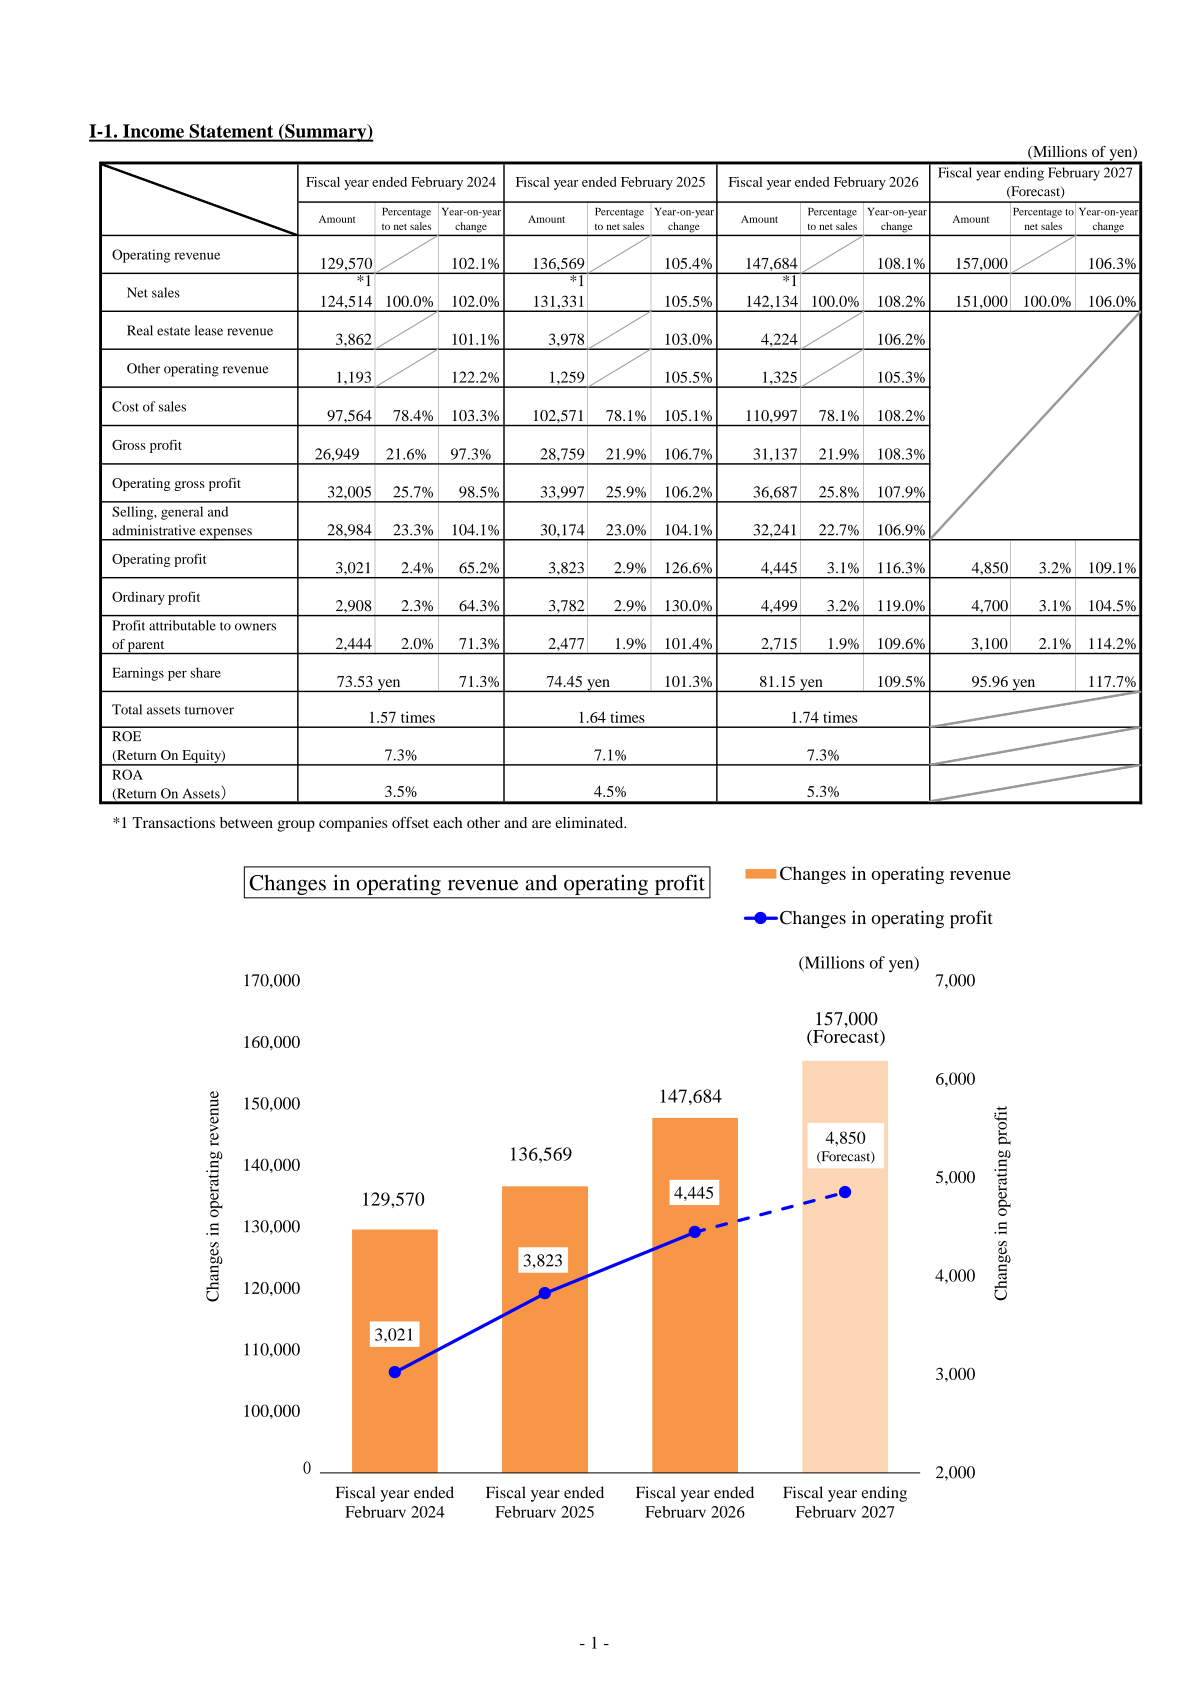
Mr Max Holdings Ltd. reported consolidated operating revenue of 147,684 million yen for the fiscal year ended February 28, 2026, a year-on-year change of 108.1% (i.e., 108.1% of the prior year’s level). Operating profit was 4,445 million yen (116.3% of the prior year) and ordinary profit was 4,499 million yen (119.0% of the prior year), marking a second consecutive year of growth in both metrics. Profit attributable to owners of parent was 2,715 million yen (109.6% of the prior year). For the fiscal year ending February 28, 2027, the company forecasts operating revenue of 157,000 million yen and operating profit of 4,850 million yen.
Note: Mr Max Holdings’ fiscal year runs from March to the following February; in line with japan-equity.com’s convention, this article refers to the fiscal year ended February 28, 2026 as FY2025. Tables below retain the company’s own period labels as printed in the source material. The source document prints earnings per share for the fiscal year ended February 28, 2026 as 81.15 yen (109.5% of the prior year). This figure appears inconsistent with other numbers on the same line: the prior-year EPS of 74.45 yen at a 109.5% year-on-year change, and the FY2027 forecast EPS of 95.96 yen shown as 117.7% of this same line, would each work out to approximately 81.51 yen rather than 81.15 yen. This article reports the figure as printed in the source (81.15 yen) and flags the apparent inconsistency here for the reader’s awareness.
Consolidated Results (Full-Year Actual)
Operating revenue reached 147,684 million yen, comprising net sales of 142,134 million yen along with real estate lease revenue and other operating revenue. Gross profit was 31,137 million yen (108.3% of the prior year), and operating gross profit was 36,687 million yen (107.9% of the prior year). Selling, general and administrative expenses were 32,241 million yen (106.9% of the prior year) — a slower rate of increase than gross profit, which underpinned the increase in operating profit.
| Item | Fiscal year ended Feb 2026 (¥M) | Fiscal year ended Feb 2025 (¥M) | YoY Change |
|---|---|---|---|
| Operating revenue | 147,684 | 136,569 | 108.1% |
| Net sales | 142,134 | 131,331 | 108.2% |
| Cost of sales | 110,997 | 102,571 | 108.2% |
| Gross profit | 31,137 | 28,759 | 108.3% |
| SG&A expenses | 32,241 | 30,174 | 106.9% |
| Operating profit | 4,445 | 3,823 | 116.3% |
| Ordinary profit | 4,499 | 3,782 | 119.0% |
| Profit attributable to owners of parent | 2,715 | 2,477 | 109.6% |
| Earnings per share (yen) | 81.15* | 74.45 | 109.5% |
* As printed in the source document; the YoY change and prior-year/forecast figures on this line appear inconsistent with this value — see the note above.
| Item | February 28, 2026 | February 28, 2025 | YoY Change |
|---|---|---|---|
| Total assets (¥M) | 86,745 | 83,199 | 104.3% |
| Net assets (¥M) | 38,374 | 36,058 | 106.4% |
| Total equity ratio | 44.2% | 43.3% | — |
| D/E ratio | 0.58 times | 0.55 times | — |
| Net assets per share (yen) | 1,151.52 | 1,083.21 | — |
| ROE (Return on Equity) | 7.3% | 7.1% | — |
| ROA (Return on Assets) | 5.3% | 4.5% | — |
Segment Results
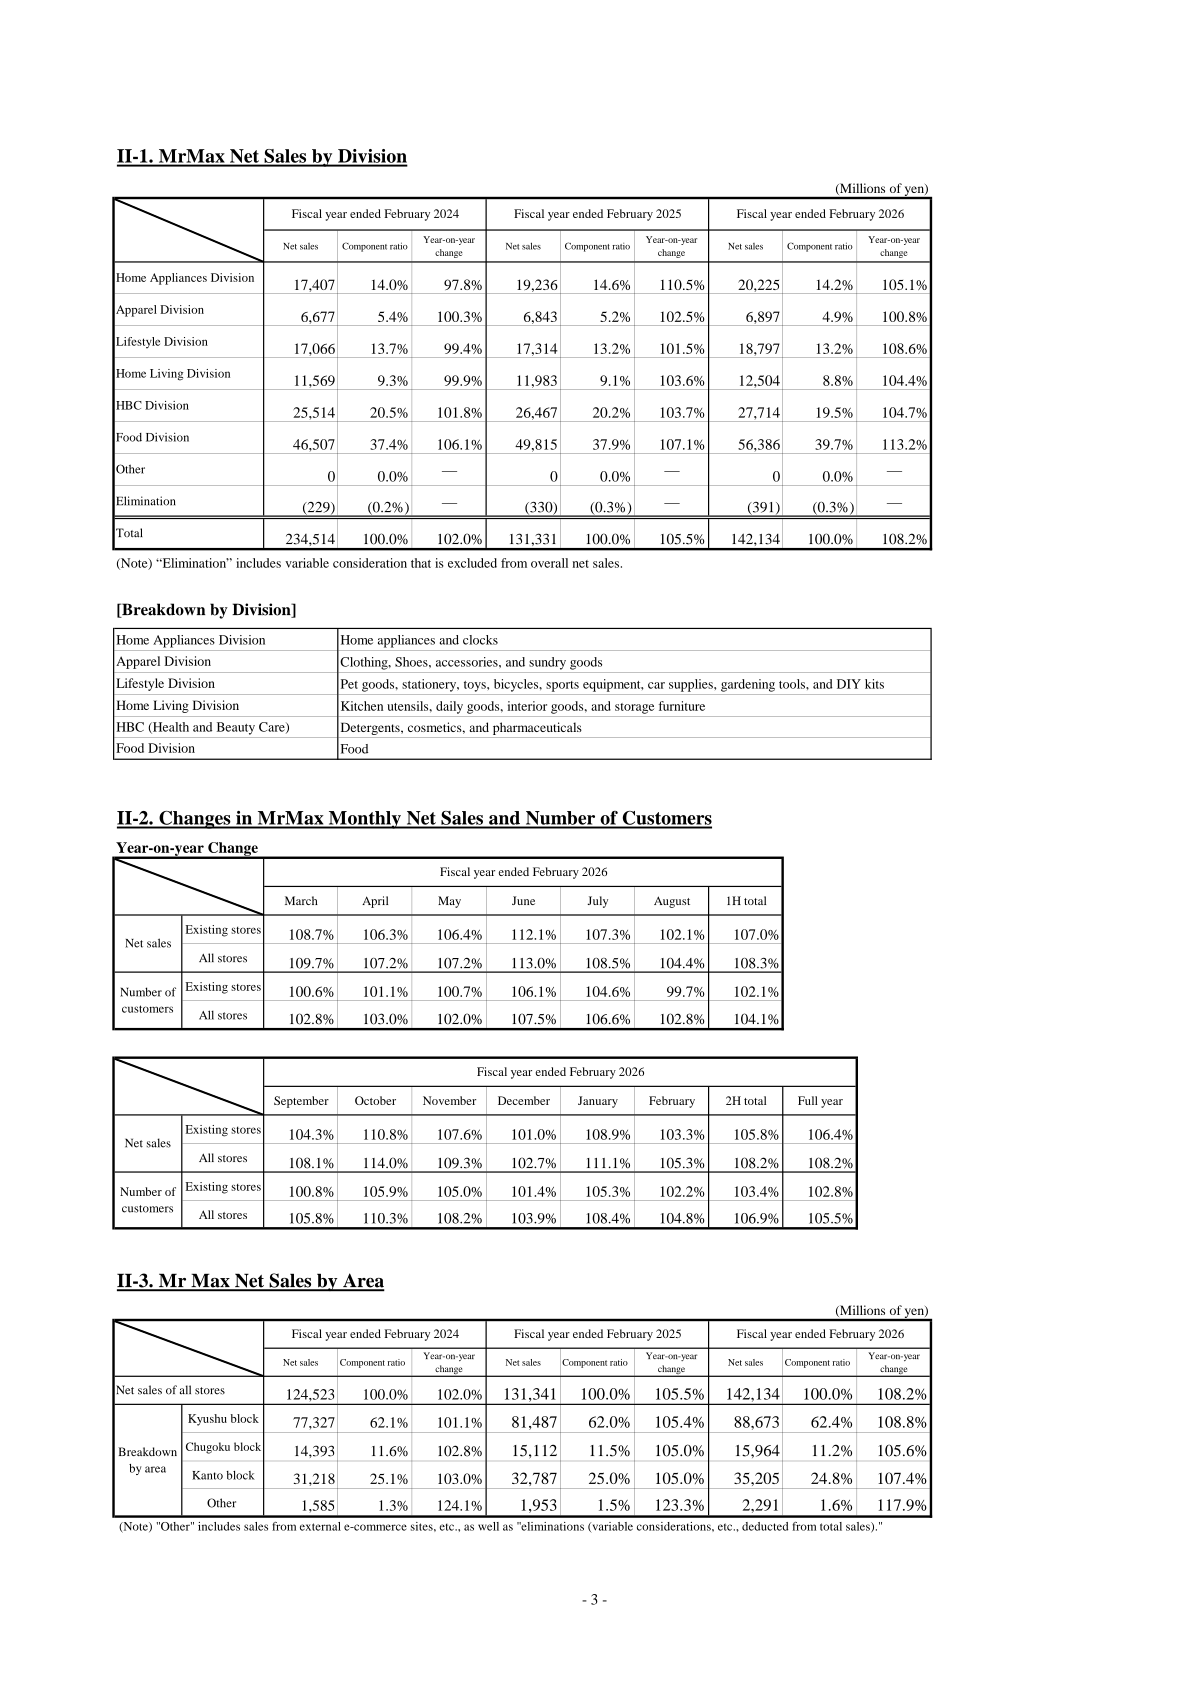
By division, the Food Division remained the largest contributor to net sales at 56,386 million yen (39.7% of net sales; 113.2% of the prior year), followed by the HBC (Health and Beauty Care) Division at 27,714 million yen (19.5%; 104.7% of the prior year) and the Lifestyle Division at 18,797 million yen (13.2%; 108.6% of the prior year). All divisions posted a year-on-year increase.
| Division | Fiscal year ended Feb 2026 (¥M) | Component Ratio | YoY Change | Fiscal year ended Feb 2025 (¥M) |
|---|---|---|---|---|
| Home Appliances Division | 20,225 | 14.2% | 105.1% | 19,236 |
| Apparel Division | 6,897 | 4.9% | 100.8% | 6,843 |
| Lifestyle Division | 18,797 | 13.2% | 108.6% | 17,314 |
| Home Living Division | 12,504 | 8.8% | 104.4% | 11,983 |
| HBC Division | 27,714 | 19.5% | 104.7% | 26,467 |
| Food Division | 56,386 | 39.7% | 113.2% | 49,815 |
| Elimination | (391) | (0.3%) | — | (330) |
| Total net sales | 142,134 | 100.0% | 108.2% | 131,331 |
Store Network and Private Brand
The number of MrMax stores at the end of the fiscal year rose to 59 (two openings and no closures during the period), from 57 a year earlier. Total sales floor area increased to 328,090 square meters. Net sales of MrMax private brand products were 31,571 million yen (114.7% of the prior year), representing 22.2% of net sales, with a gross profit margin of 26.6%.
| Item | Fiscal year ended Feb 2026 | Fiscal year ended Feb 2025 |
|---|---|---|
| Number of stores at end of term | 59 | 57 |
| Store openings during the period | 2 | 1 |
| Store closures during the period | 0 | 0 |
| Area of sales floors (sq. m) | 328,090 | 326,095 |
| Private brand net sales (¥M) | 31,571 | 27,529 |
| Private brand net sales, % of net sales | 22.2% | 20.9% |
| Private brand gross profit margin | 26.6% | 26.4% |
FY2026 Forecast
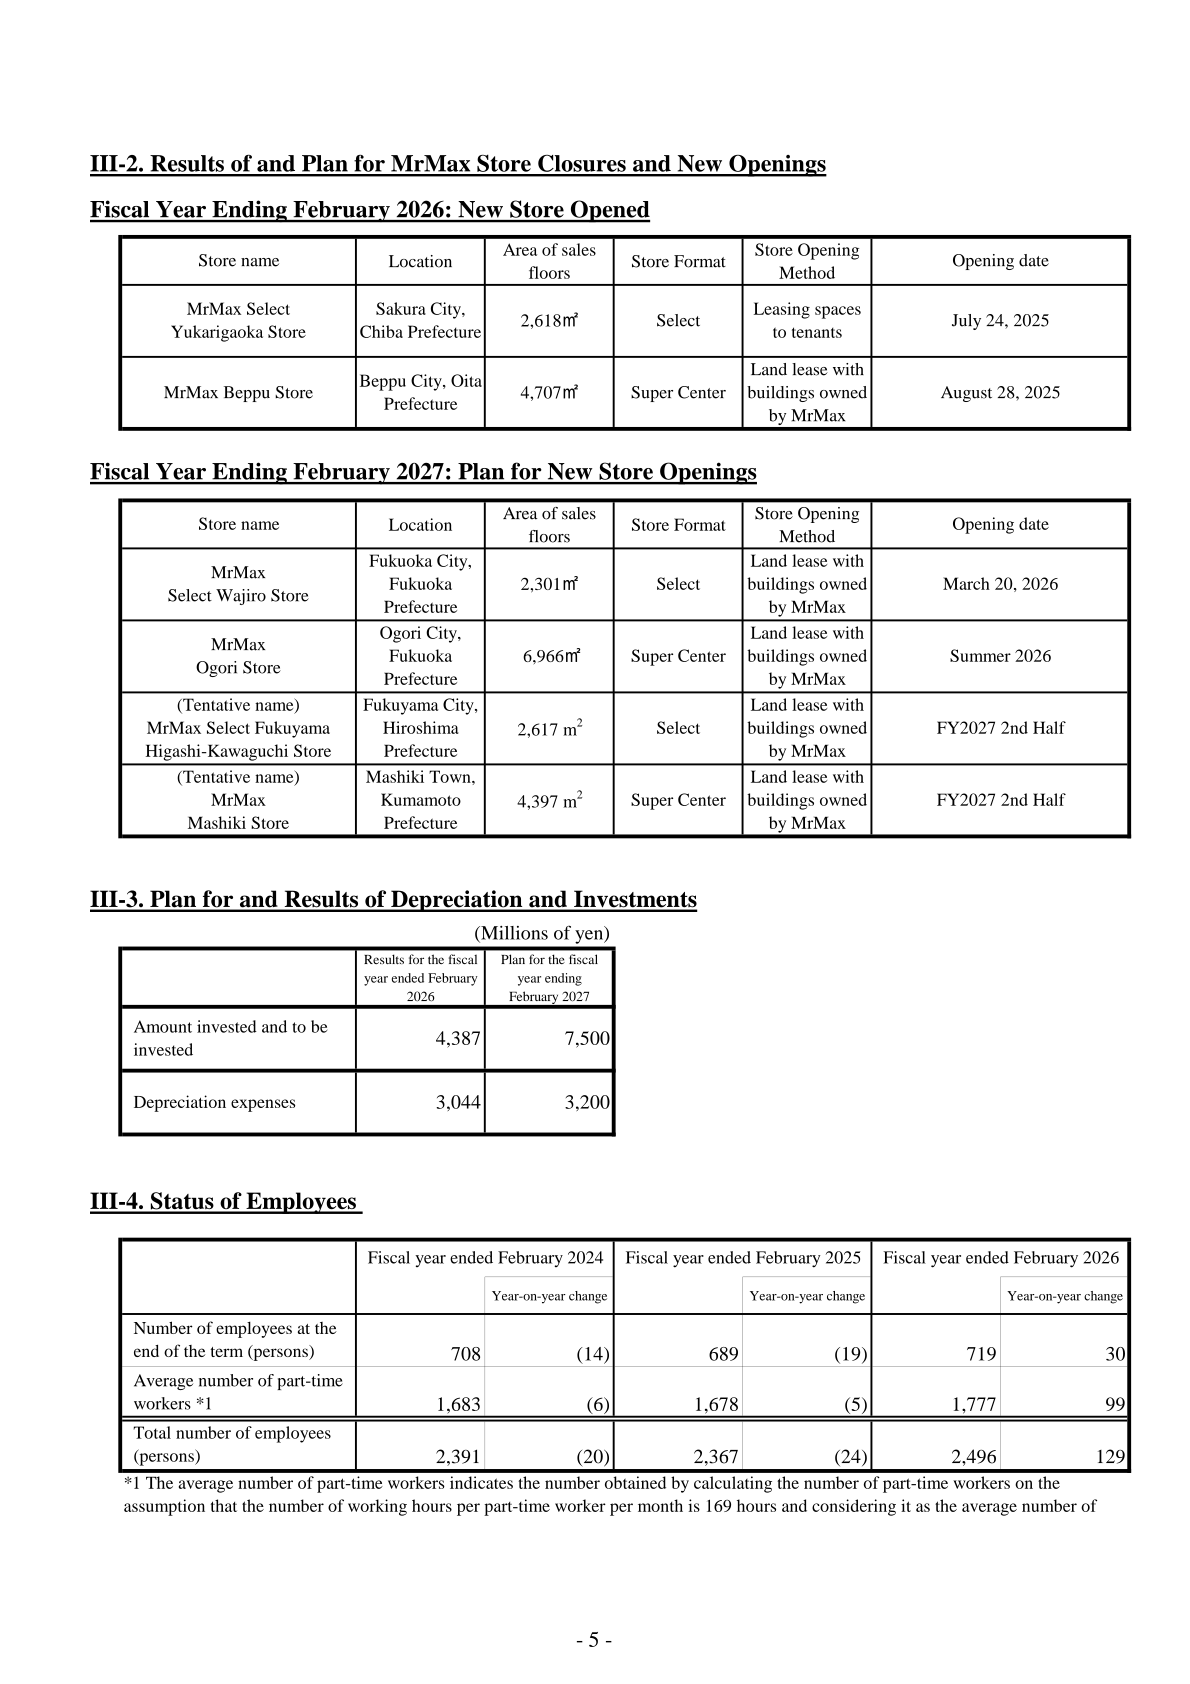
For the fiscal year ending February 28, 2027, Mr Max Holdings forecasts operating revenue of 157,000 million yen (106.3% of the FY2026 actual level), operating profit of 4,850 million yen (109.1%), ordinary profit of 4,700 million yen (104.5%), and profit attributable to owners of parent of 3,100 million yen (114.2%). The company also plans to increase capital investment to 7,500 million yen from 4,387 million yen in the fiscal year just ended, while planning two new store openings (one “Select” format store in March 2026 and one “Super Center” format store in summer 2026) plus two more tentatively planned for the second half of the fiscal year.
| Item | Forecast (FY ending Feb 2027) | Actual (FY ended Feb 2026) |
|---|---|---|
| Operating revenue (¥M) | 157,000 | 147,684 |
| Operating profit (¥M) | 4,850 | 4,445 |
| Ordinary profit (¥M) | 4,700 | 4,499 |
| Profit attributable to owners of parent (¥M) | 3,100 | 2,715 |
| Earnings per share (yen) | 95.96 | 81.15* |
| Capital investment (¥M) | 7,500 | 4,387 |
| Depreciation expenses (¥M) | 3,200 | 3,044 |
Shareholder Returns
This cannot be confirmed from the materials.
This article is an analysis based on publicly available information and is not a recommendation to buy or sell any specific securities. Investment decisions are your own responsibility.
















