
This article is based on publicly available IR materials and is not a recommendation to buy or sell any specific securities.
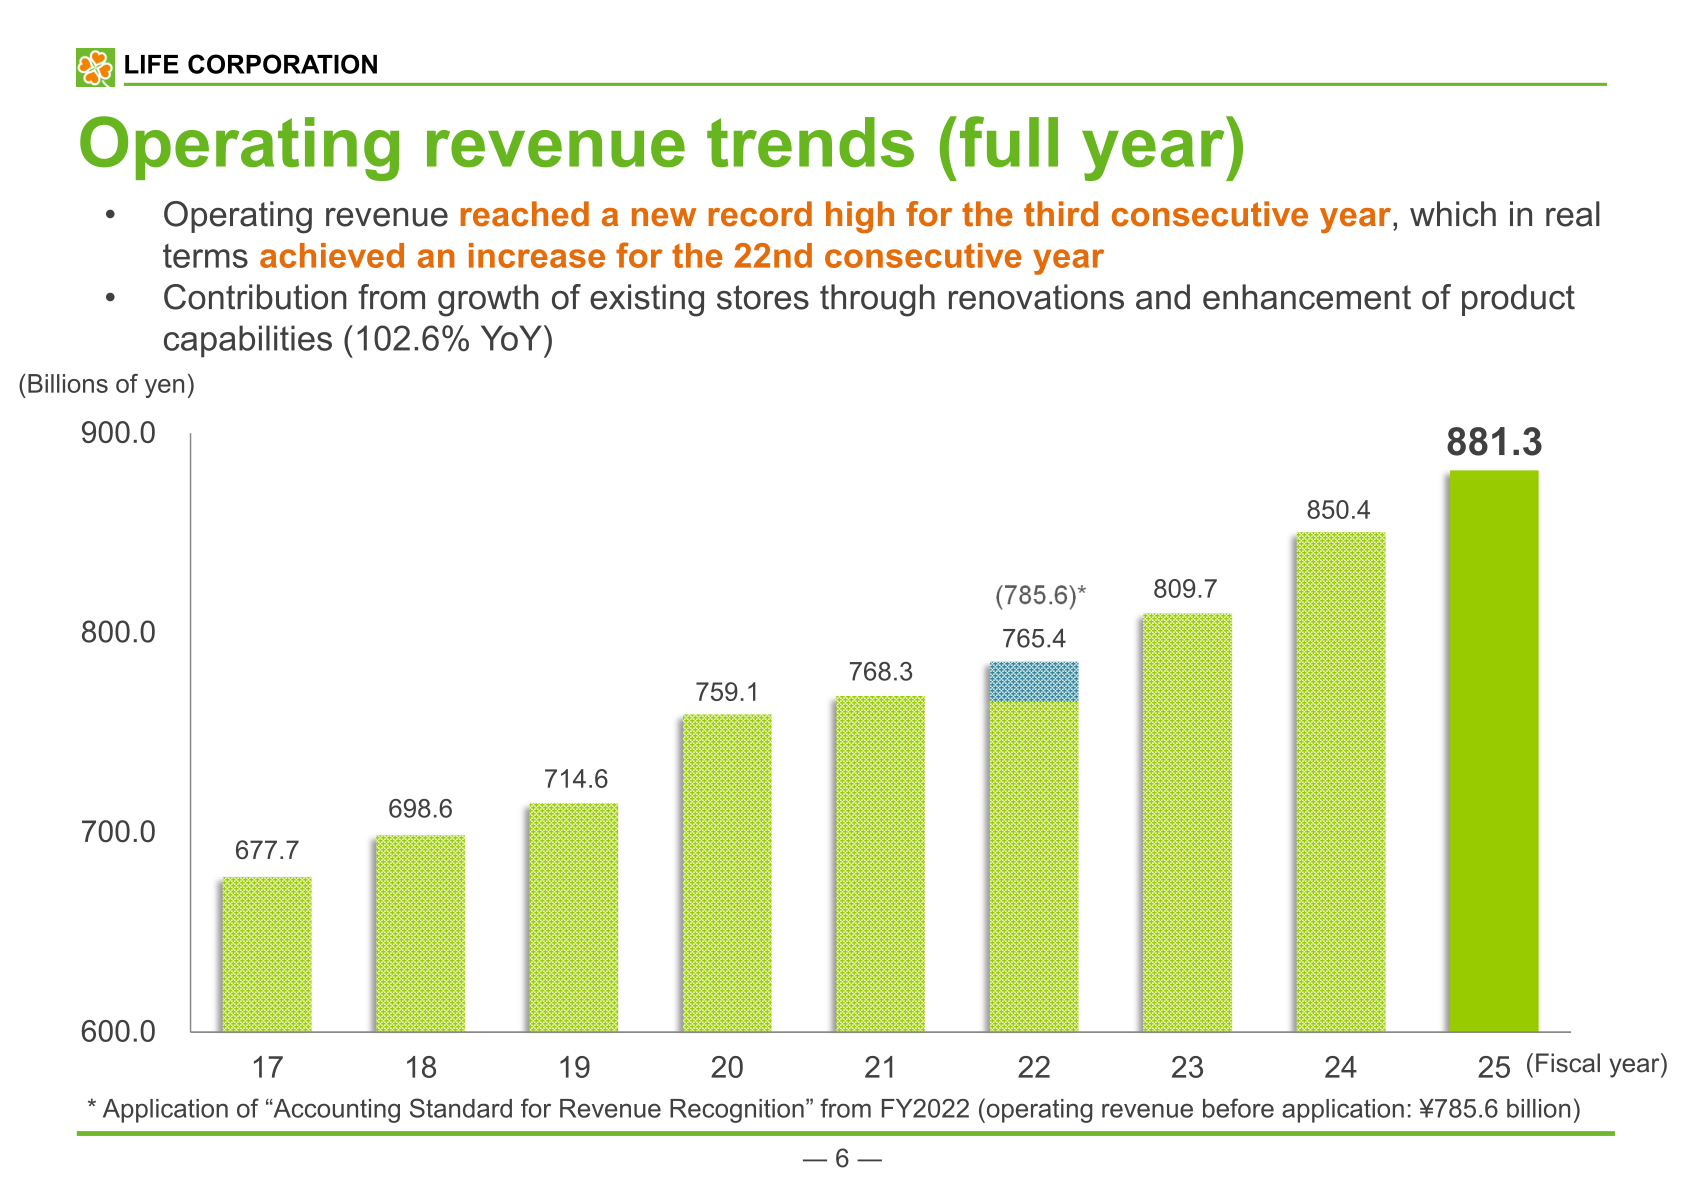
Life Corporation, a supermarket chain operator, reported consolidated operating revenue of ¥881,325 million for the fiscal year ended February 28, 2026 (FY2025), up 3.6% year on year, and profit of ¥18,822 million, up 4.9%. Growth was driven by existing-store sales, which rose 102.6% year on year on higher unit prices and customer numbers, together with a 0.3 percentage-point improvement in the consolidated gross profit ratio to 31.4%. The Company also plans to raise its year-end dividend by ¥0.5 per share, bringing the FY2025 annual dividend to a record ¥65.5 per share.
Consolidated Results (Full-Year Actual)
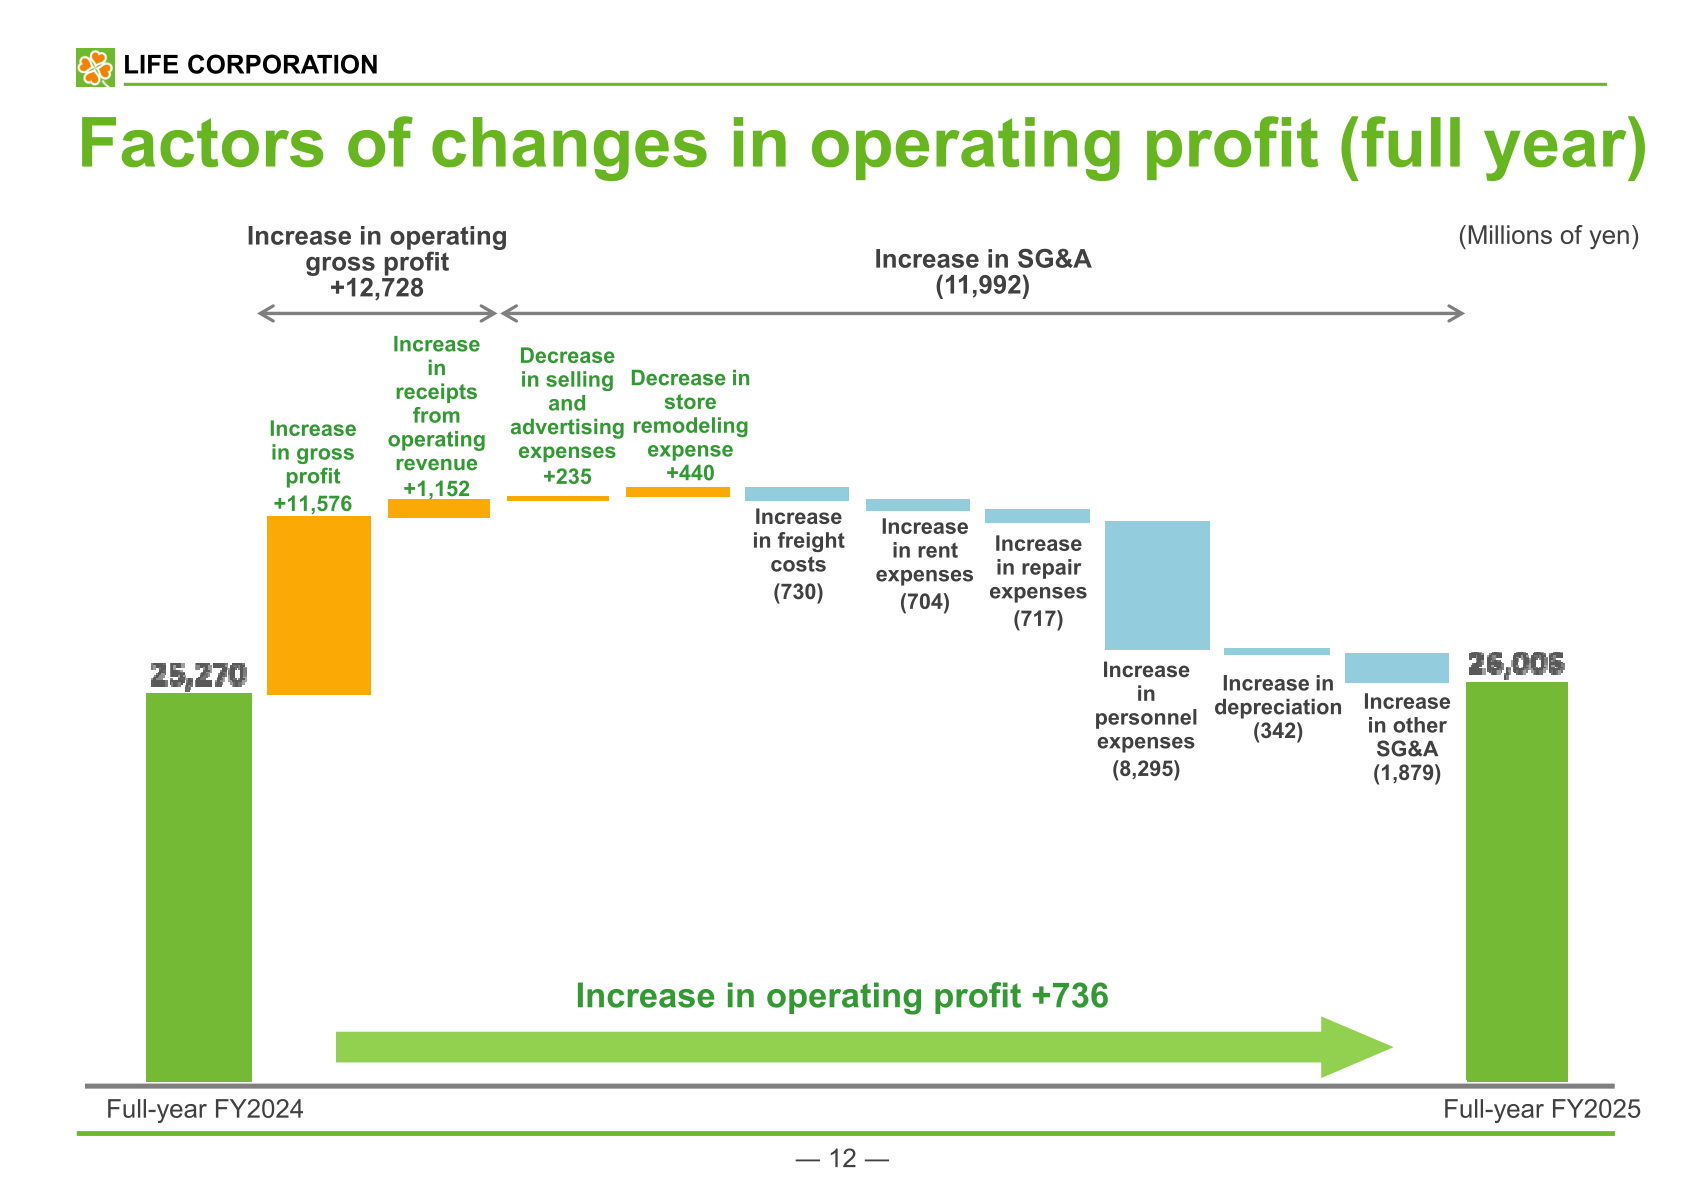
A dedicated revenue-trend slide states that operating revenue reached a record high for the third consecutive year, which in real terms (i.e., before the FY2022 revenue-recognition accounting change) represents a 22nd consecutive year of increase. Operating profit rose 2.9% to ¥26,006 million, as an ¥11,576 million increase in gross profit and a ¥1,152 million increase in receipts from operating revenue more than offset an ¥11,992 million rise in SG&A, including an ¥8,295 million increase in personnel expenses from pay raises. Ordinary profit increased 3.3% to ¥27,068 million.
| Item | FY2025 | FY2024 | Amount of Change | Rate of Change | Ratio to Net Sales |
|---|---|---|---|---|---|
| Operating revenue | 881,325 | 850,496 | +30,829 | +3.6% | – |
| Net sales | 848,570 | 818,892 | +29,677 | +3.6% | – |
| Gross profit | 266,474 | 254,897 | +11,576 | +4.5% | 31.4% |
| SG&A | 273,223 | 261,230 | +11,992 | +4.6% | 32.2% |
| Operating profit | 26,006 | 25,270 | +736 | +2.9% | 3.1% |
| Ordinary profit | 27,068 | 26,205 | +862 | +3.3% | 3.2% |
| Profit | 18,822 | 17,948 | +874 | +4.9% | 2.2% |
Segment Results
The materials break out full-year net sales by merchandise department rather than by business segment. Food-department sales rose 4.2% year on year, or 3.0% on an existing-store basis, to ¥756,902 million, led by Delicatessen (+6.3%) and Meat Products (+4.8%), while food items outside the Agricultural Produce department performed steadily on lower prices. Non-food sales declined 0.6% to ¥91,668 million, which the Company attributes to the comparison against a disaster-related demand surge in FY2024 and unseasonably warm winter temperatures.
| Department | FY2025 Net Sales (All Stores) | FY2024 Net Sales (All Stores) | FY2025 All-Stores YoY | FY2025 Existing-Stores YoY | Sales Composition |
|---|---|---|---|---|---|
| Food | 756,902 | 726,711 | 104.2 | 103.0 | 89.2% |
| Agricultural Produce | 109,174 | 108,569 | 100.6 | 99.5 | 12.9% |
| Marine Products | 65,658 | 63,258 | 103.8 | 102.8 | 7.7% |
| Meat Products | 95,399 | 90,990 | 104.8 | 103.8 | 11.2% |
| Delicatessen | 103,051 | 96,978 | 106.3 | 104.9 | 12.1% |
| Processed and Daily | 383,618 | 366,914 | 104.6 | 103.4 | 45.2% |
| Non-food | 91,668 | 92,181 | 99.4 | 98.9 | 10.8% |
| Lifestyle Products | 68,886 | 69,337 | 99.3 | 98.7 | 8.1% |
| Apparel | 22,781 | 22,843 | 99.7 | 99.7 | 2.7% |
| Total | 848,570 | 818,892 | 103.6 | 102.6 | 100.0% |
FY2026 Forecast
For FY2026 (fiscal year ending February 28, 2027), Life Corporation forecasts continued growth in sales and profit, centered on existing-store growth and 10 planned new store openings, assuming 103.5% existing-store YoY sales. The operating profit forecast assumes an expected gross profit ratio improvement of 0.2–0.3 percentage points, an approximately ¥8.5 billion increase in personnel expenses, and an approximately ¥6.4 billion increase in non-personnel expenses and depreciation. The Company notes that the impact of high oil prices from the prolongation of Middle East tensions has not been factored into the forecast.
| Item | FY2026 (Forecast) | FY2025 (Actual) | Amount of Change | Rate of Change |
|---|---|---|---|---|
| Operating revenue | 922,500 | 881,325 | +41,174 | +4.7% |
| Net sales | 888,000 | 848,570 | +39,429 | +4.6% |
| Operating profit | 27,000 | 26,006 | +993 | +3.8% |
| Ordinary profit | 28,000 | 27,068 | +931 | +3.4% |
| Profit | 19,000 | 18,822 | +177 | +0.9% |
Shareholder Returns
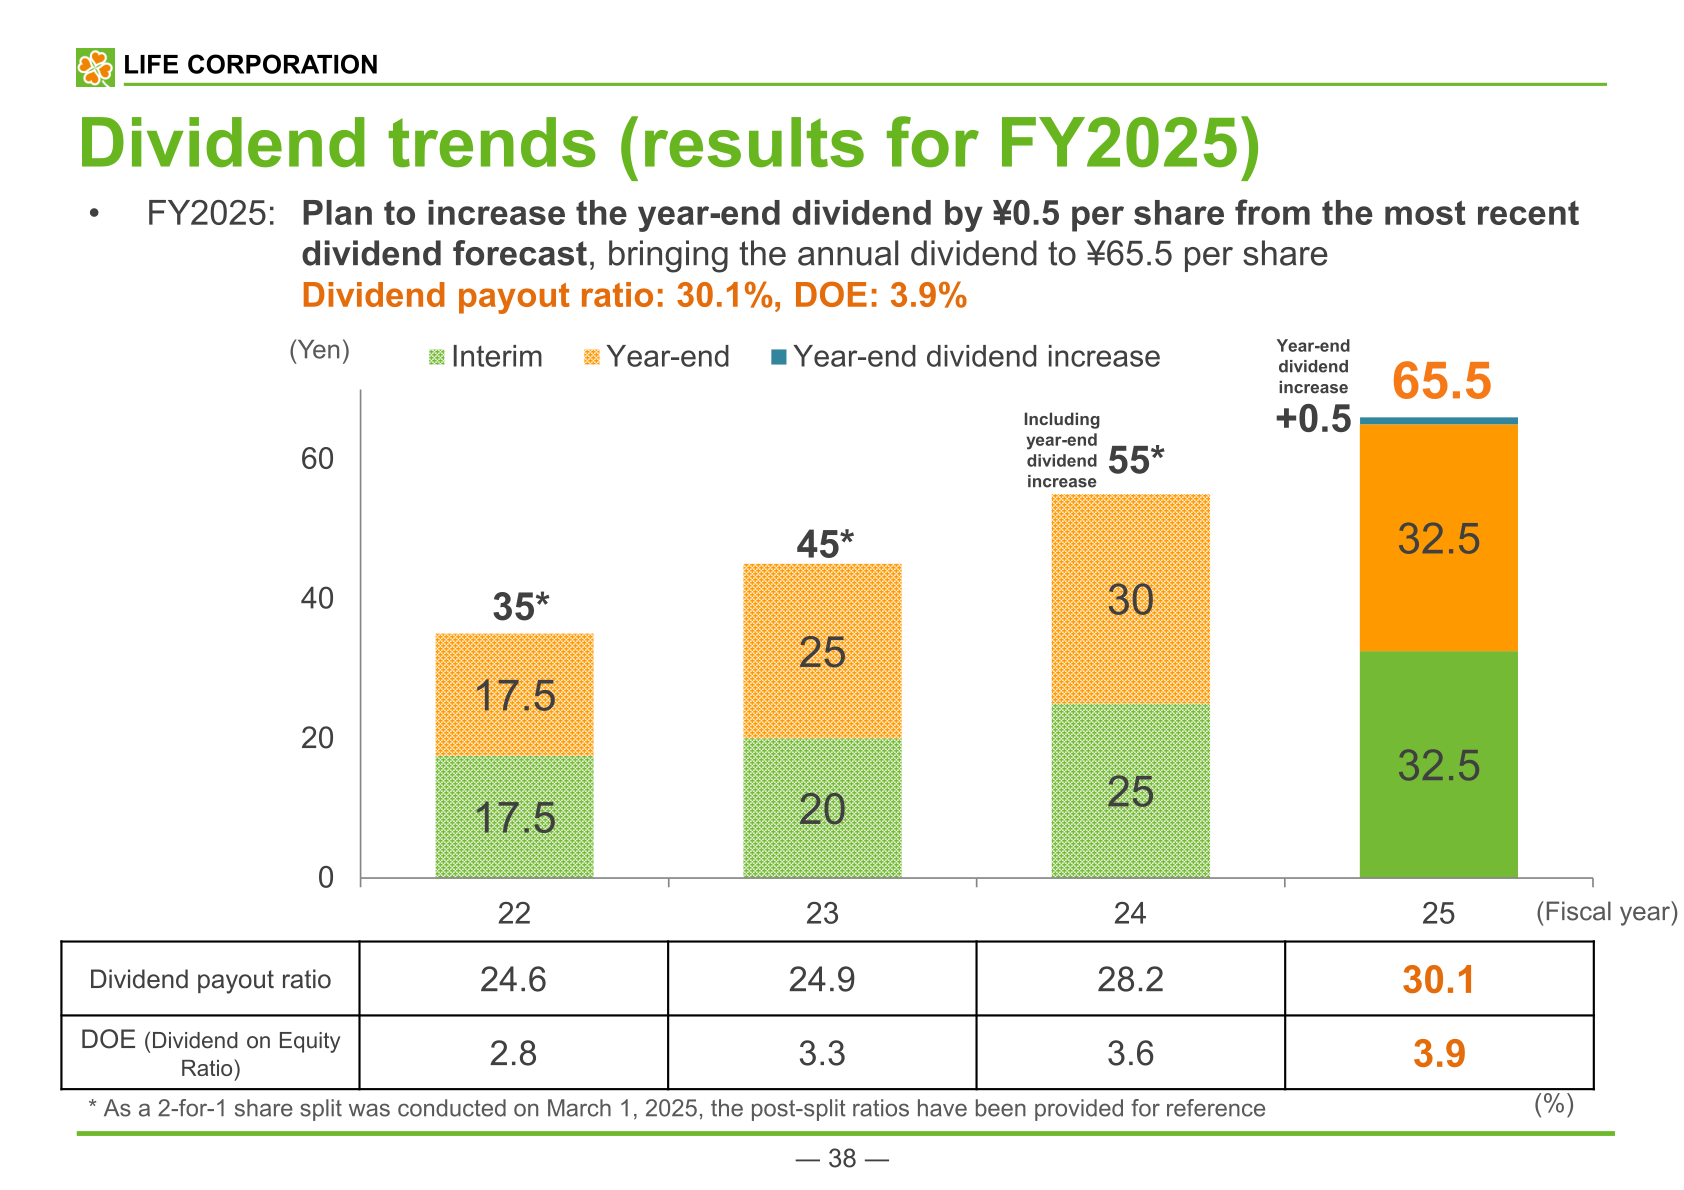
Life Corporation has paid stable dividends without reductions since listing. For FY2025, the Company plans to increase the year-end dividend by ¥0.5 per share from its most recent forecast, bringing the annual dividend to a record ¥65.5 per share (¥32.5 interim, plus ¥32.5 year-end and the additional ¥0.5 increase), for a dividend payout ratio of 30.1% and a DOE (Dividend on Equity Ratio) of 3.9%. For FY2026, the Company plans a full-year total dividend of ¥70 per share (¥35 interim, ¥35 year-end), forecasting a dividend payout ratio of 31.9%. On capital policy, the Company has conducted share buybacks equivalent to 8% of shares outstanding and cancelled treasury shares equivalent to 8.5% of shares outstanding (in November 2024 and May 2025), and monitors whether ROIC exceeds its cost of capital, which is verified by a third party (external).
| Item | FY2025 (Actual) | FY2024 |
|---|---|---|
| Interim dividend (yen per share) | 32.5 | 25 |
| Year-end dividend, incl. increase (yen per share) | 33.0 (32.5 + 0.5 increase) | 30 |
| Annual dividend (yen per share) | 65.5 | 55 |
| Dividend payout ratio | 30.1% | 28.2% |
| DOE (Dividend on Equity Ratio) | 3.9% | 3.6% |
Medium-Term Plan / Topics
Under its unchanged vision for what it wants to be in FY2030 — a community-based supermarket that “everyone says, ‘It’s my supermarket'” — Life Corporation’s quantitative targets (excerpt) are net sales of ¥1 trillion, ordinary profit of ¥35.0 billion, profit of ¥22.0 billion, a 50% reduction in CO2 emissions (compared with FY2013), employee satisfaction of 4.0 (on a 5.0 maximum scale), and a 20% ratio of female managers. For its BIO-RAL natural-food business, the Company added a new profit target for FY2030: 50 BIO-RAL stores, ¥40.0 billion in net sales, ¥2.0 billion in ordinary profit, and 1,000 private-brand product items. Return on invested capital (ROIC) has consistently exceeded the Company’s weighted average cost of capital (WACC, approx. 5%), and ROE remained at 12.8% for FY2025.
This article is an analysis based on publicly available information and is not a recommendation to buy or sell any specific securities. Investment decisions are your own responsibility.
















