
This article is based on publicly available IR materials and is not a recommendation to buy or sell any specific securities.
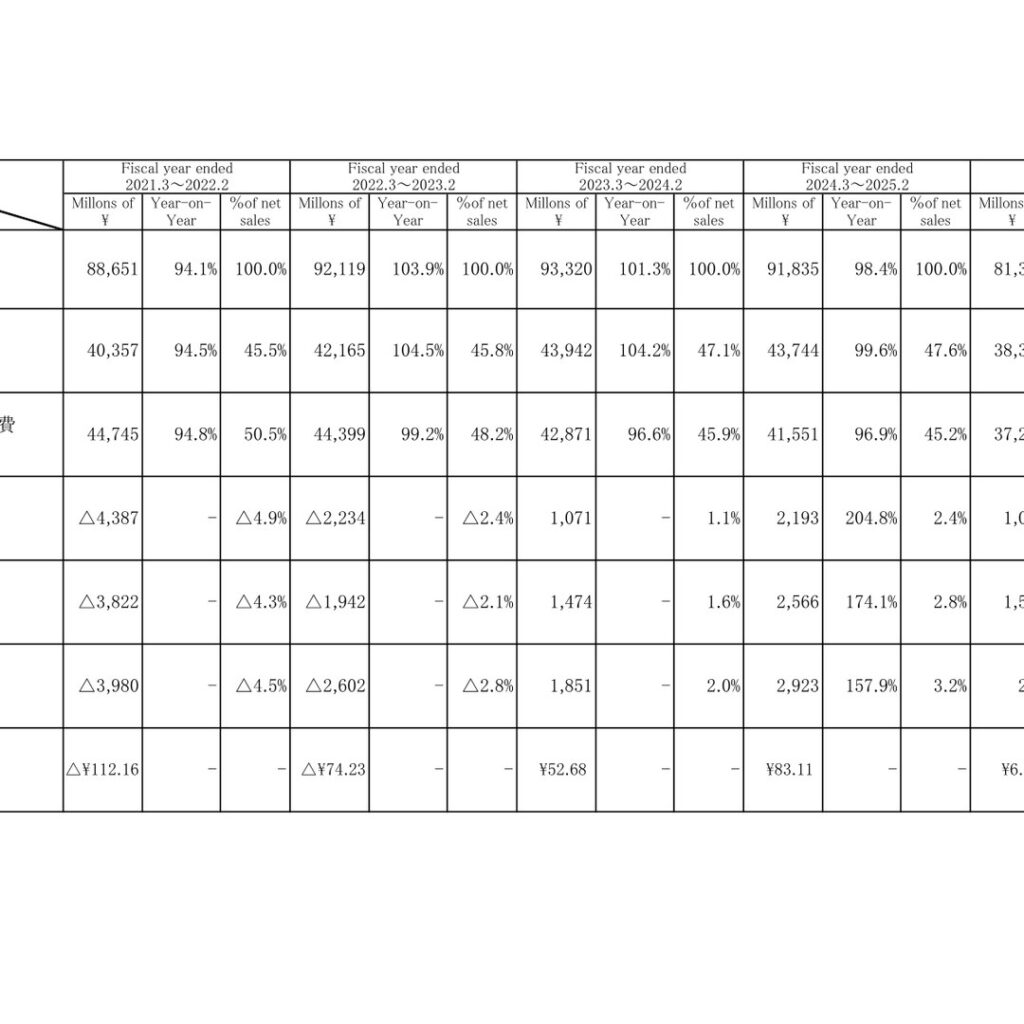
Chiyoda Co., Ltd. (8185), a Tokyo-based shoe specialty retailer that operates the SHOE PLAZA and Tokyo Shoe Retailing Center chains, reported consolidated net sales of ¥81,377 million for the fiscal year under review, equal to 88.6% of the prior year. Operating profit fell to ¥1,090 million (49.7% of the prior year), recurring profit (ordinary income) fell to ¥1,508 million (58.8%), and net income attributable to owners of the parent dropped sharply to ¥237 million (8.1% of the prior year), as inventory-clearance discounting, rising raw-material and energy costs, and higher labor costs weighed on profitability. Results were also affected by the deconsolidation of former subsidiary Mac-House Co., Ltd. (now Gyet Co., Ltd.), which was excluded from the consolidated group from November 2024.
Note: Chiyoda’s own materials label this period (March 1, 2025 – February 28, 2026) as its 79th fiscal term, referring to it in English as the “fiscal year ended Feb. 28, 2026”; this article follows site convention and labels it FY2025. Tables below retain the company’s own fiscal-year labels and reporting periods.
Consolidated Results (Full-Year Actual)
On a consolidated basis, net sales declined to ¥81,377 million (88.6% of the prior year), gross profit fell to ¥38,317 million (87.6%), and selling, general and administrative (SG&A) expenses decreased to ¥37,226 million (89.6%). Operating profit was ¥1,090 million, recurring profit was ¥1,508 million, and net income attributable to owners of the parent was ¥237 million, with net income per share of ¥6.91.
| Item | FY ended Feb. 2026 | FY ended Feb. 2025 | Year-on-Year |
|---|---|---|---|
| Net Sales (¥ million) | 81,377 | 91,835 | 88.6% |
| Gross Profit (¥ million) | 38,317 | 43,744 | 87.6% |
| SG&A Expenses (¥ million) | 37,226 | 41,551 | 89.6% |
| Operating Profit (¥ million) | 1,090 | 2,193 | 49.7% |
| Recurring Profit (¥ million) | 1,508 | 2,566 | 58.8% |
| Net Income Attributable to Owners of Parent (¥ million) | 237 | 2,923 | 8.1% |
| Net Income per Share (¥) | 6.91 | 83.11 | – |
Segment Results
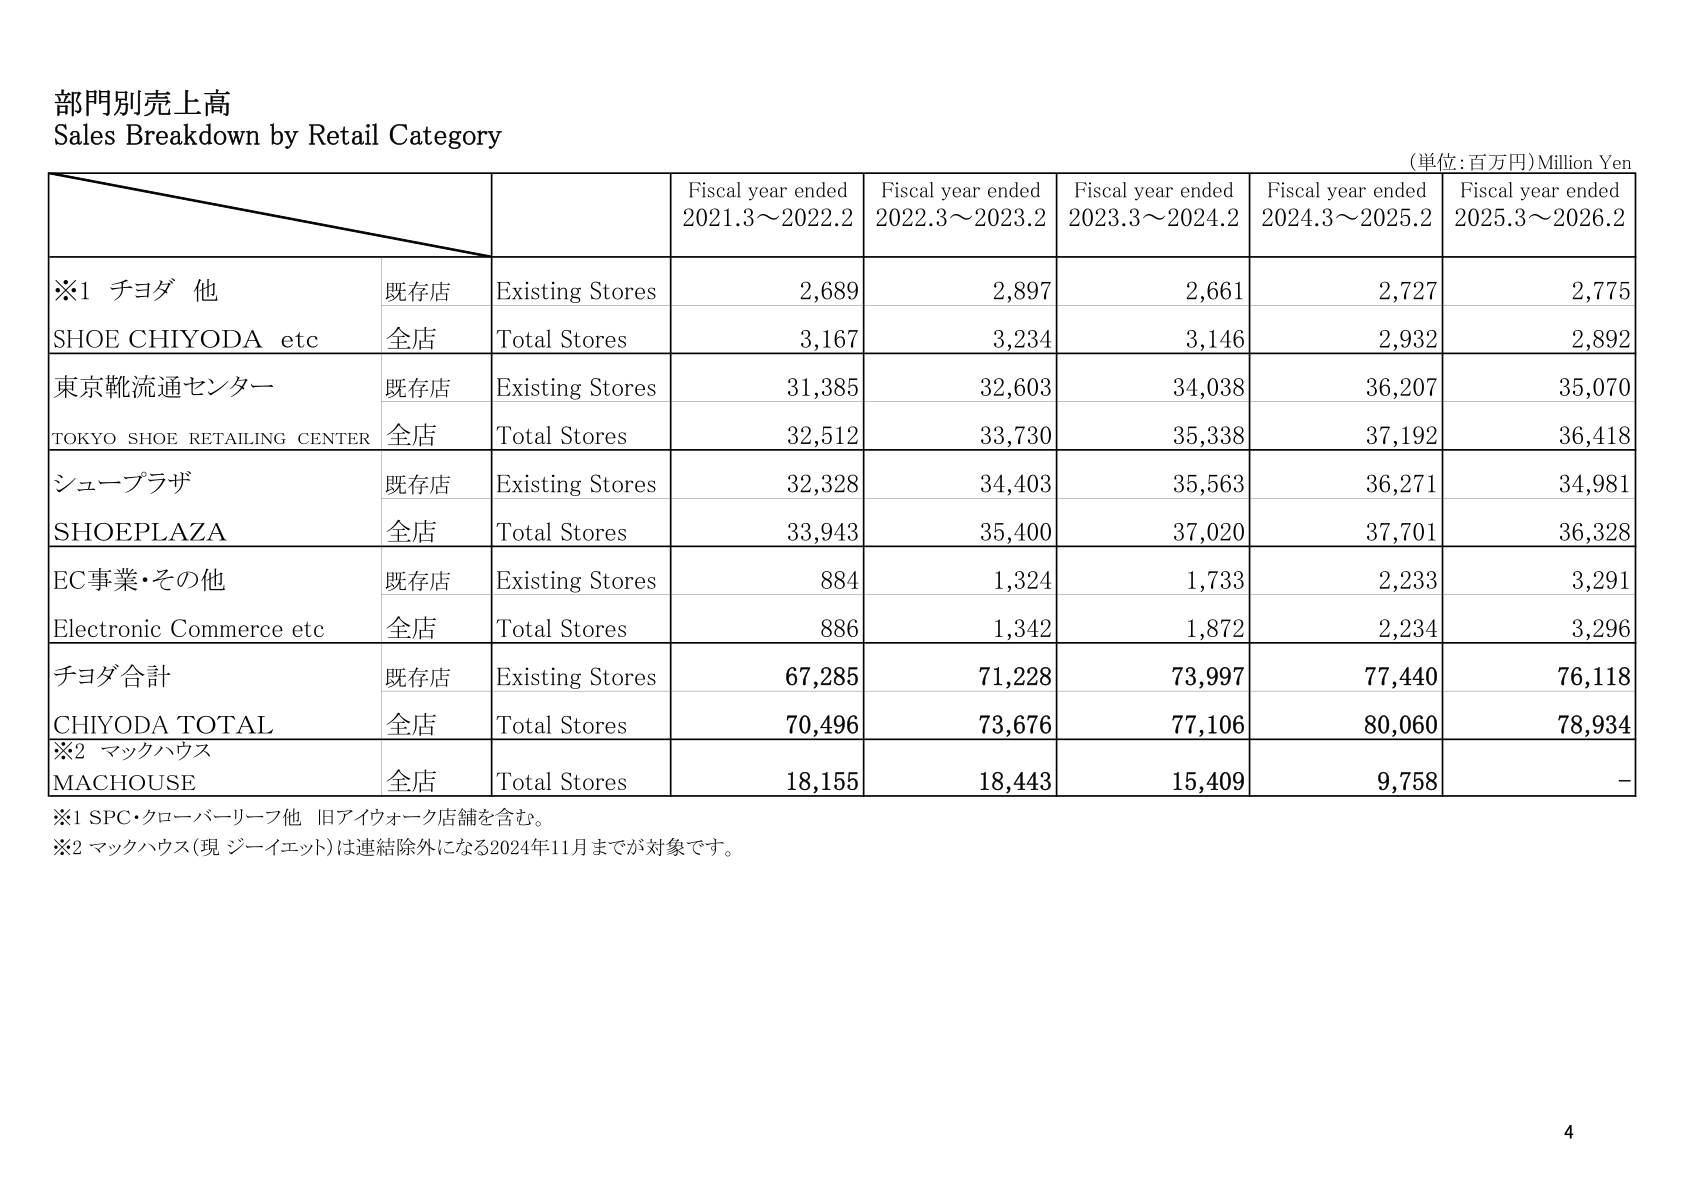
Chiyoda’s Sales Breakdown by Retail Category (non-consolidated) shows Tokyo Shoe Retailing Center and SHOEPLAZA as the two largest chains, together accounting for the large majority of total-store net sales, while the Electronic Commerce business continued to grow. The SHOE CHIYODA brand and other small-format stores contracted further. Former subsidiary MACHOUSE, which contributed ¥9,758 million in the prior fiscal year, is no longer part of the consolidated total following its deconsolidation in November 2024.
| Retail Category (Non-Consolidated) | Net Sales, Total Stores, FY ended Feb. 2026 (¥ million) | Net Sales, Total Stores, FY ended Feb. 2025 (¥ million) |
|---|---|---|
| SHOE CHIYODA etc | 2,892 | 2,932 |
| Tokyo Shoe Retailing Center | 36,418 | 37,192 |
| SHOEPLAZA | 36,328 | 37,701 |
| Electronic Commerce etc | 3,296 | 2,234 |
| Chiyoda Total | 78,934 | 80,060 |
| MACHOUSE (deconsolidated Nov. 2024) | – | 9,758 |
Profitability and Cost Trends
Consolidated gross margin was 47.1% of net sales, down from 47.6% in the prior year, while the consolidated SG&A ratio rose to 45.7% from 45.2%. Within SG&A, advertising expense increased slightly to ¥3,584 million, while salaries and wages and rent (“Property taxes” in the source document) both declined, consistent with the reduction in store count.
| Item | FY ended Feb. 2026 | FY ended Feb. 2025 |
|---|---|---|
| Gross Margin, % of Net Sales (Consolidated) | 47.1% | 47.6% |
| SG&A, % of Net Sales (Consolidated) | 45.7% | 45.2% |
| Advertising Expense (¥ million, Consolidated) | 3,584 | 3,575 |
| Salary and Wages (¥ million, Consolidated) | 11,384 | 12,660 |
| Property Taxes / Rent (¥ million, Consolidated) | 8,448 | 9,967 |
Store Network and Capital Expenditure
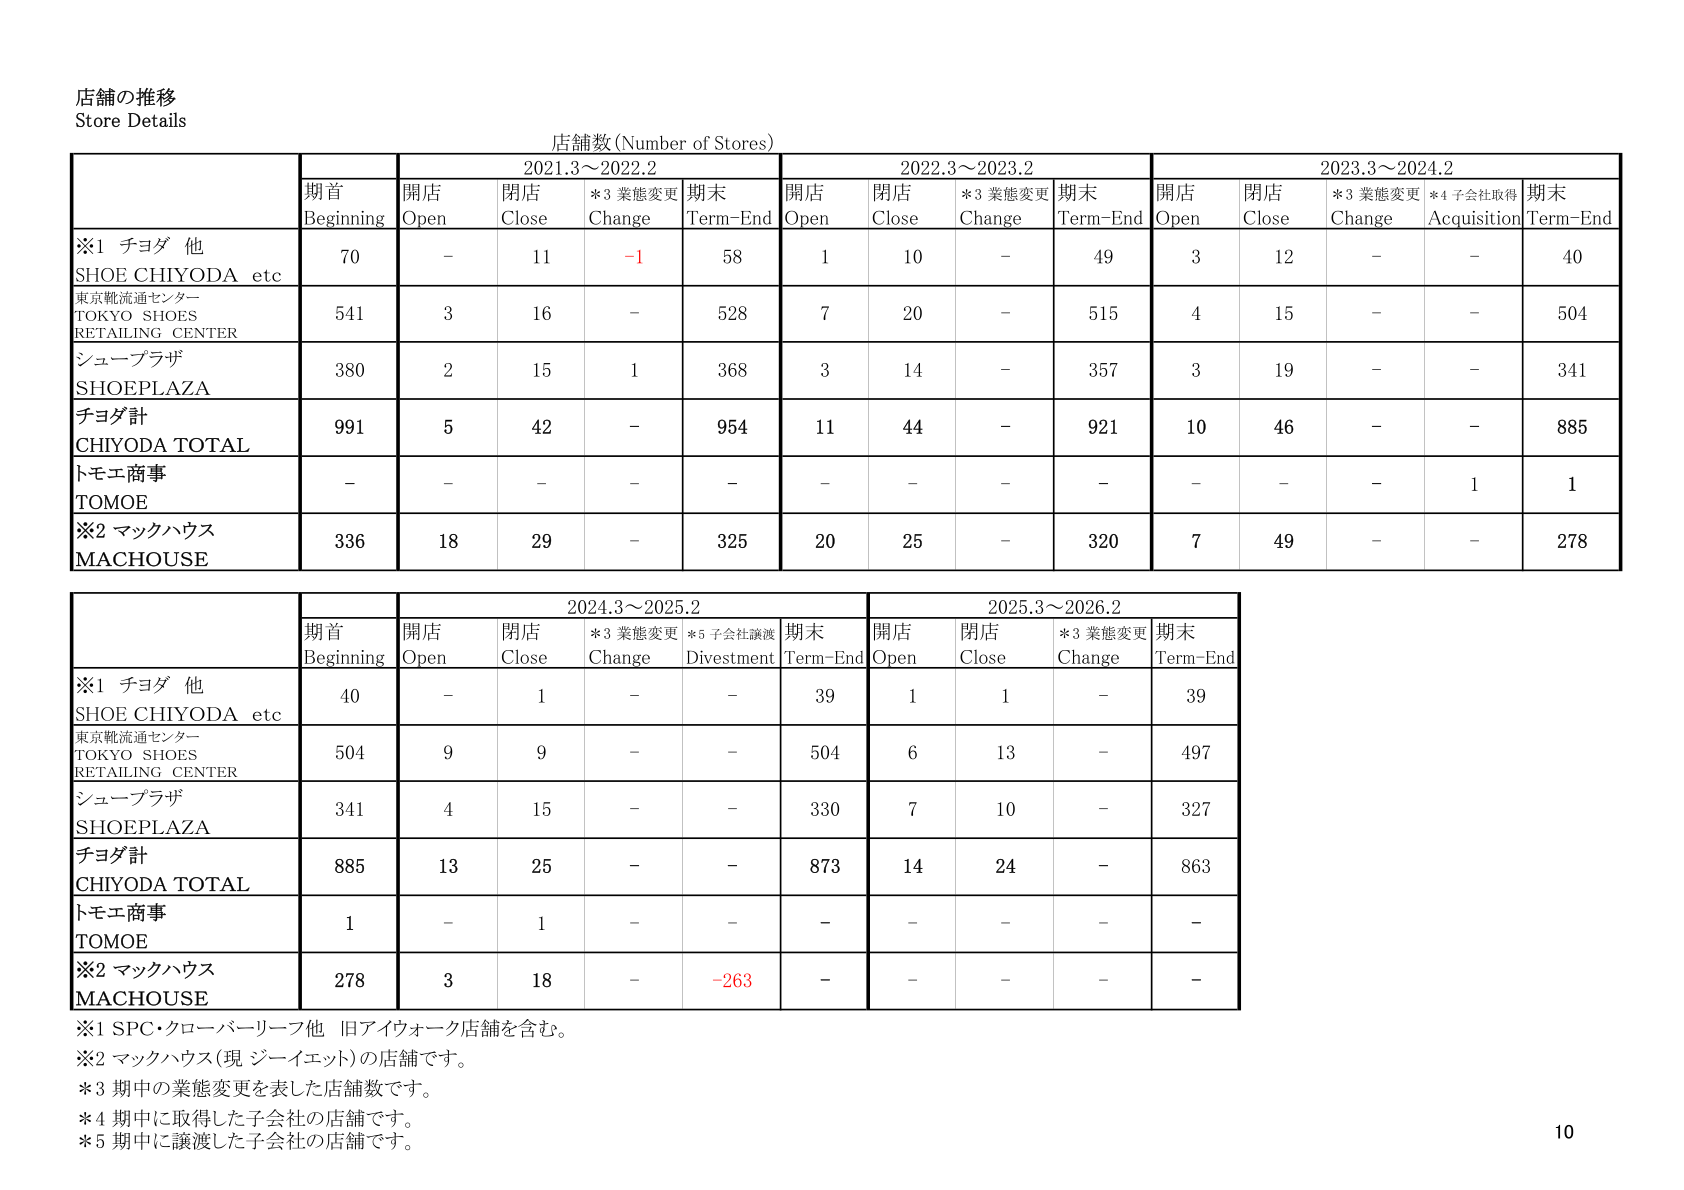
Chiyoda operated 863 stores across all formats at the end of February 2026, down from 873 a year earlier, as 14 new stores opened against 24 closures during the fiscal year. Consolidated capital expenditure increased to ¥1,153 million (135.3% of the prior year), while consolidated depreciation expenses were ¥734 million (94.7% of the prior year).
| Item | FY ended Feb. 2026 | FY ended Feb. 2025 |
|---|---|---|
| Chiyoda Total Stores, Period-End | 863 | 873 |
| Stores Opened | 14 | 13 |
| Stores Closed | 24 | 25 |
| Capital Expenditure (¥ million, Consolidated) | 1,153 | 852 |
| Depreciation Expenses (¥ million, Consolidated) | 734 | 775 |
Outlook
The source document used for this article presents five years of historical financial and operating data and does not include forward-looking earnings guidance or dividend figures for the fiscal year ending February 2027. This cannot be confirmed from the materials.
This article is an analysis based on publicly available information and is not a recommendation to buy or sell any specific securities. Investment decisions are your own responsibility.
















