
This article is based on publicly available IR materials and is not a recommendation to buy or sell any specific securities.
Note: MEIWA CORPORATION’s presentation labels the fiscal year ended March 31, 2026, as “FY03/26” and the prior fiscal year as “FY03/25.” This article follows japan-equity.com’s convention of referring to the most recently completed fiscal year as FY2025; tables and figures below retain the source presentation’s original “FY03/25″/”FY03/26” labels.
MEIWA CORPORATION reported consolidated net sales of ¥164,927 million for the fiscal year ended March 31, 2026, up 5.2% year on year, with operating income rising 15.8% to ¥4,132 million. Ordinary income declined 1.8% to ¥4,438 million on a decrease in equity in earnings of affiliates and foreign exchange losses, while net income attributable to owners of parent was almost unchanged at ¥3,374 million, as an increase in extraordinary income from the sale of strategically held shares offset the decline at the ordinary income level. All four headline consolidated metrics exceeded the company’s own full-year forecast, and the year-end dividend was increased to ¥42 per share.
Consolidated Results (Full-Year Actual)
Net sales grew on strong performance in Business Division 1 and the Battery & Automotive Division, and on the contribution of Takaroku Corporation following the acquisition of its shares within Business Division 3, despite weaker sales in Business Division 2. Operating income increased on higher net sales, while ordinary income declined due to a decrease in equity in earnings of affiliates. Gross margin improved to 8.65% from 8.01%.
| Item (million yen, unless noted) | FY03/2025 (Actual) | FY03/2026 (Actual) | Change | Change (%) |
|---|---|---|---|---|
| Net sales | 156,727 | 164,927 | +8,200 | +5.2% |
| Gross income | 12,552 | 14,268 | +1,716 | - |
| Gross margin | 8.01% | 8.65% | +0.64% | - |
| Selling, general, and administrative expenses | (8,983) | (10,136) | (1,153) | - |
| Operating income | 3,568 | 4,132 | +563 | +15.8% |
| Net financial income/expense | 0 | (56) | (56) | - |
| Dividend income | 240 | 244 | +3 | - |
| Equity in earnings (losses) of affiliates | 641 | 127 | (514) | - |
| Other non-operating income/expense | 68 | (7) | (76) | - |
| Ordinary income | 4,520 | 4,438 | (81) | (1.8%) |
| Extraordinary income/loss | 188 | 652 | +464 | - |
| Income before income taxes | 4,708 | 5,091 | +382 | - |
| Corporate, local, and enterprise taxes | (1,258) | (1,606) | (347) | - |
| Net income attributable to non-controlling interests | (73) | (110) | (37) | - |
| Net income attributable to owners of parent | 3,376 | 3,374 | (2) | (0.1%) |
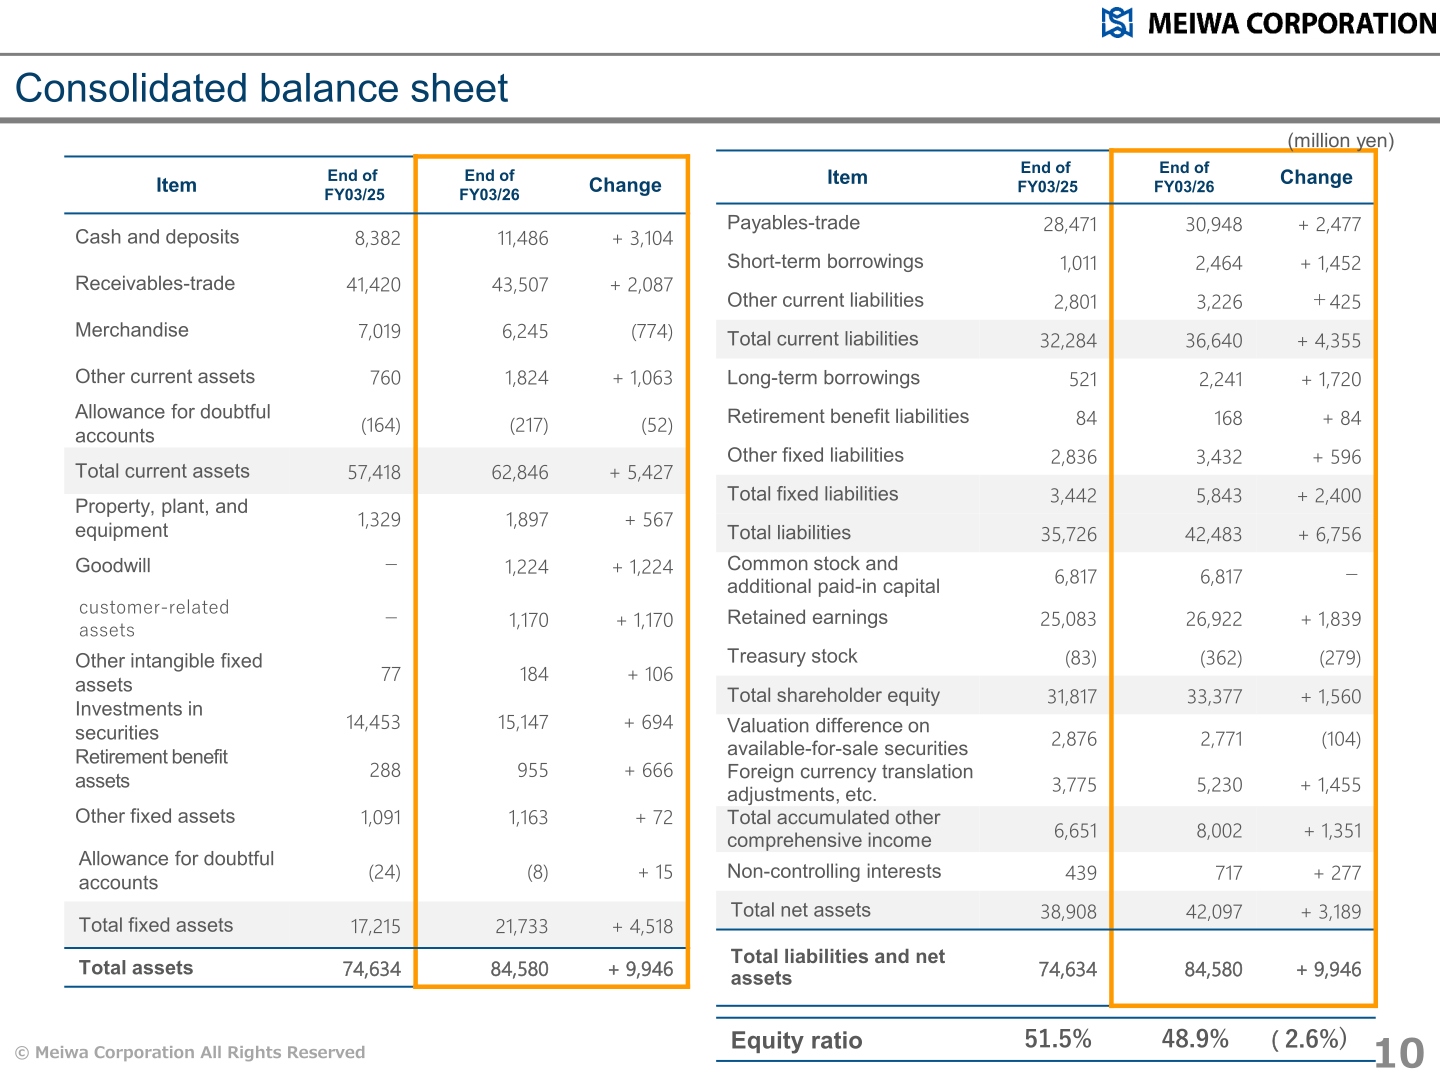
As of March 31, 2026, total assets were ¥84,580 million, up ¥9,946 million from ¥74,634 million a year earlier, and total net assets rose to ¥42,097 million from ¥38,908 million, resulting in an equity ratio of 48.9% versus 51.5% a year earlier. Total liabilities increased to ¥42,483 million from ¥35,726 million. Note: On May 27, 2026, MEIWA CORPORATION disclosed a partial correction to the consolidated balance sheet figures in this presentation, reclassifying amounts between short-term and long-term borrowings. Using the corrected figures, short-term borrowings were ¥2,664 million (up ¥1,652 million from ¥1,011 million), long-term borrowings were ¥2,041 million (up ¥1,520 million from ¥521 million), total current liabilities were ¥36,840 million (up ¥4,555 million), and total fixed liabilities were ¥5,643 million (up ¥2,200 million); total liabilities were unchanged at ¥42,483 million.
Segment Results
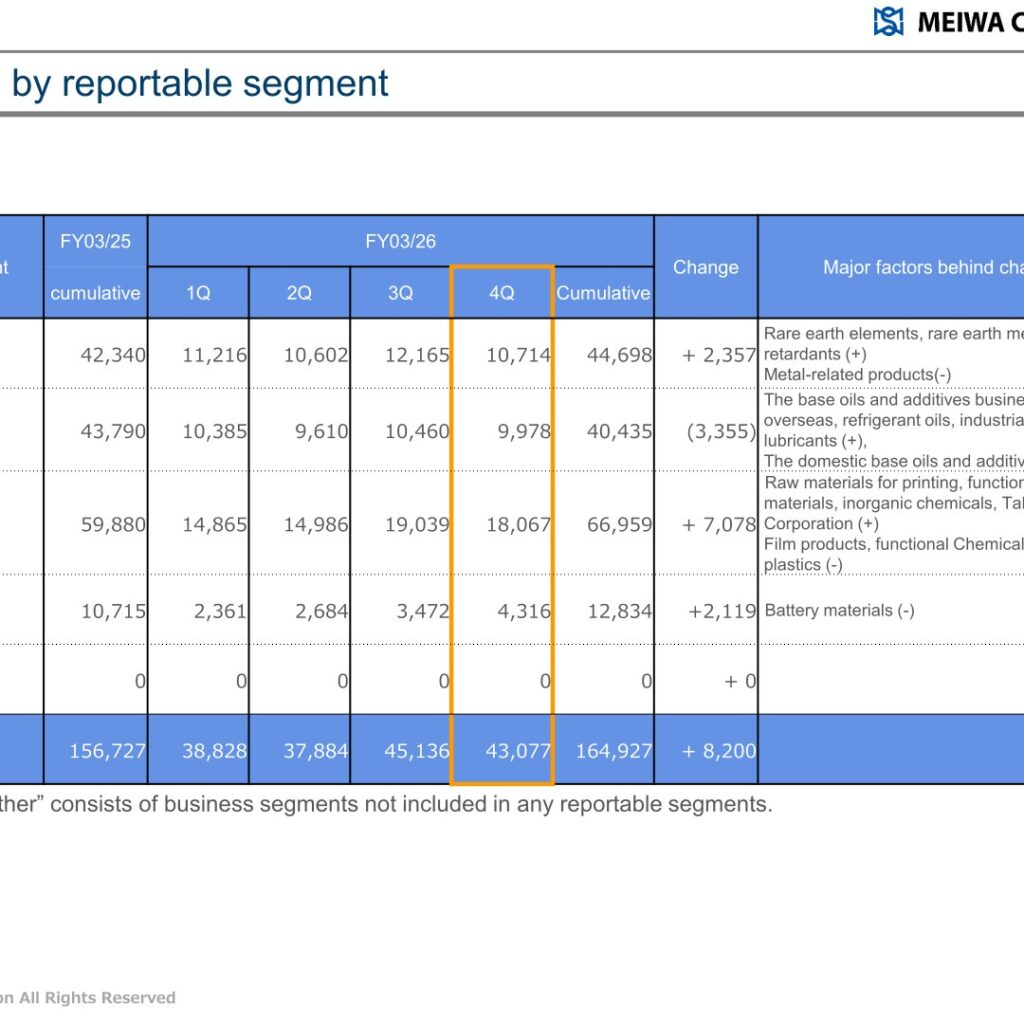
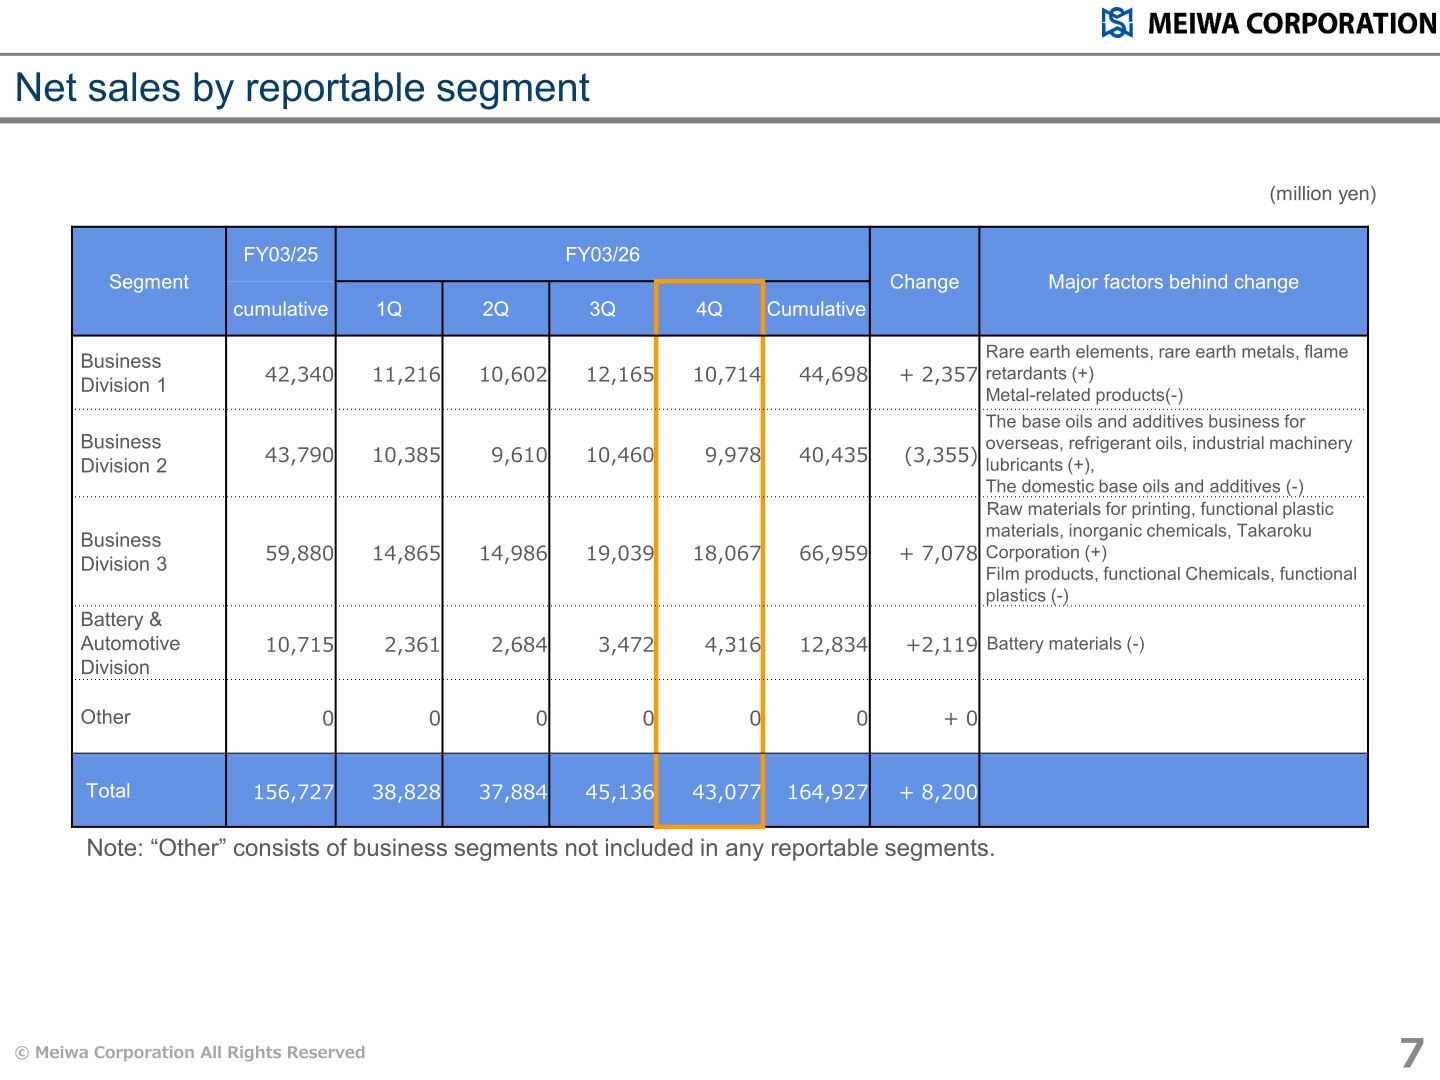
By reportable segment, net sales grew in Business Division 1 (rare earth elements, rare earth metals, flame retardants), Business Division 3 (raw materials for printing, functional plastic materials, inorganic chemicals, and the newly consolidated Takaroku Corporation), and the Battery & Automotive Division, while Business Division 2 (petroleum products) declined on weaker domestic base oils and additives sales. Operating income by segment increased in Business Divisions 1 and 2, declined slightly in Business Division 3, and fell in the Battery & Automotive Division on a decrease in equity in earnings of affiliates.
| Segment | Metric | FY03/2025 (Actual) | FY03/2026 (Actual) | Change |
|---|---|---|---|---|
| Business Division 1 | Net sales (million yen) | 42,340 | 44,698 | +2,357 |
| Business Division 1 | Operating income (million yen) | 2,370 | 2,500 | +130 |
| Business Division 2 | Net sales (million yen) | 43,790 | 40,435 | (3,355) |
| Business Division 2 | Operating income (million yen) | 804 | 925 | +120 |
| Business Division 3 | Net sales (million yen) | 59,880 | 66,959 | +7,078 |
| Business Division 3 | Operating income (million yen) | 1,031 | 953 | (77) |
| Battery & Automotive Division | Net sales (million yen) | 10,715 | 12,834 | +2,119 |
| Battery & Automotive Division | Operating income (million yen) | 408 | 23 | (384) |
| Other | Net sales (million yen) | 0 | 0 | +0 |
| Other | Operating income (million yen) | (205) | (285) | (80) |
| Adjustments | Operating income (million yen) | 111 | 322 | +210 |
| Total | Net sales (million yen) | 156,727 | 164,927 | +8,200 |
| Total | Operating income (million yen) | 4,520 | 4,438 | (81) |
Performance Against Full-Year Guidance
The presentation does not include specific earnings guidance for the following fiscal year; it shows only the comparison between the company’s full-year forecast for FY03/2026 and the actual results achieved.
| Item (million yen, unless noted) | Full-Year Forecast (FY03/2026) | Actual (FY03/2026) | Achievement Rate |
|---|---|---|---|
| Net sales | 160,000 | 164,927 | 103.1% |
| Operating income | 3,800 | 4,132 | 108.7% |
| Ordinary income | 4,000 | 4,438 | 111.0% |
| Net income attributable to owners of parent | 3,000 | 3,374 | 112.5% |
Shareholder Returns
The presentation states that the year-end dividend for the fiscal year ended March 31, 2026, was increased to ¥42 per share. This cannot be confirmed from the materials: no further dividend schedule or shareholder-return policy detail beyond this statement is included in this presentation.
This article is an analysis based on publicly available information and is not a recommendation to buy or sell any specific securities. Investment decisions are your own responsibility.
















