
This article is based on publicly available IR materials and is not a recommendation to buy or sell any specific securities.
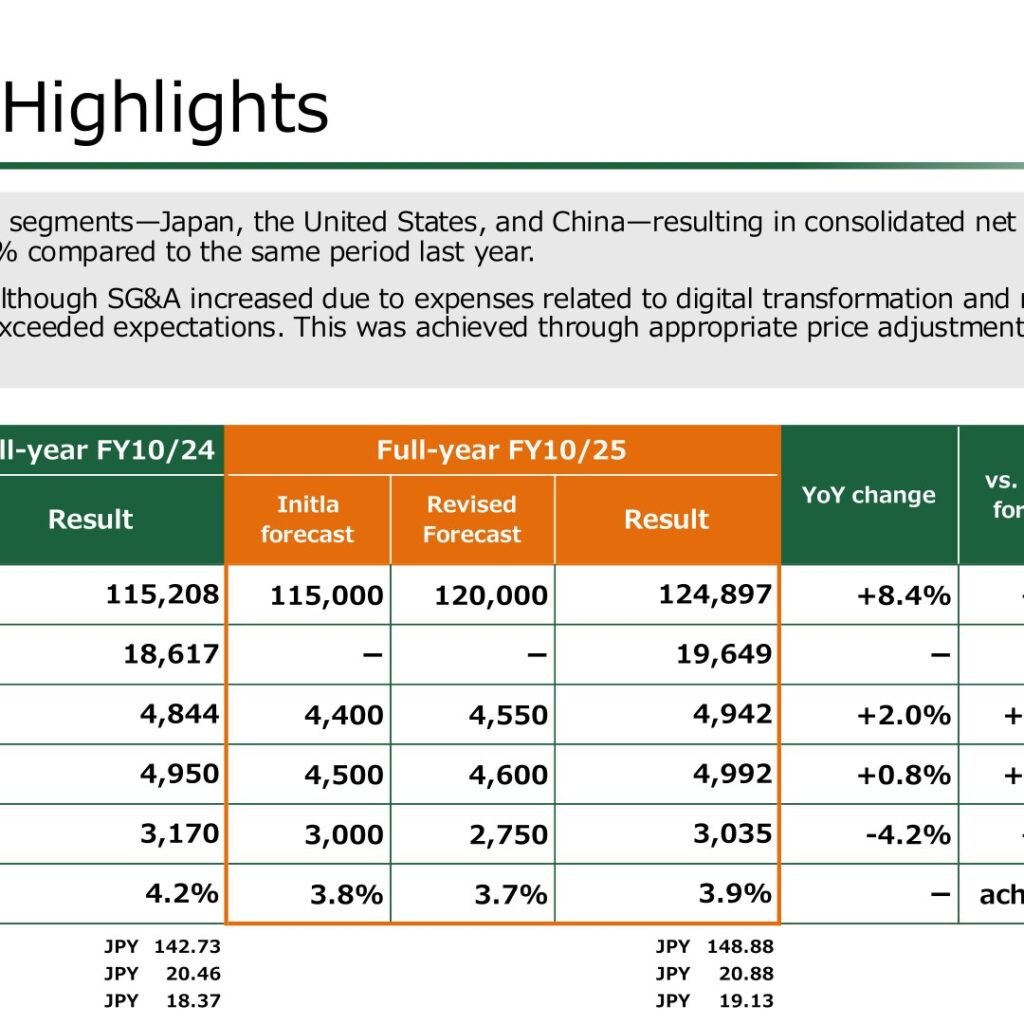
Shoei Foods Corporation, a specialty food ingredients trading company handling dairy products and fats, confectionery raw materials, nuts and dried fruits, and confectionery and retail products, reported consolidated results for the fiscal year ended October 31, 2025 (FY10/25) that exceeded both its initial and revised earnings forecasts. Net sales rose 8.4% year on year to ¥124,897 million, driven by higher sales across all three reporting segments—Japan, the United States, and China. Operating profit increased 2.0% to ¥4,942 million, coming in well above guidance, while profit attributable to owners of parent declined 4.2% year on year to ¥3,035 million.
Consolidated Results (Full-Year Actual)
Note: Shoei Foods labels its fiscal year by the October fiscal year-end (e.g. “FY10/25” for the year ended October 31, 2025); this article follows the site convention of referring to that year as FY2025, while tables below retain the company’s own FY10/24 / FY10/25 labels.
Gross profit increased to ¥19,649 million from ¥18,617 million a year earlier, as price optimization in response to rising raw ingredient costs more than offset an increase in SG&A expenses tied to digital transformation (DX) initiatives and rising labor costs. Operating profit of ¥4,942 million was 12.3% above the initial forecast of ¥4,400 million and 8.6% above the revised forecast of ¥4,550 million. The operating margin was 3.9%, compared with 4.2% in FY10/24. The average exchange rate used for the period was JPY 148.88 per USD, versus JPY 142.73 per USD in FY10/24.
| Item | FY10/24 (Actual) | FY10/25 (Actual) | YoY Change |
|---|---|---|---|
| Net sales | 115,208 | 124,897 | +8.4% |
| Gross profit | 18,617 | 19,649 | - |
| Operating profit | 4,844 | 4,942 | +2.0% |
| Ordinary profit | 4,950 | 4,992 | +0.8% |
| Profit attributable to owners of parent | 3,170 | 3,035 | -4.2% |
| Operating margin | 4.2% | 3.9% | - |
Segment Results
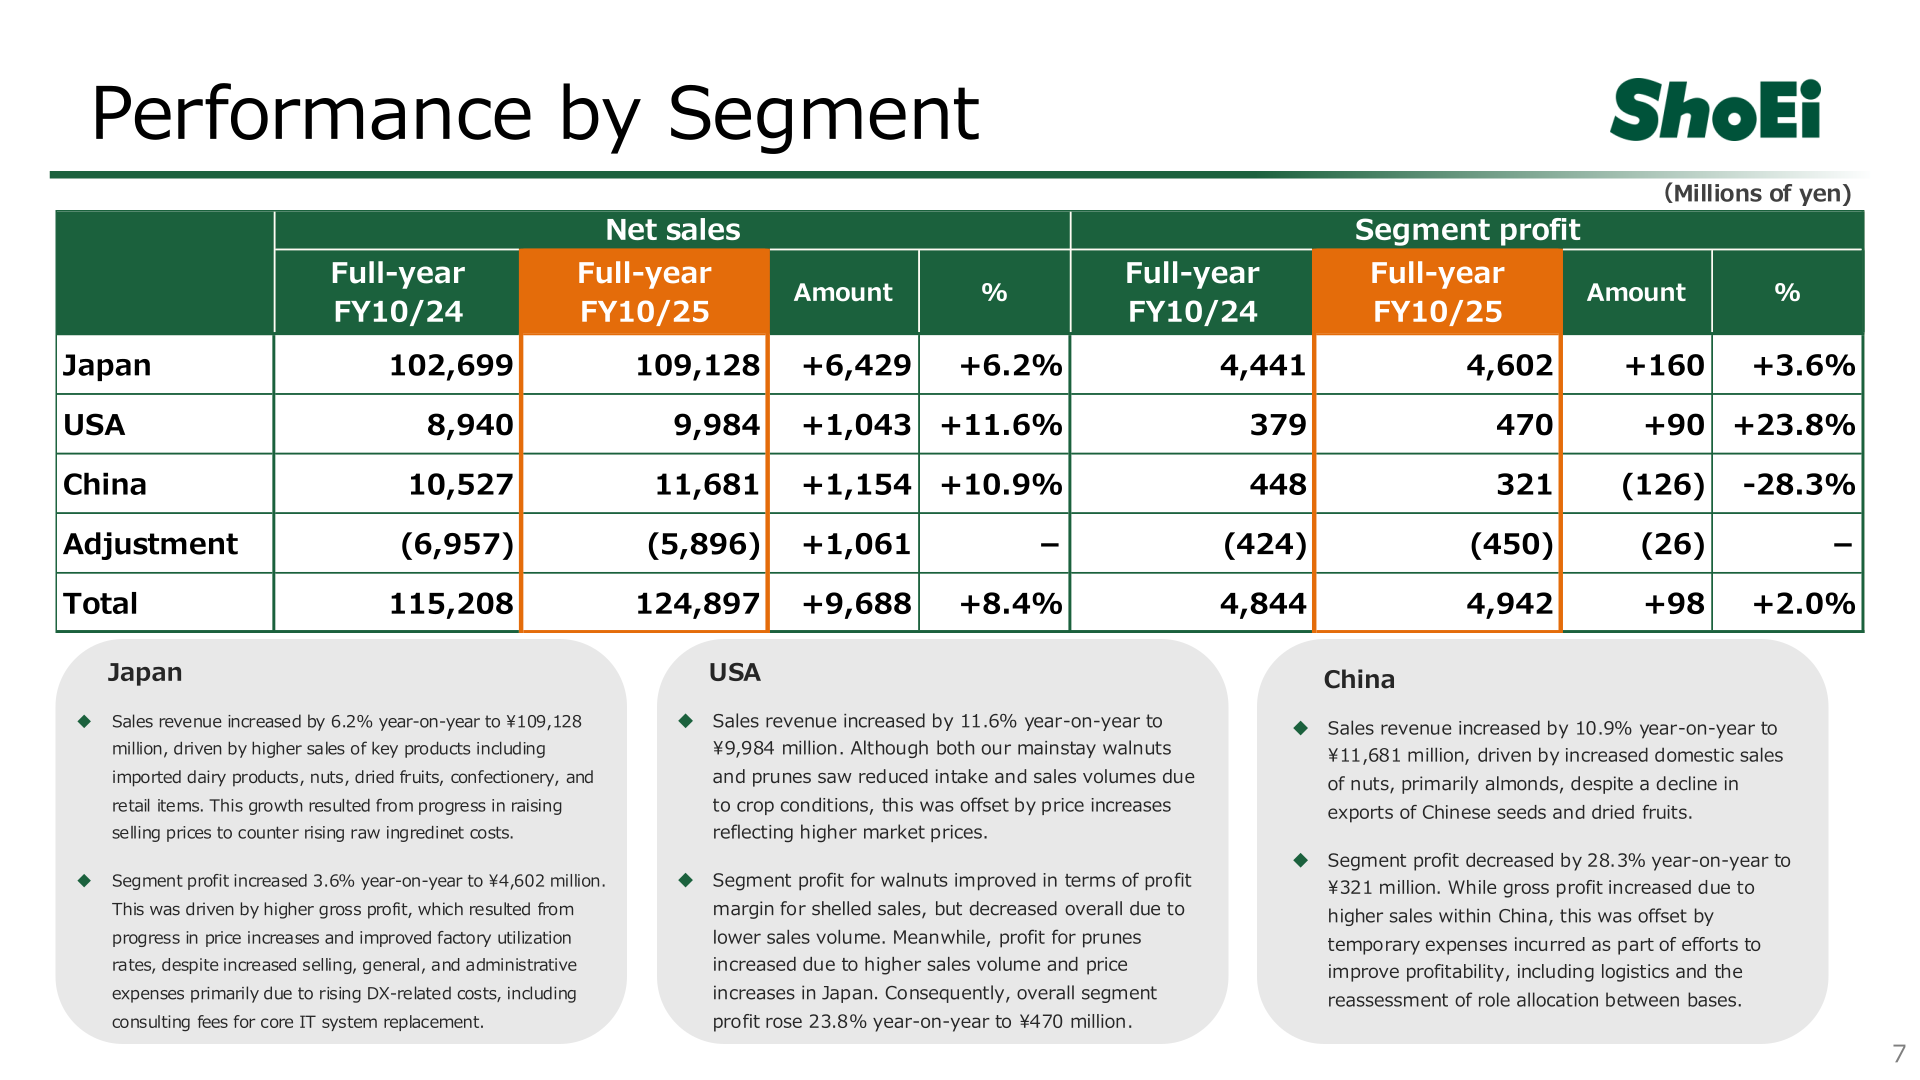
Sales revenue increased in Japan by 6.2% year on year to ¥109,128 million, driven by higher sales of imported dairy products, nuts, dried fruits, confectionery and retail items, with segment profit up 3.6% to ¥4,602 million on higher gross profit from price increases and improved factory utilization, despite higher SG&A related to core IT system replacement consulting fees. In the USA, sales rose 11.6% to ¥9,984 million as price increases reflecting higher market prices offset reduced walnut and prune intake and sales volumes due to crop conditions; segment profit rose 23.8% to ¥470 million. In China, sales increased 10.9% to ¥11,681 million on higher domestic sales of nuts, mainly almonds, despite a decline in exports of Chinese seeds and dried fruits, but segment profit fell 28.3% to ¥321 million due to temporary expenses for logistics improvements and role reallocation between bases.
| Segment | Net Sales FY10/24 | Net Sales FY10/25 | Net Sales YoY | Segment Profit FY10/24 | Segment Profit FY10/25 | Segment Profit YoY |
|---|---|---|---|---|---|---|
| Japan | 102,699 | 109,128 | +6.2% | 4,441 | 4,602 | +3.6% |
| USA | 8,940 | 9,984 | +11.6% | 379 | 470 | +23.8% |
| China | 10,527 | 11,681 | +10.9% | 448 | 321 | -28.3% |
| Adjustment | (6,957) | (5,896) | - | (424) | (450) | - |
| Total | 115,208 | 124,897 | +8.4% | 4,844 | 4,942 | +2.0% |
Sales by Product Category
By product category, sales of dried fruits and canned foods rose 11.4% year on year to ¥44,763 million, the largest category at 35.9% of total sales, reflecting higher unit prices for almonds, walnuts, coconuts and raisins in Japan and China and higher sales of walnuts and prunes in the United States. Dairy products, oils and fats rose 7.3% to ¥38,595 million on price increases for imported and domestically produced dairy items. Confectionery raw ingredients rose 6.7% to ¥20,648 million, and confectionery and retail products rose 6.9% to ¥20,878 million on higher sales of NB and PB chocolate confections reflecting rising cocoa ingredient prices.
| Category | Net Sales FY10/24 | % of Total FY10/24 | Net Sales FY10/25 | % of Total FY10/25 | YoY Change |
|---|---|---|---|---|---|
| Dairy products, oils and fats | 35,937 | 31.2% | 38,595 | 30.9% | +7.3% |
| Confectionery raw ingredients | 19,339 | 16.8% | 20,648 | 16.5% | +6.7% |
| Dried fruits and canned foods | 40,174 | 34.9% | 44,763 | 35.9% | +11.4% |
| Confectionery and retail products | 19,524 | 16.9% | 20,878 | 16.7% | +6.9% |
| Other | 232 | 0.2% | 12 | 0.0% | -94.5% |
| Total | 115,208 | 100.0% | 124,897 | 100.0% | +8.4% |
FY10/2026 Forecast
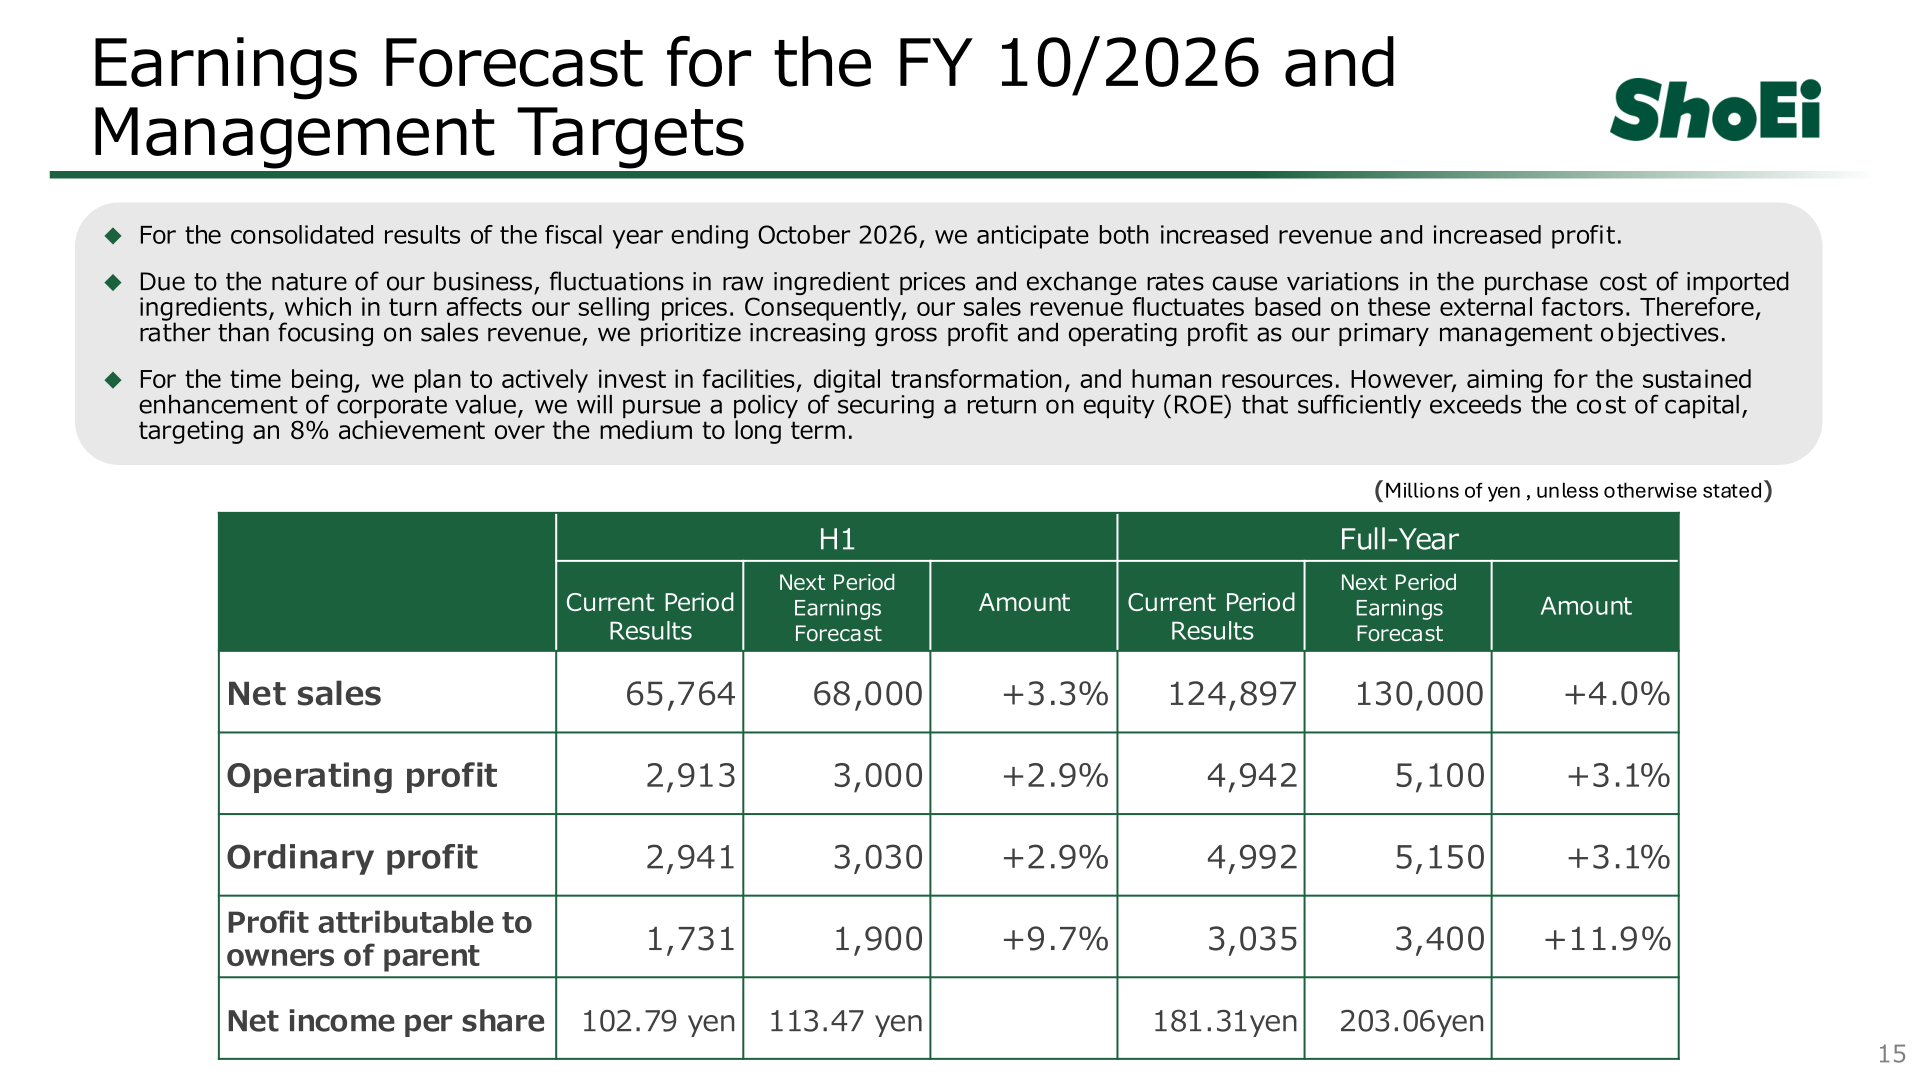
For the fiscal year ending October 31, 2026 (FY10/26), Shoei Foods forecasts continued growth in both revenue and profit. The company states that because fluctuations in raw ingredient prices and exchange rates affect the purchase cost of imported ingredients and, in turn, its selling prices, it prioritizes gross profit and operating profit over net sales as its primary management objectives. The company plans to actively invest in facilities, digital transformation and human resources for the time being, while pursuing an ROE that sufficiently exceeds its cost of capital, targeting an 8% achievement over the medium to long term. Planned capital investment for FY10/26 is approximately ¥3.3 billion (approximately ¥2.7 billion for tangible fixed assets and approximately ¥0.6 billion for intangible fixed assets), up from approximately ¥1.8 billion in FY10/25, directed mainly at production-efficiency upgrades at manufacturing subsidiaries in Japan and overseas and at IT investment to promote DX.
| Item | FY10/25 (Actual) | FY10/26 (Forecast) | Change |
|---|---|---|---|
| Net sales | 124,897 | 130,000 | +4.0% |
| Operating profit | 4,942 | 5,100 | +3.1% |
| Ordinary profit | 4,992 | 5,150 | +3.1% |
| Profit attributable to owners of parent | 3,035 | 3,400 | +11.9% |
| Net income per share (yen) | 181.31 | 203.06 | - |
Capital Efficiency (ROE) Target
Shoei Foods estimates its cost of equity at 4.5%–5.0% using the CAPM model, based on a risk-free rate (Japanese long-term interest rate) of 1.7%–1.9%, a beta of around 0.5, and a market risk premium of 5.5%–6.0% derived from TOPIX data. ROE was 5.6% in FY10/25, unchanged from FY10/23 and down from 6.0% in FY10/24. The company recognizes the need for further improvement in the equity spread (ROE minus cost of equity) and remains committed to increasing ROE and reducing its cost of equity, targeting an 8% ROE achievement over the medium to long term.
Shareholder Returns
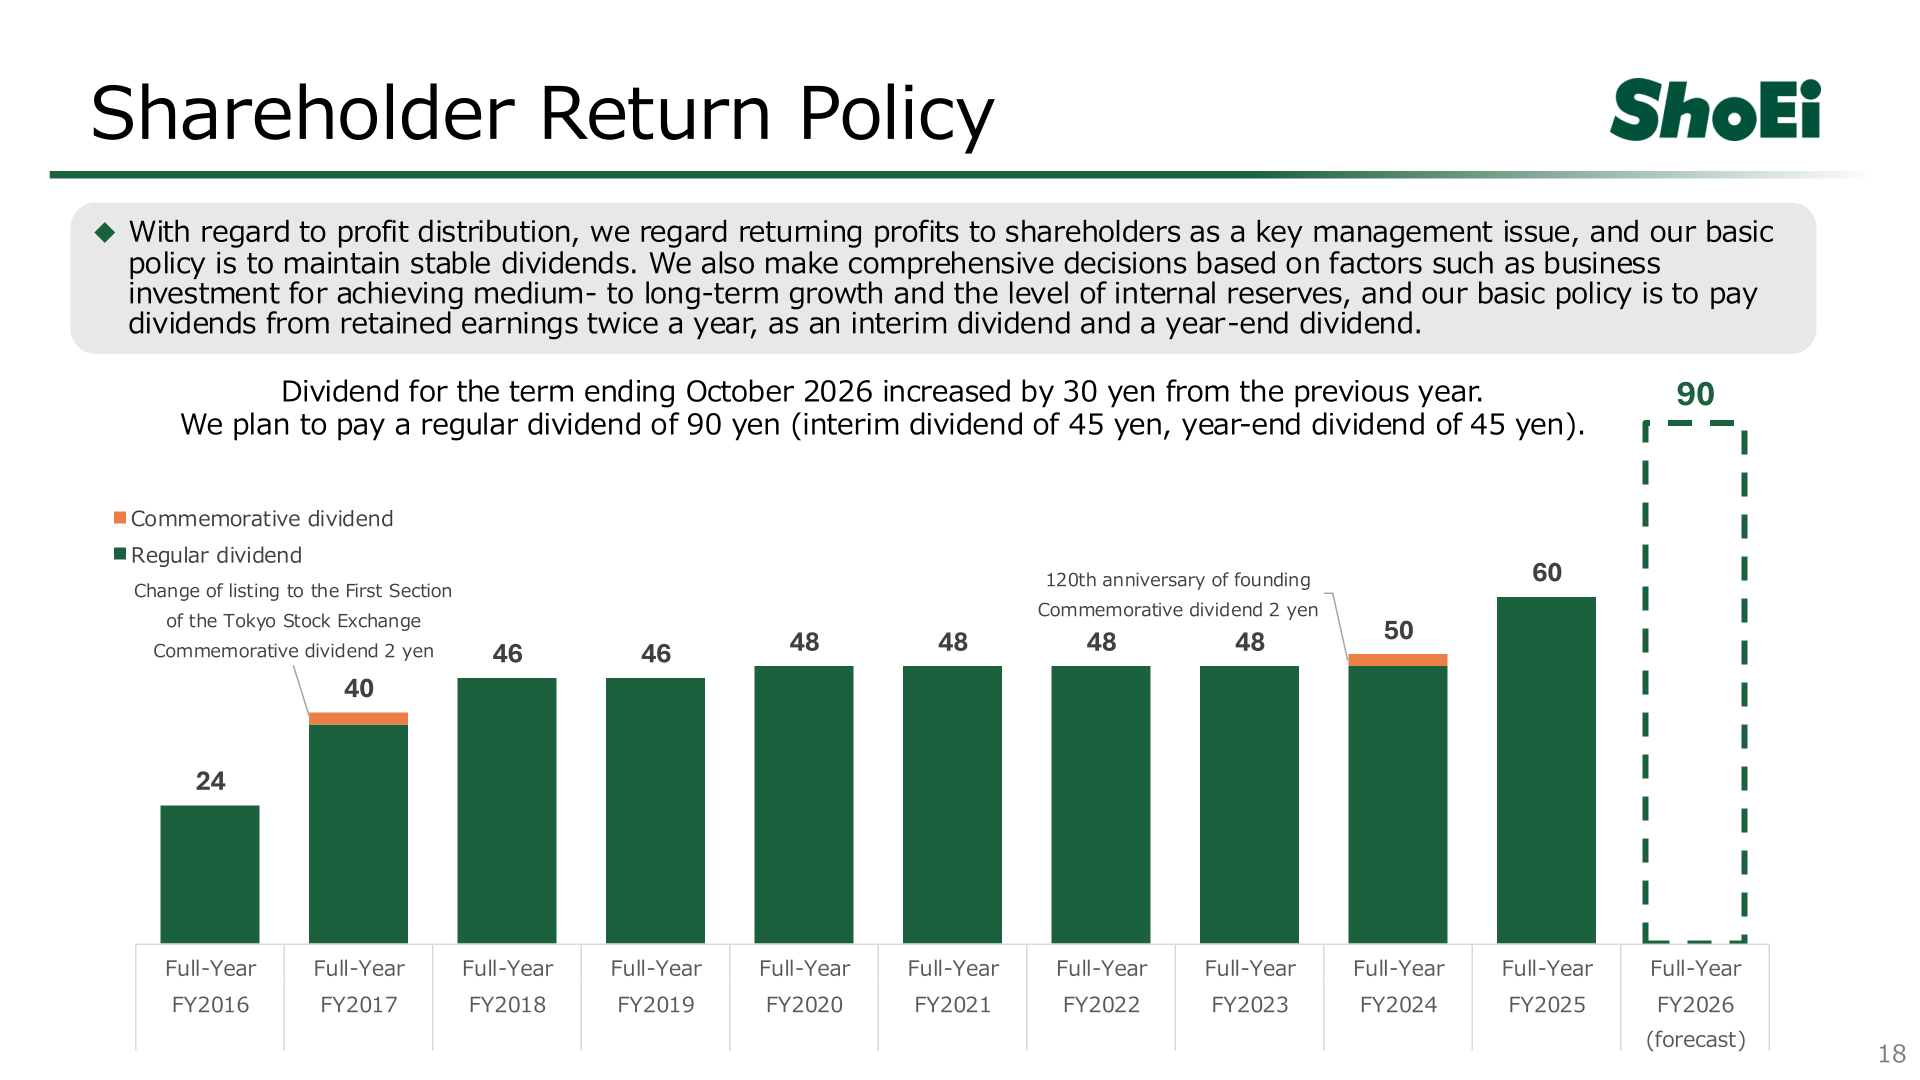
Shoei Foods regards returning profits to shareholders as a key management issue and maintains a basic policy of stable dividends, paid twice a year as an interim dividend and a year-end dividend, based on a comprehensive assessment of business investment for medium- to long-term growth and the level of internal reserves. The full-year dividend for FY10/25 was ¥60 per share. For FY10/26, the company plans to pay a regular dividend of ¥90 per share (an interim dividend of ¥45 and a year-end dividend of ¥45), an increase of ¥30 from the previous year.
This article is an analysis based on publicly available information and is not a recommendation to buy or sell any specific securities. Investment decisions are your own responsibility.
















