
This article is based on publicly available IR materials and is not a recommendation to buy or sell any specific securities.
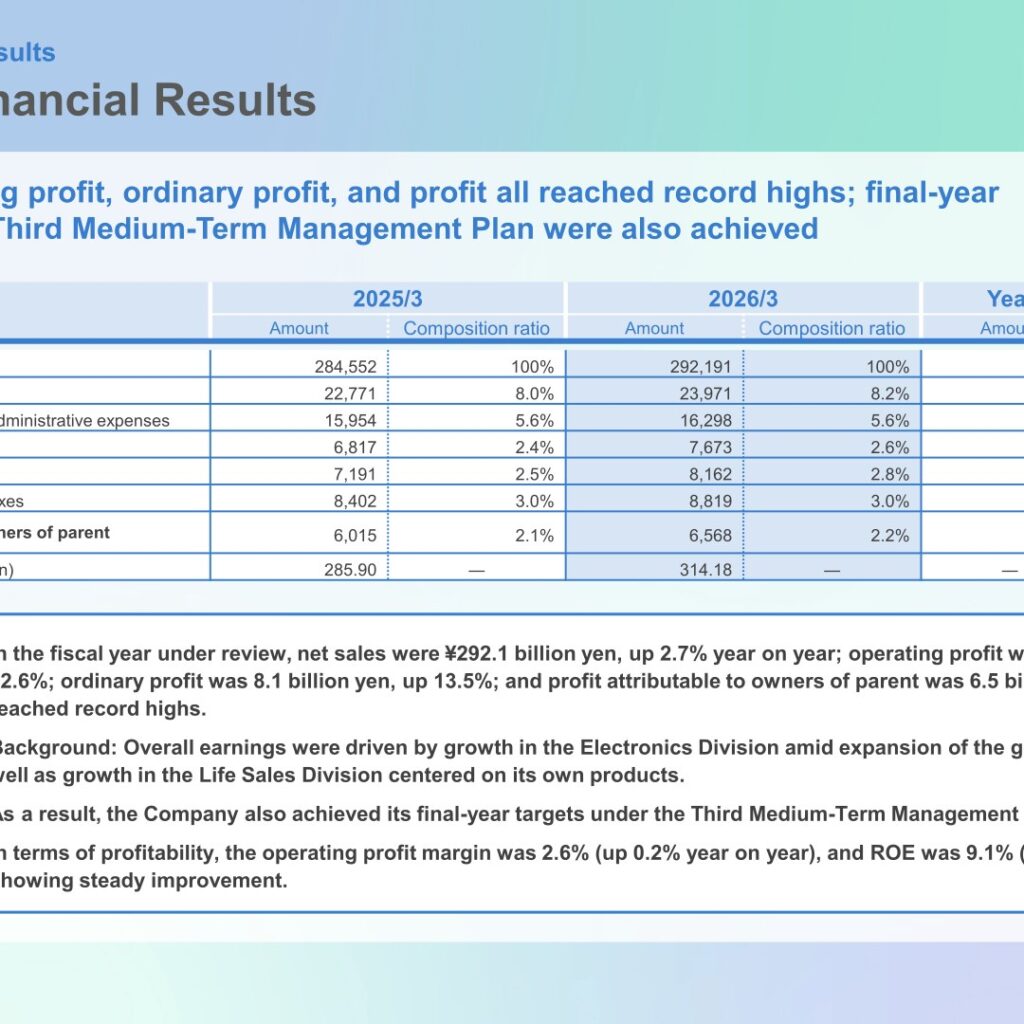
Sato Shoji Corporation, an independent metal and materials trading company, reported record-high consolidated results for the fiscal year ended March 31, 2026 (2026/3): net sales of ¥292,191 million (up 2.7% year on year), operating profit of ¥7,673 million (up 12.6%), ordinary profit of ¥8,162 million (up 13.5%), and profit attributable to owners of parent of ¥6,568 million (up 9.2%). The company said net sales, operating profit, ordinary profit and profit all reached record highs, driven mainly by growth in the Electronics Division amid expansion of the generative AI market and growth in the Life Sales Division centered on its own products. With these results, the company also achieved the final-year targets of its Third Medium-Term Management Plan. For the fiscal year ending March 31, 2027 (2027/3), the company forecasts continued growth in net sales and operating profit and plans to raise its annual dividend to 87 yen per share from 82 yen.
Note: The presentation labels the fiscal year ended March 31, 2026 as “2026/3” and the following fiscal year as “2027/3,” without using “FY” notation. This article follows japan-equity.com’s convention of referring to the most recently completed full year as FY2025 in the title and elsewhere, while the tables below retain the presentation’s own “2025/3” / “2026/3” / “2027/3” period labels.
Consolidated Results (Full-Year Actual)
Net sales, operating profit, ordinary profit and profit attributable to owners of parent all reached record highs in 2026/3. The operating profit margin was 2.6% (up 0.2% year on year), and ROE was 9.1% (up 0.1% year on year), which the company describes as steady improvement.
| Item (Millions of yen) | 2025/3 | 2026/3 | YoY Change |
|---|---|---|---|
| Net sales | 284,552 | 292,191 | +7,639 (+2.7%) |
| Gross profit | 22,771 | 23,971 | +1,200 (+5.3%) |
| Selling, general and administrative expenses | 15,954 | 16,298 | +344 (+2.2%) |
| Operating profit | 6,817 | 7,673 | +856 (+12.6%) |
| Ordinary profit | 7,191 | 8,162 | +971 (+13.5%) |
| Profit before income taxes | 8,402 | 8,819 | +417 (+5.0%) |
| Profit attributable to owners of parent | 6,015 | 6,568 | +553 (+9.2%) |
| Earnings per share (yen) | 285.90 | 314.18 | ― |
Segment Results
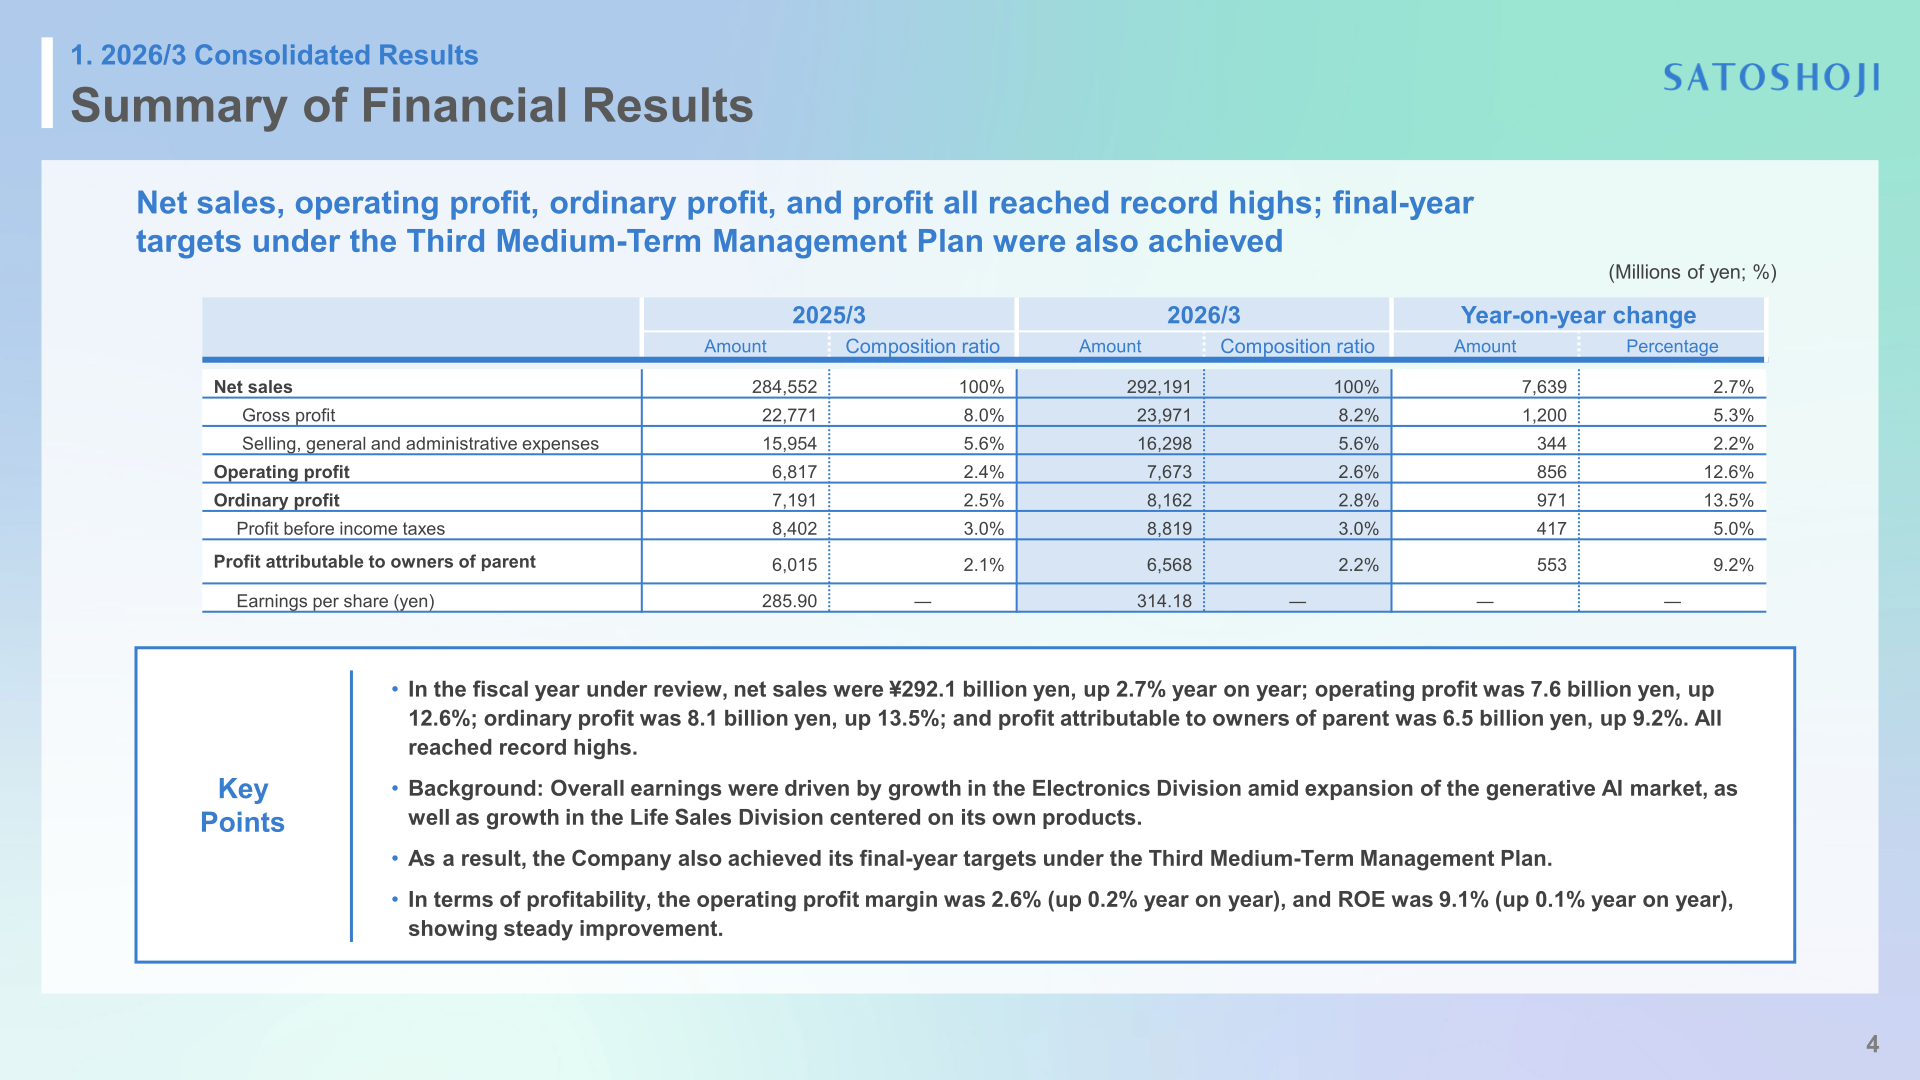
Electronics and Life Sales drove results, while Iron and Steel was sluggish. The Electronics Business posted a significant increase in both net sales and profit, with net sales up 20.8% year on year and operating profit up 44.0%, supported by expanding demand for materials for communications infrastructure and semiconductor-related materials amid growth of the generative AI market. The Life Sales Business also maintained high growth, with net sales up 18.0% and operating profit up 47.4%, increasing its contribution to earnings. In the Iron and Steel Division, net sales declined 1.2% and operating profit fell 8.0%; although sales volume remained solid, the impact on unit prices from lower material prices led to a decrease in both net sales and profit. In the Non-ferrous Metals Division, net sales decreased 3.1%, while profit increased significantly by 42.8%, reflecting progress in improving profitability. The Machinery and Tools Business recorded lower net sales, from ¥6,889 million to ¥6,254 million, due to the absence of large projects posted in the previous fiscal year, resulting in an operating loss.
| Segment (Millions of yen) | Net Sales 2025/3 | Net Sales 2026/3 | Change |
|---|---|---|---|
| Iron and Steel | 177,897 | 175,823 | (2,074) |
| Non-ferrous Metals | 41,954 | 40,657 | (1,297) |
| Electronics | 43,633 | 52,689 | 9,056 |
| Life Sales | 9,744 | 11,498 | 1,754 |
| Machinery and Tools | 6,889 | 6,254 | (635) |
| Business Development | 4,433 | 5,267 | 834 |
| Total | 284,552 | 292,191 | 7,639 |
Financial Position
Total assets at the end of the fiscal year were ¥181,208 million, an increase of ¥10,065 million from the end of the previous fiscal year, mainly due to higher trade receivables and expanded unrealized gains on investment securities; accounts and other receivables increased by approximately ¥2.5 billion and investment securities increased by approximately ¥4.9 billion. Total liabilities increased by ¥1,575 million, only a slight increase. Net assets were ¥76,945 million, an increase of ¥8,491 million, mainly reflecting an increase in retained earnings of approximately ¥4.9 billion and a rise in valuation difference on available-for-sale securities of approximately ¥3.4 billion, driven in particular by expanded valuation gains from the rise in the stock market. The equity ratio improved to 42.3% from 39.8%. Cash flows from operating activities were ¥1,386 million (down from ¥2,139 million), reflecting an increase in working capital driven by sales growth. Cash flows from investing activities were ¥(1,373) million, including capital expenditure of ¥2,288 million (down from ¥4,303 million) and proceeds from sale of investment securities of ¥1,050 million. Cash flows from financing activities were ¥1,774 million, with the main factors being an increase in short-term borrowings (up approximately ¥8.6 billion), repayment of long-term borrowings (down approximately ¥4.5 billion), dividend payments of ¥1,682 million (down approximately ¥1.6 billion), and repurchase of treasury stock (down approximately ¥0.7 billion). As a result, cash and cash equivalents at the end of the period were ¥5,977 million, up approximately ¥2,065 million from the previous fiscal year.
| Item (Millions of yen) | 2025/3 | 2026/3 | YoY Change |
|---|---|---|---|
| Total assets | 171,143 | 181,208 | 10,065 |
| Total liabilities | 102,688 | 104,262 | 1,575 |
| Total net assets | 68,454 | 76,945 | 8,491 |
| Equity ratio | 39.8% | 42.3% | +2.5pt |
FY2026 Forecast (Fiscal Year Ending March 31, 2027)
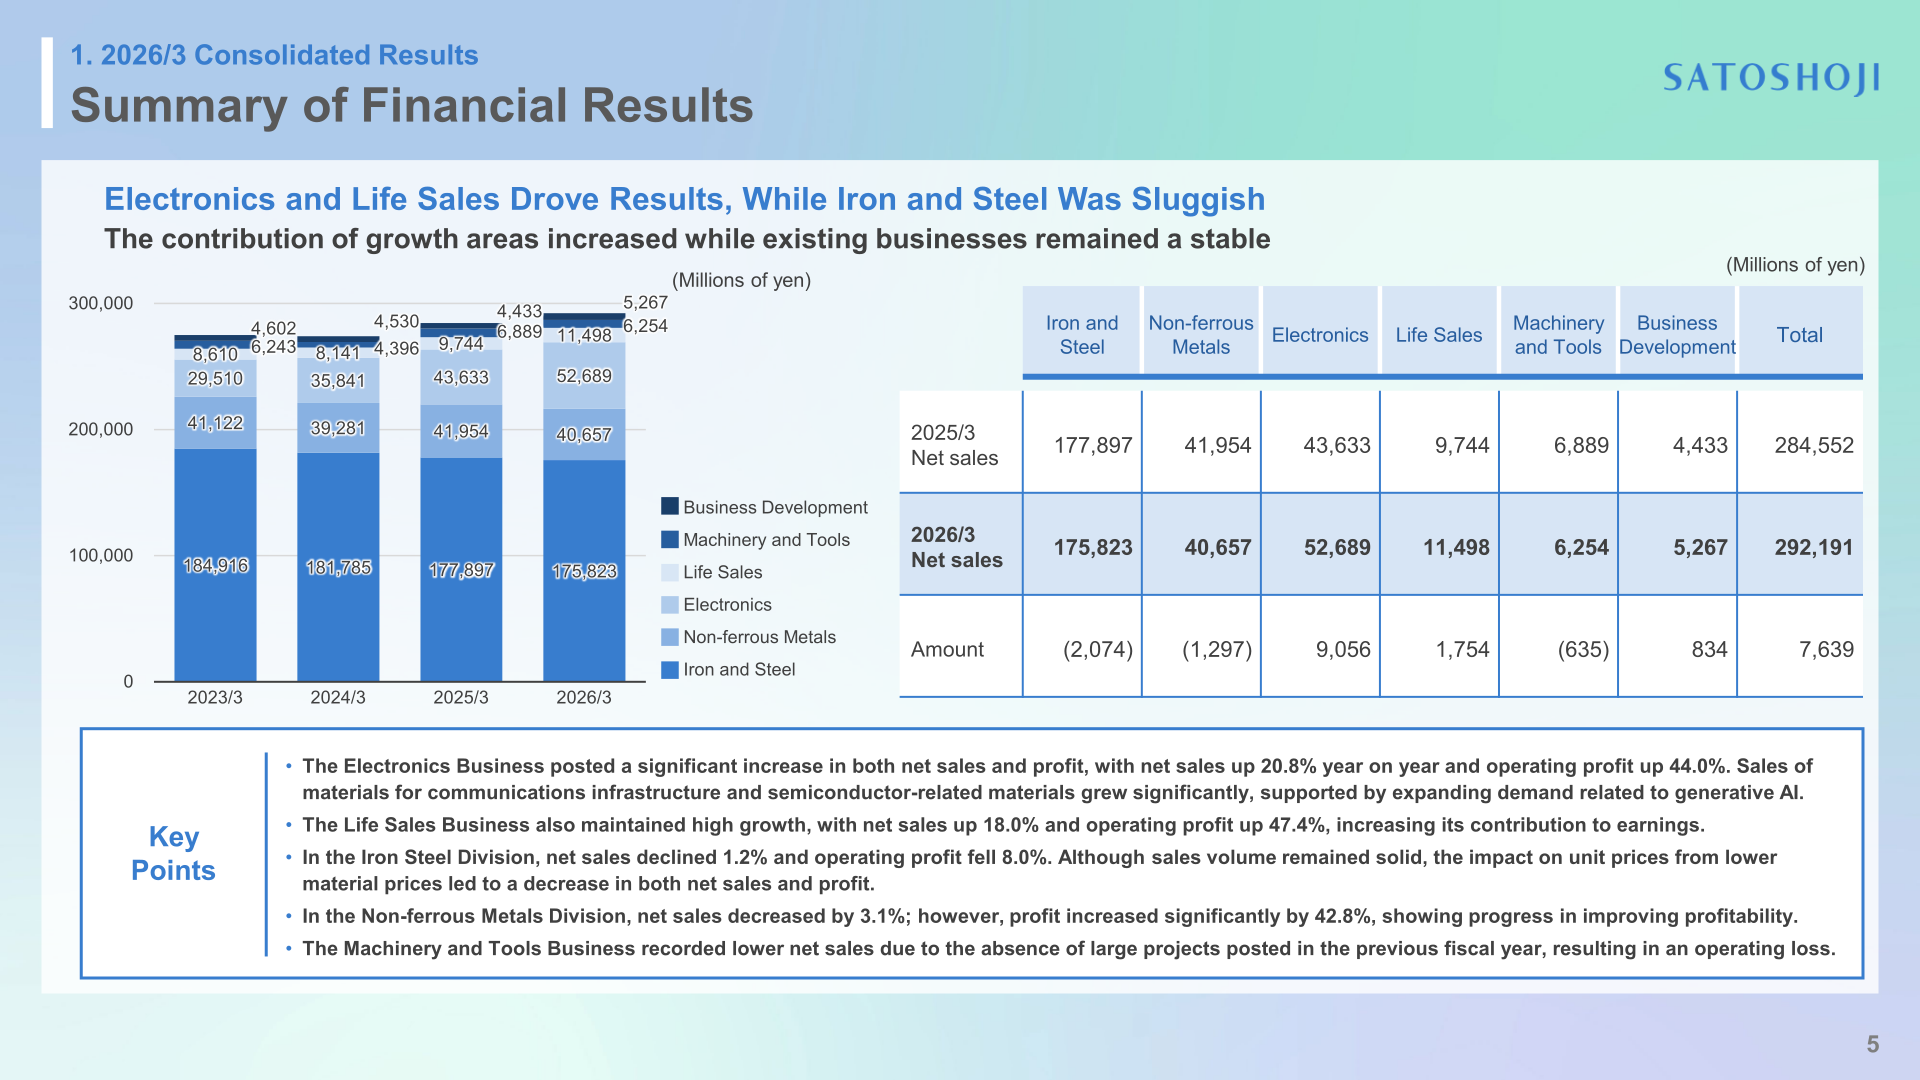
The company plans to continue growing both revenue and profit, with net sales expected to reach ¥305,000 million (up 4.4% year on year) and operating profit reaching ¥8,300 million (up 8.2%). Conversely, profit attributable to owners of parent is projected to remain virtually flat year on year at ¥6,600 million (up 0.5%). The company attributes this to the recognition of actuarial gains and losses related to retirement benefit accounting in the previous fiscal year, driven by factors such as rising long-term interest rates and higher share prices.
| Item (Millions of yen) | 2026/3 (Actual) | 2027/3 (Forecast) | YoY Change |
|---|---|---|---|
| Net sales | 292,191 | 305,000 | +12,809 (+4.4%) |
| Operating profit | 7,673 | 8,300 | +627 (+8.2%) |
| Ordinary profit | 8,162 | 8,600 | +438 (+5.4%) |
| Profit attributable to owners of parent | 6,568 | 6,600 | +32 (+0.5%) |
| Earnings per share (yen) | 314.18 | 315.67 | ― |
Shareholder Returns
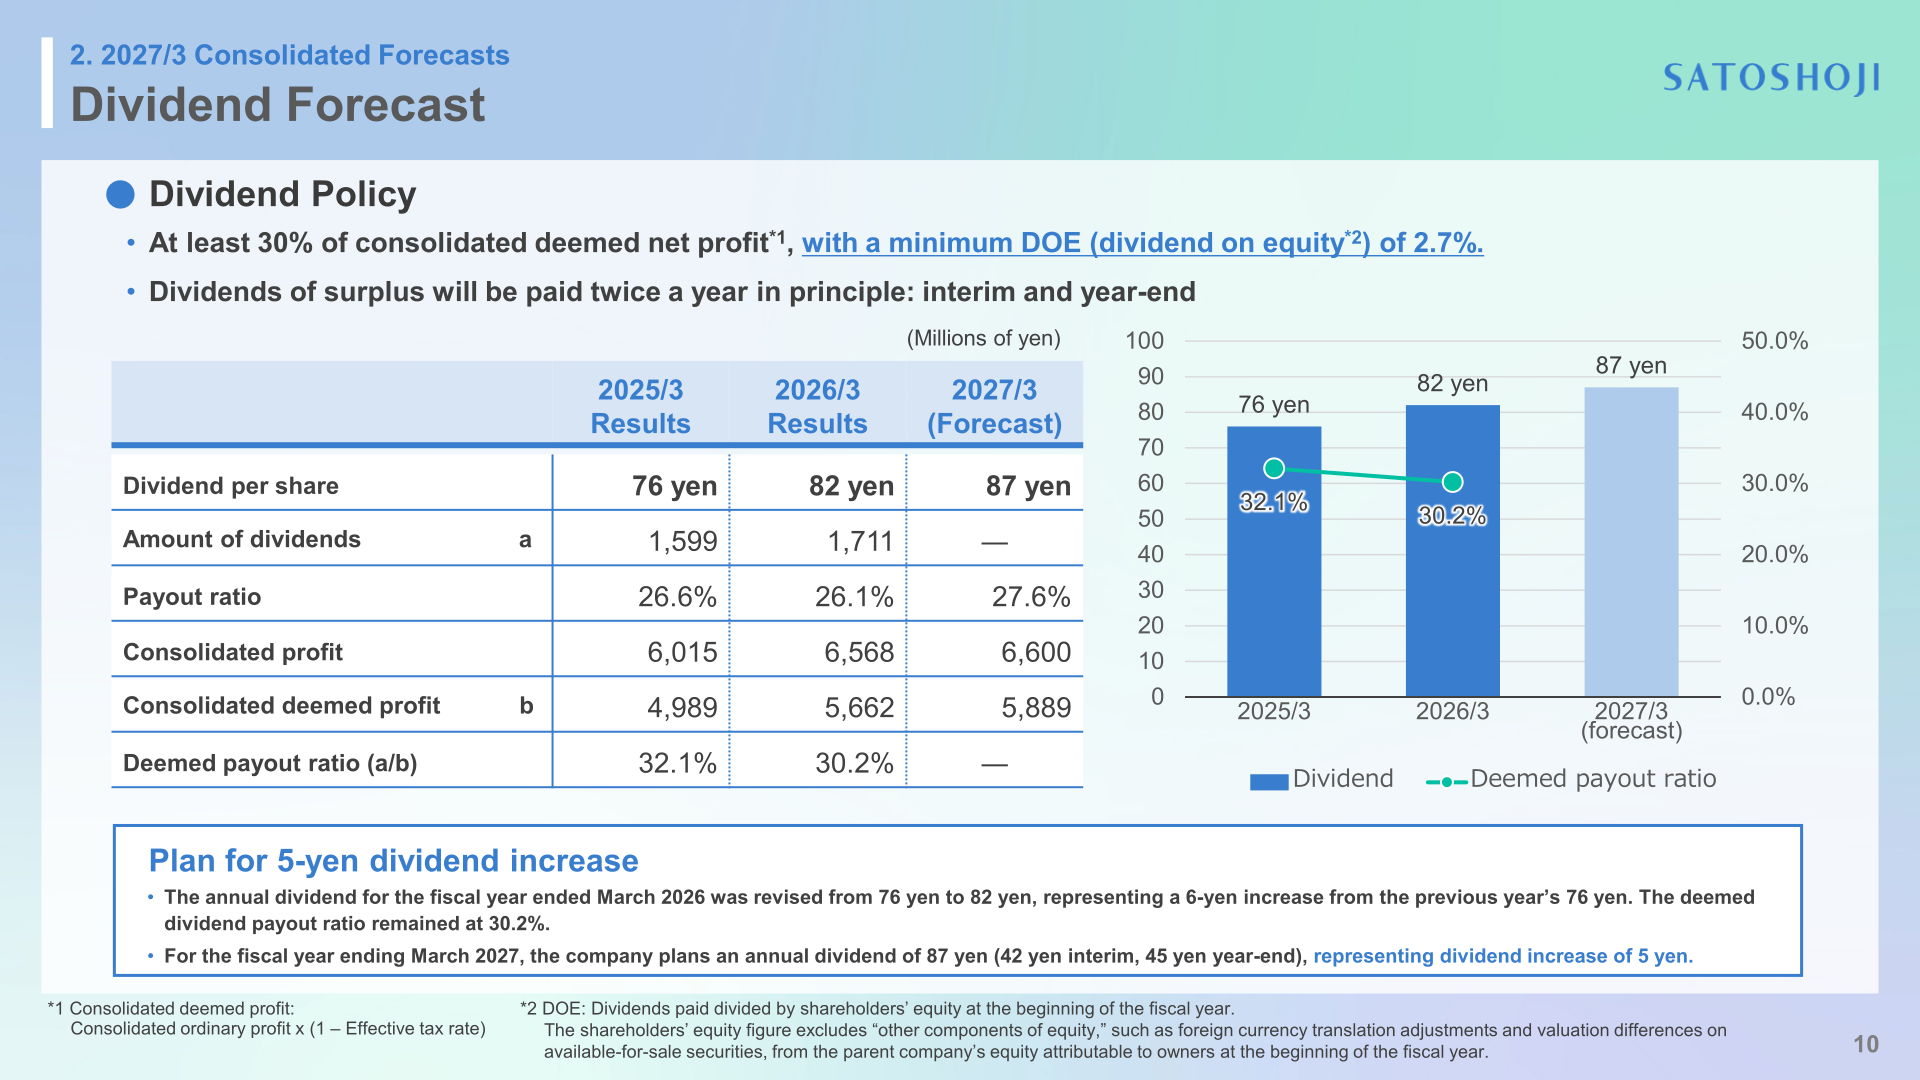
The company’s dividend policy targets a payout of at least 30% of consolidated deemed net profit (defined as consolidated ordinary profit multiplied by one minus the effective tax rate), with a minimum dividend on equity (DOE) of 2.7%; dividends of surplus are paid twice a year in principle, at the interim and year-end. The annual dividend for the fiscal year ended March 2026 was revised from a planned 76 yen to 82 yen, a 6-yen increase from the previous fiscal year’s 76 yen, while the deemed dividend payout ratio remained at 30.2%. For the fiscal year ending March 2027, the company plans an annual dividend of 87 yen per share (42 yen interim, 45 yen year-end), a 5-yen increase.
| Item | 2025/3 (Actual) | 2026/3 (Actual) | 2027/3 (Forecast) |
|---|---|---|---|
| Dividend per share (yen) | 76 | 82 | 87 |
| Amount of dividends (Millions of yen) | 1,599 | 1,711 | ― |
| Payout ratio | 26.6% | 26.1% | 27.6% |
| Consolidated profit (Millions of yen) | 6,015 | 6,568 | 6,600 |
| Consolidated deemed profit (Millions of yen) | 4,989 | 5,662 | 5,889 |
| Deemed payout ratio | 32.1% | 30.2% | ― |
Policy for Equity Holdings
The Board of Directors reviews the rationale for equity holdings twice a year, taking a holistic view of factors such as dividends, business transactions and cost of capital; holdings deemed inappropriate to maintain are slated for reduction. During the fiscal year, three listed shares totaling ¥24 million that were not held for pure investment purposes were sold, and, following the sale of four holdings totaling ¥210 million, listed shares decreased from 36 to 32 and unlisted shares decreased from 18 to 14. One listed share scheduled for sale once terms are finalized has been reclassified as a pure investment holding. As of March 31, 2026, the percentage of consolidated net assets held in stock investments for purposes other than pure investment was 19.97% (up 1.07 point year on year), comprising 19.40% for listed shares (up 1.19pt year on year) and 0.57% for unlisted shares (down 0.12pt year on year).
Company and Segment Topics
The company achieved the final-year targets of its Third Medium-Term Management Plan in the fiscal year under review. Beginning in the fiscal year ending March 2027, Sato Shoji will establish a new Overseas Operations Department, expanding its business segments from six to seven, aimed at integrating overseas consolidated subsidiaries and tapping into growth markets through overseas business expansion.
This article is an analysis based on publicly available information and is not a recommendation to buy or sell any specific securities. Investment decisions are your own responsibility.
















