
This article is based on publicly available IR materials and is not a recommendation to buy or sell any specific securities.
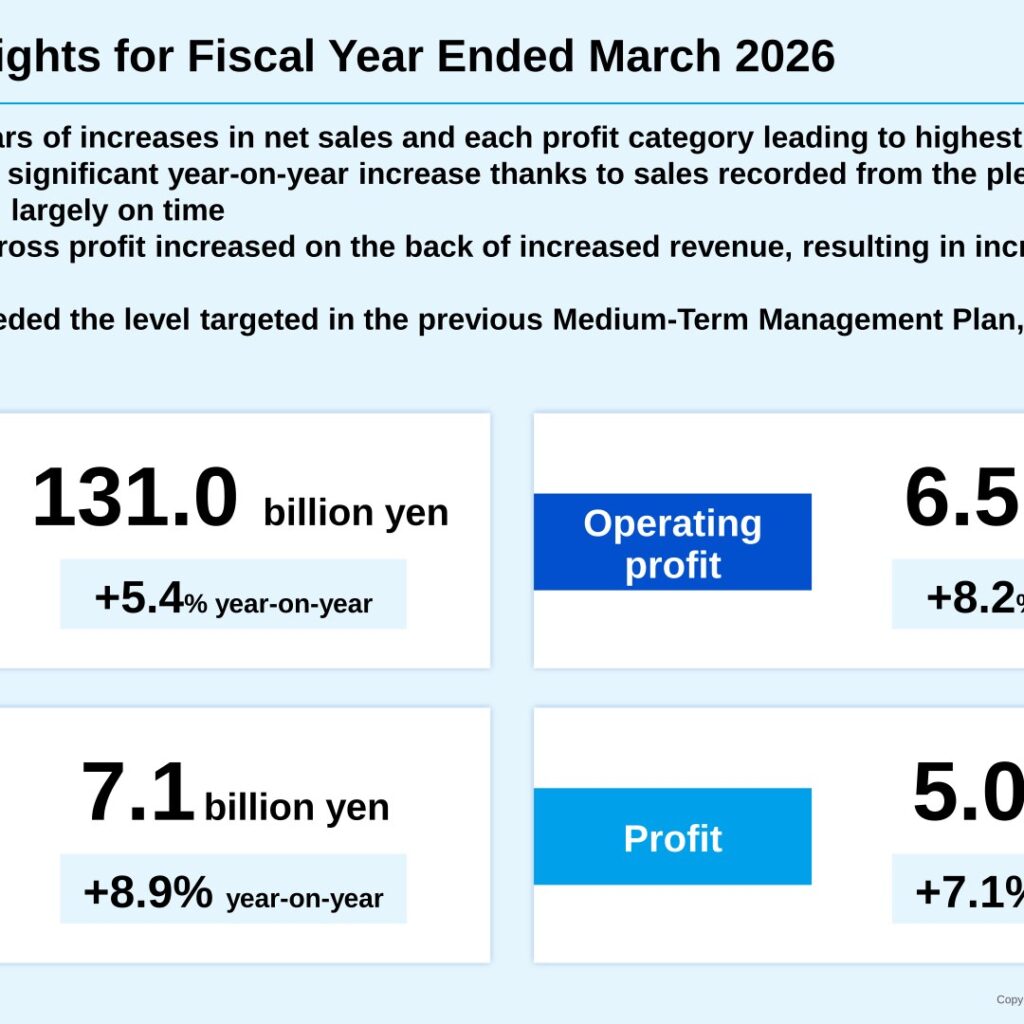
Tsubakimoto Kogyo, an Osaka-based technology trading company founded in 1916 that specializes in power transmission, facility & equipment, and industrial materials, reported its fifth consecutive year of increases in net sales and profit at every level for FY2025 (the fiscal year ended March 31, 2026). Net sales rose 5.4% year on year to ¥131.0 billion, driven by a large order backlog being fulfilled largely on time, while ordinary profit exceeded ¥7.0 billion for the first time. The company also launched a new three-year Medium-Term Management Plan, ATOM2028, and issued an FY2026 (fiscal year ending March 31, 2027) forecast calling for continued, more moderate growth.
Consolidated Results (Full-Year Actual)
Net sales increased 5.4% year on year to ¥131.0 billion, and operating profit, ordinary profit, and profit attributable to owners of parent all rose to record levels, up 8.2%, 8.9%, and 7.1% respectively. The company’s reference tables (Chapter 5 of the materials) label the same fiscal year as “FYE 2026/3,” which refers to the fiscal year ended March 31, 2026 (the period this article calls FY2025, following the company’s own “FY2025” labeling used elsewhere in the materials).
| Item | FYE 2025/3 (Actual) | FYE 2026/3 (Actual) | Year-on-Year Change |
|---|---|---|---|
| Net sales (million yen) | 124,323 | 131,032 | +5.4% |
| Operating profit (million yen) | 6,021 | 6,513 | +8.2% |
| Operating profit margin | 4.8% | 5.0% | +0.1 ppts |
| Ordinary profit (million yen) | 6,513 | 7,094 | +8.9% |
| Ordinary profit margin | 5.2% | 5.4% | +0.2 ppts |
| Profit attributable to owners of parent (million yen) | 4,691 | 5,023 | +7.1% |
| Profit per share (yen) | 252.03 | 273.54 | +8.5% |
| Return on Equity (ROE) | 11.2% | 10.7% | -0.5 ppts |
| Return on Assets (ROA) | 6.7% | 7.1% | +0.4 ppts |
Segment Results
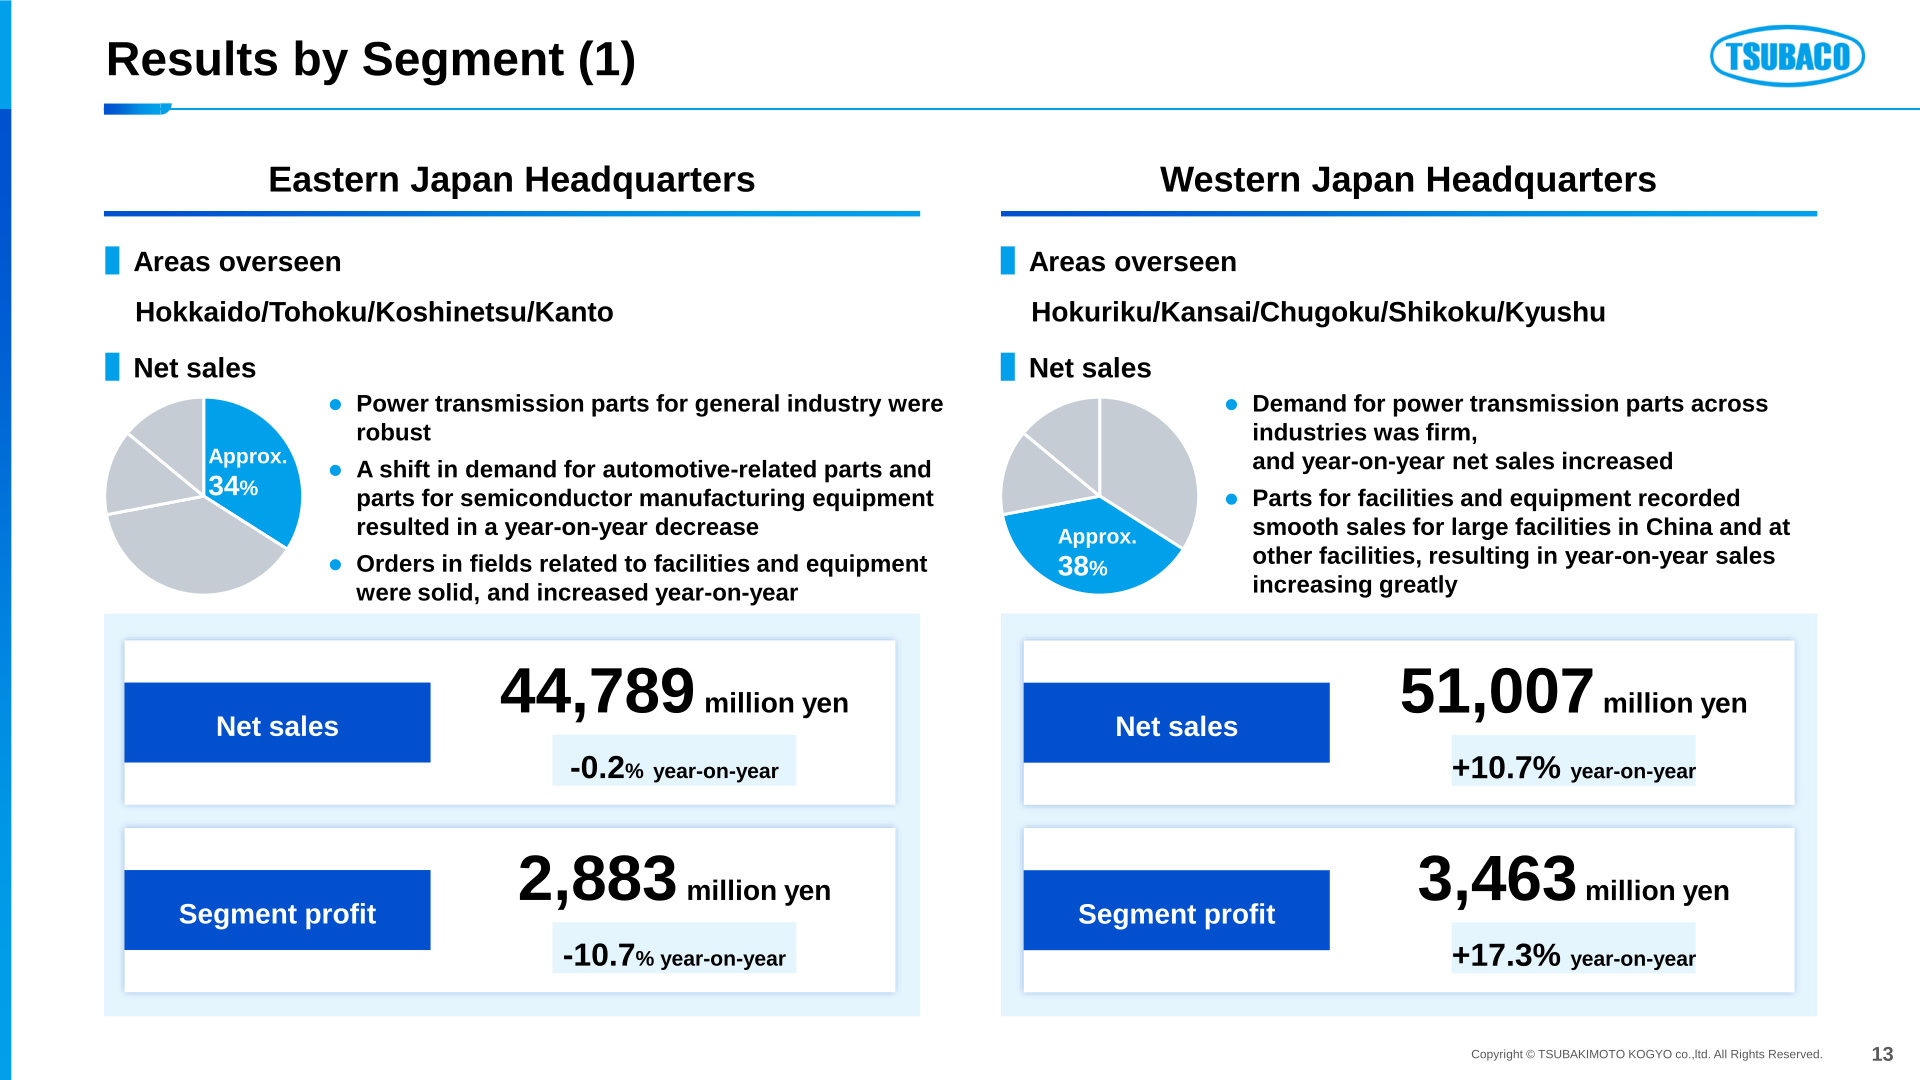
Tsubakimoto Kogyo manages its business through four regional headquarters/centers. Western Japan Headquarters (Hokuriku/Kansai/Chugoku/Shikoku/Kyushu) posted the strongest growth, with net sales up 10.7% on smooth sales of facilities and equipment for large projects in China, and segment profit up 17.3%. Eastern Japan Headquarters (Hokkaido/Tohoku/Koshinetsu/Kanto) was the only area to see a year-on-year decline, as a shift in demand for automotive-related and semiconductor manufacturing equipment parts weighed on results even though power transmission parts and facility-related orders were solid.
| Segment (Areas Overseen) | Net Sales (million yen) | Net Sales YoY | Segment Profit (million yen) | Segment Profit YoY |
|---|---|---|---|---|
| Eastern Japan Headquarters (Hokkaido/Tohoku/Koshinetsu/Kanto) | 44,789 | -0.2% | 2,883 | -10.7% |
| Western Japan Headquarters (Hokuriku/Kansai/Chugoku/Shikoku/Kyushu) | 51,007 | +10.7% | 3,463 | +17.3% |
| Central Japan Headquarters (Tokai) | 19,578 | +7.0% | 1,334 | +18.9% |
| Strategic Business Development Center (overseas and material businesses) | 19,957 | +8.2% | 709 | +29.5% |
By business, Facility & Equipment sales rose 11.9% to ¥63,599 million (48.5% of total net sales), the largest contributor to growth, while Power Transmission sales edged down 0.9% to ¥56,825 million (43.4% of total) and Industrial Materials rose 5.0% to ¥10,607 million (8.1% of total). By region, sales to Asia rose 17.6% to ¥15,490 million (11.8% of total), reflecting high-volume sales of a polarization panel production facility destined for China, while sales to Japan rose 4.5% to ¥113,713 million (86.8% of total) and sales to other regions fell 21.2% to ¥1,829 million (1.4% of total).
| Category | FYE 2026/3 Amount (million yen) | Proportion | Year-on-Year Change |
|---|---|---|---|
| Power Transmission | 56,825 | 43.4% | (0.9%) |
| Facility & Equipment | 63,599 | 48.5% | +11.9% |
| Industrial Materials | 10,607 | 8.1% | +5.0% |
| Total (by Business) | 131,032 | 100.0% | +5.4% |
| Japan | 113,713 | 86.8% | +4.5% |
| Asia | 15,490 | 11.8% | +17.6% |
| Other | 1,829 | 1.4% | (21.2%) |
| Total (by Region) | 131,032 | 100.0% | +5.4% |
FY2026 Forecast
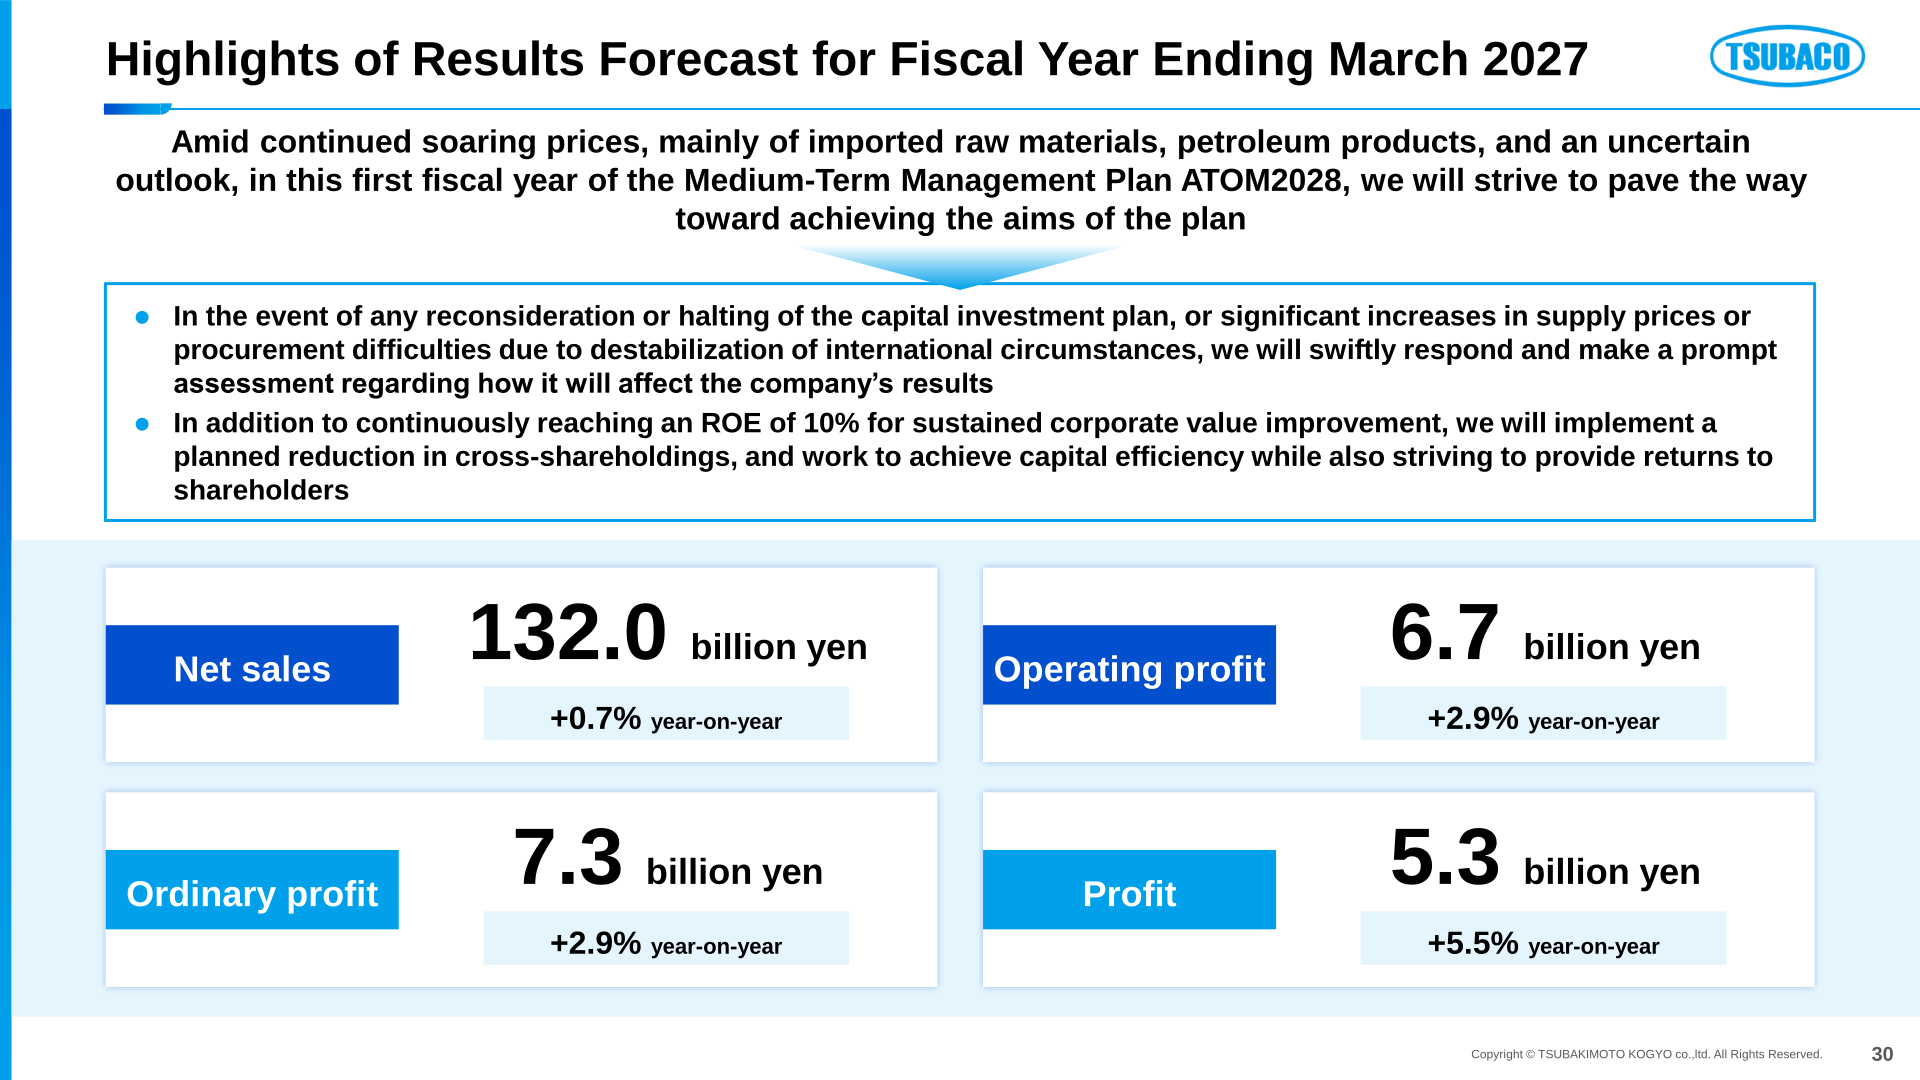
For FY2026 (fiscal year ending March 31, 2027), the first year of the new Medium-Term Management Plan ATOM2028, the company forecasts continued but more moderate growth: net sales of ¥132.0 billion (+0.7%), operating profit of ¥6.7 billion (+2.9%), ordinary profit of ¥7.3 billion (+2.9%), and profit attributable to owners of parent of ¥5.3 billion (+5.5%). The company notes that amid continued soaring prices for imported raw materials and petroleum products and an uncertain outlook, it will respond swiftly to any reconsideration or halting of customers’ capital investment plans or significant increases in supply prices, while continuing to target an ROE of 10% or more, a planned reduction in cross-shareholdings, and shareholder returns.
| Item | FYE 2027/3 (Forecast) | FYE 2026/3 (Actual) | Year-on-Year Change |
|---|---|---|---|
| Net sales (million yen) | 132,000 | 131,032 | +0.7% |
| Operating profit (million yen) | 6,700 | 6,513 | +2.9% |
| Operating profit margin | 5.1% | 5.0% | +0.1 ppts |
| Ordinary profit (million yen) | 7,300 | 7,094 | +2.9% |
| Ordinary profit margin | 5.5% | 5.4% | +0.1 ppts |
| Profit attributable to owners of parent (million yen) | 5,300 | 5,023 | +5.5% |
| Profit per share (yen) | 288.57 | 273.54 | +5.5% |
Medium-Term Management Plan ATOM2028
The company reviewed its previous plan, ATOM2025 (FY2023-FY2025), noting that financial targets were exceeded — ordinary profit excluding special factors reached ¥6.79 billion in FY2025 versus a ¥5.3 billion target set at plan inception, with ROE holding at 10% — while several non-financial targets (persons with specific qualifications, ratio of females in career-track positions) were missed. The new Medium-Term Management Plan ATOM2028 (FY2026-FY2028) is built on three basic strategies: value enhancement in business areas, optimizing capital structure and enhancing shareholder returns, and advancing ESG management. New quantitative targets for FY2028 are net sales of ¥150.0 billion, operating profit of ¥7.5 billion, ordinary profit of ¥8.0 billion, and ROE of 12% or more, with operating profit margin to be kept at 5% or higher even after FY2028.
| Item | FY2025 (Actual) | FY2028 (Target) |
|---|---|---|
| Net sales (billion yen) | 131.0 | 150.0 |
| Operating profit (billion yen) | 6.5 | 7.5 |
| Ordinary profit (billion yen) | 7.1 | 8.0 |
| ROE | 10.7% | 12%+ |
Shareholder Returns
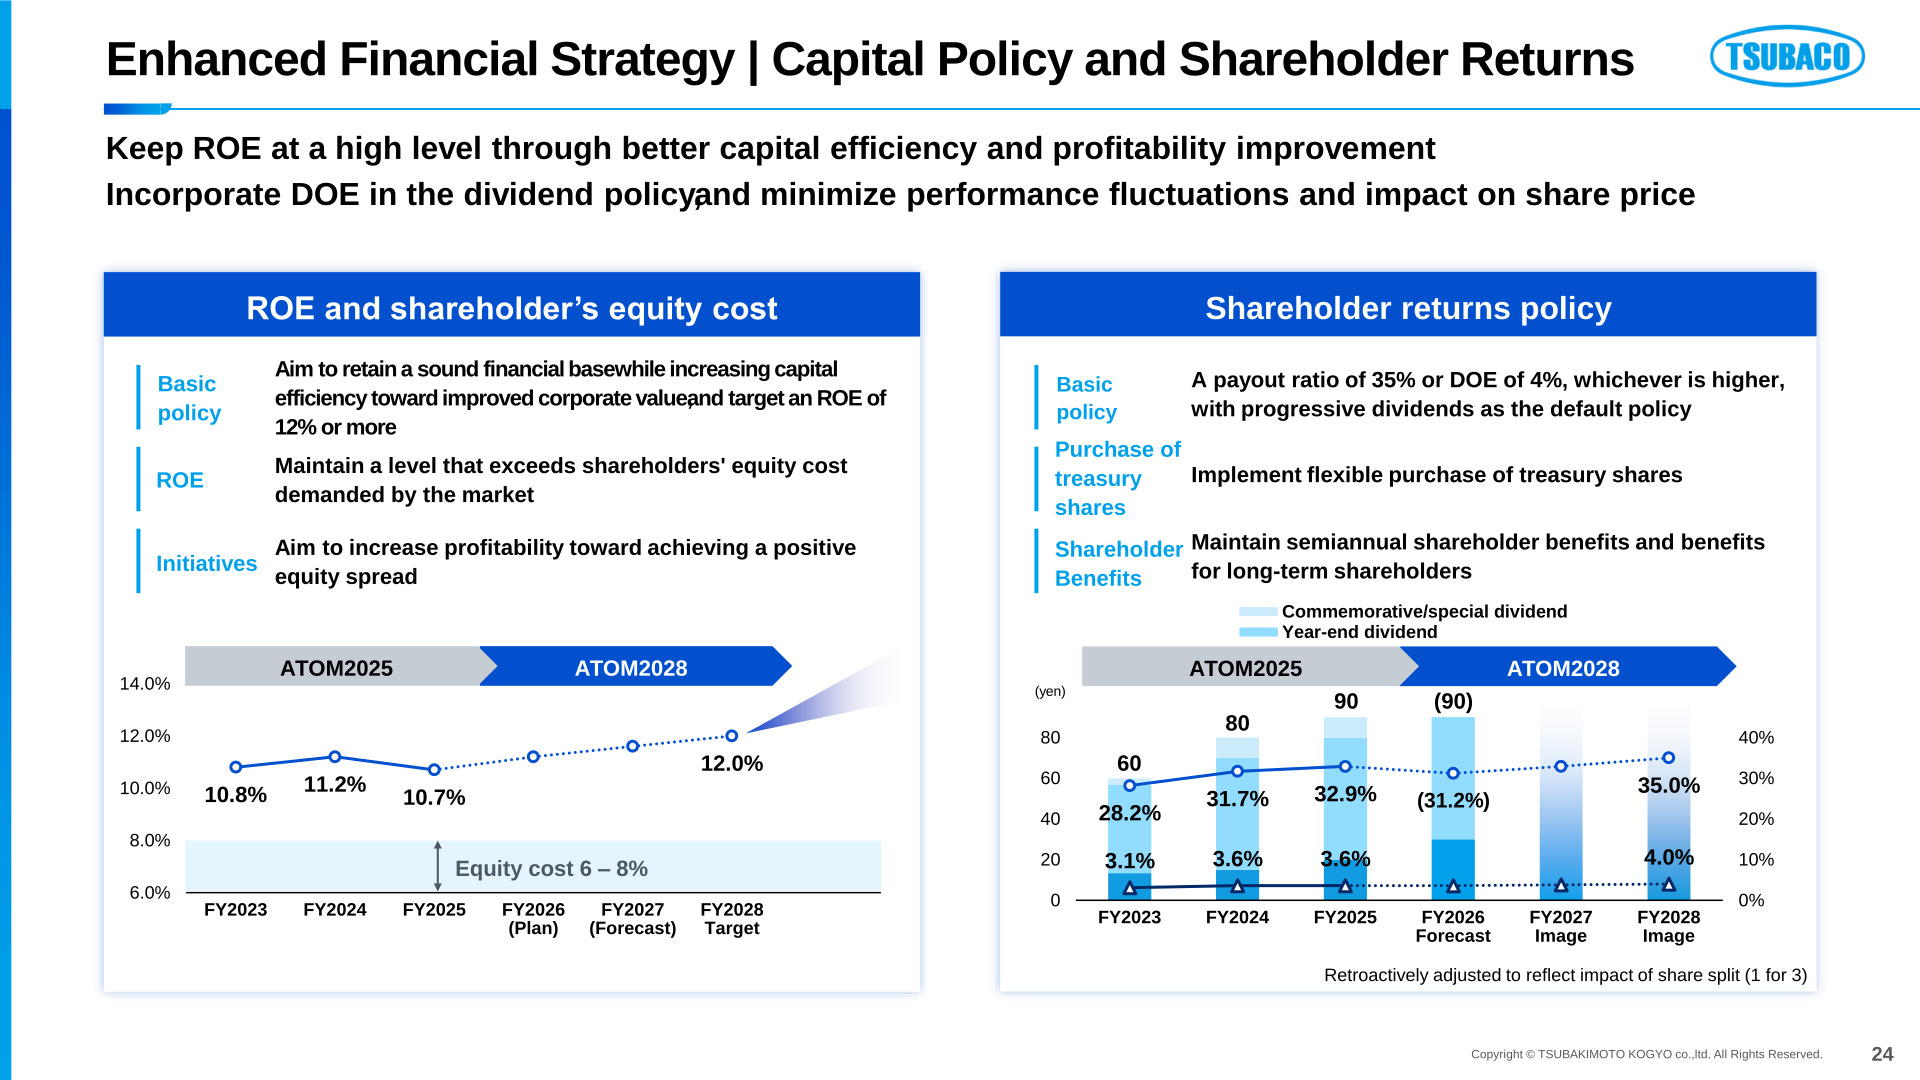
The company’s basic dividend policy under ATOM2028 is a payout ratio of 35% or DOE (dividend on equity ratio) of 4%, whichever is higher, with progressive dividends as the default policy, alongside flexible purchases of treasury shares. Annual dividend per share (retroactively adjusted to reflect the 1-for-3 stock split) rose from ¥60 in FY2023 to ¥80 in FY2024 and ¥90 in FY2025, with the corresponding payout ratio rising from 28.2% to 31.7% to 32.9% and DOE at 3.1%, 3.6%, and 3.6% respectively. For the FY2026 forecast, the materials show a dividend of (¥90) per share and a payout ratio of (31.2%), while the FY2028 target payout ratio and DOE are 35.0% and 4.0% respectively. Shareholder benefits were enhanced following the share split, offering up to ¥10,000 worth of benefits per year (an original Astro Boy QUO card or a donation option), twice yearly, with amounts of ¥2,000 (100 shares or more), ¥3,000 (200 shares or more), and ¥4,000-¥5,000 depending on continuous holding period (300 shares or more), based on record dates of March 31 and September 30.
Company Overview
As of March 31, 2026, Tsubakimoto Kogyo had more than 6,500 business partners, over 40 bases worldwide, more than 300 qualified personnel, and around 800 employees, with a market capitalization of approximately ¥52 billion. The company’s three business segments are Power Transmission (transmissions, reduction drives, conveyor chains, control devices, sensors, and other power transmission devices), Facility & Equipment (environmental and energy-related equipment, food and chemical machinery, medical equipment, industrial robots, machine tools, and automation and conveying systems), and Industrial Materials (non-woven fabrics and processed products, synthetic resin molding machines, and functional materials).
This article is an analysis based on publicly available information and is not a recommendation to buy or sell any specific securities. Investment decisions are your own responsibility.
















