
This article is based on publicly available IR materials and is not a recommendation to buy or sell any specific securities.
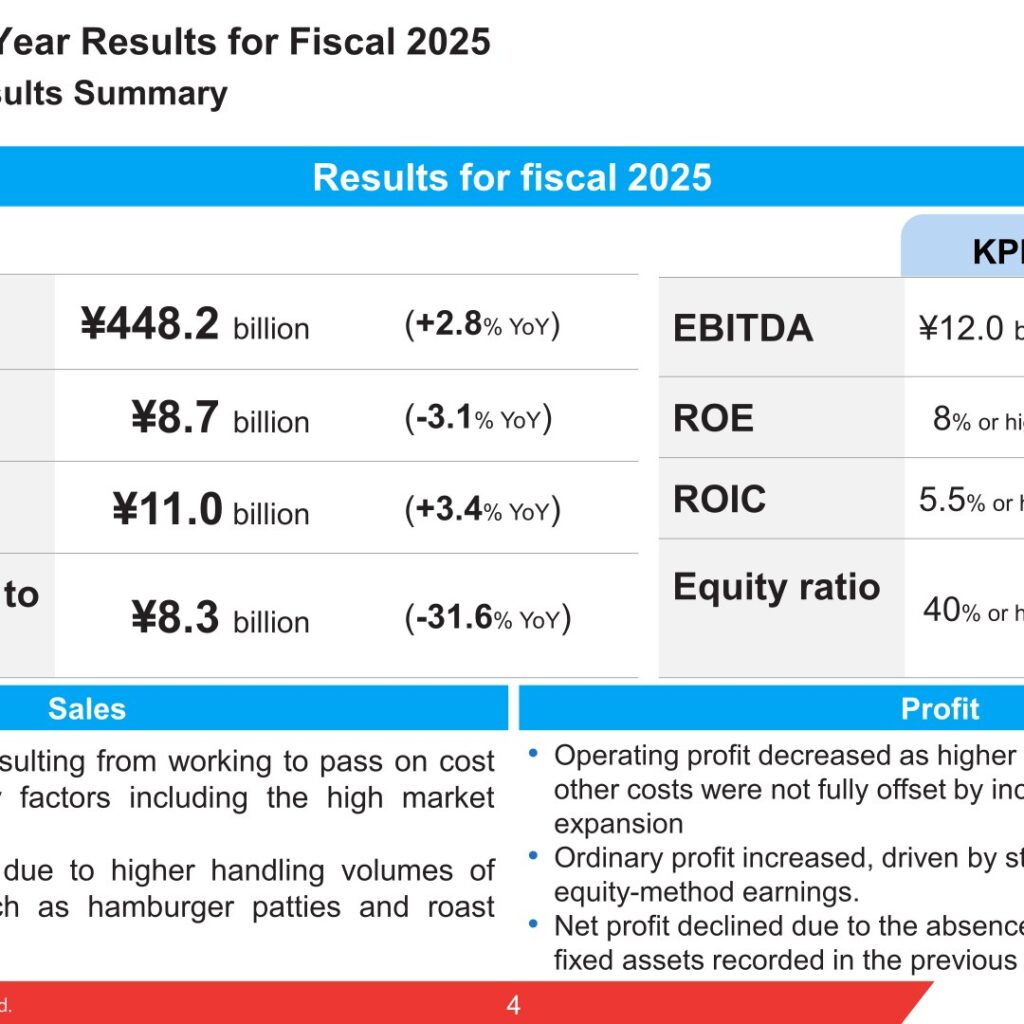
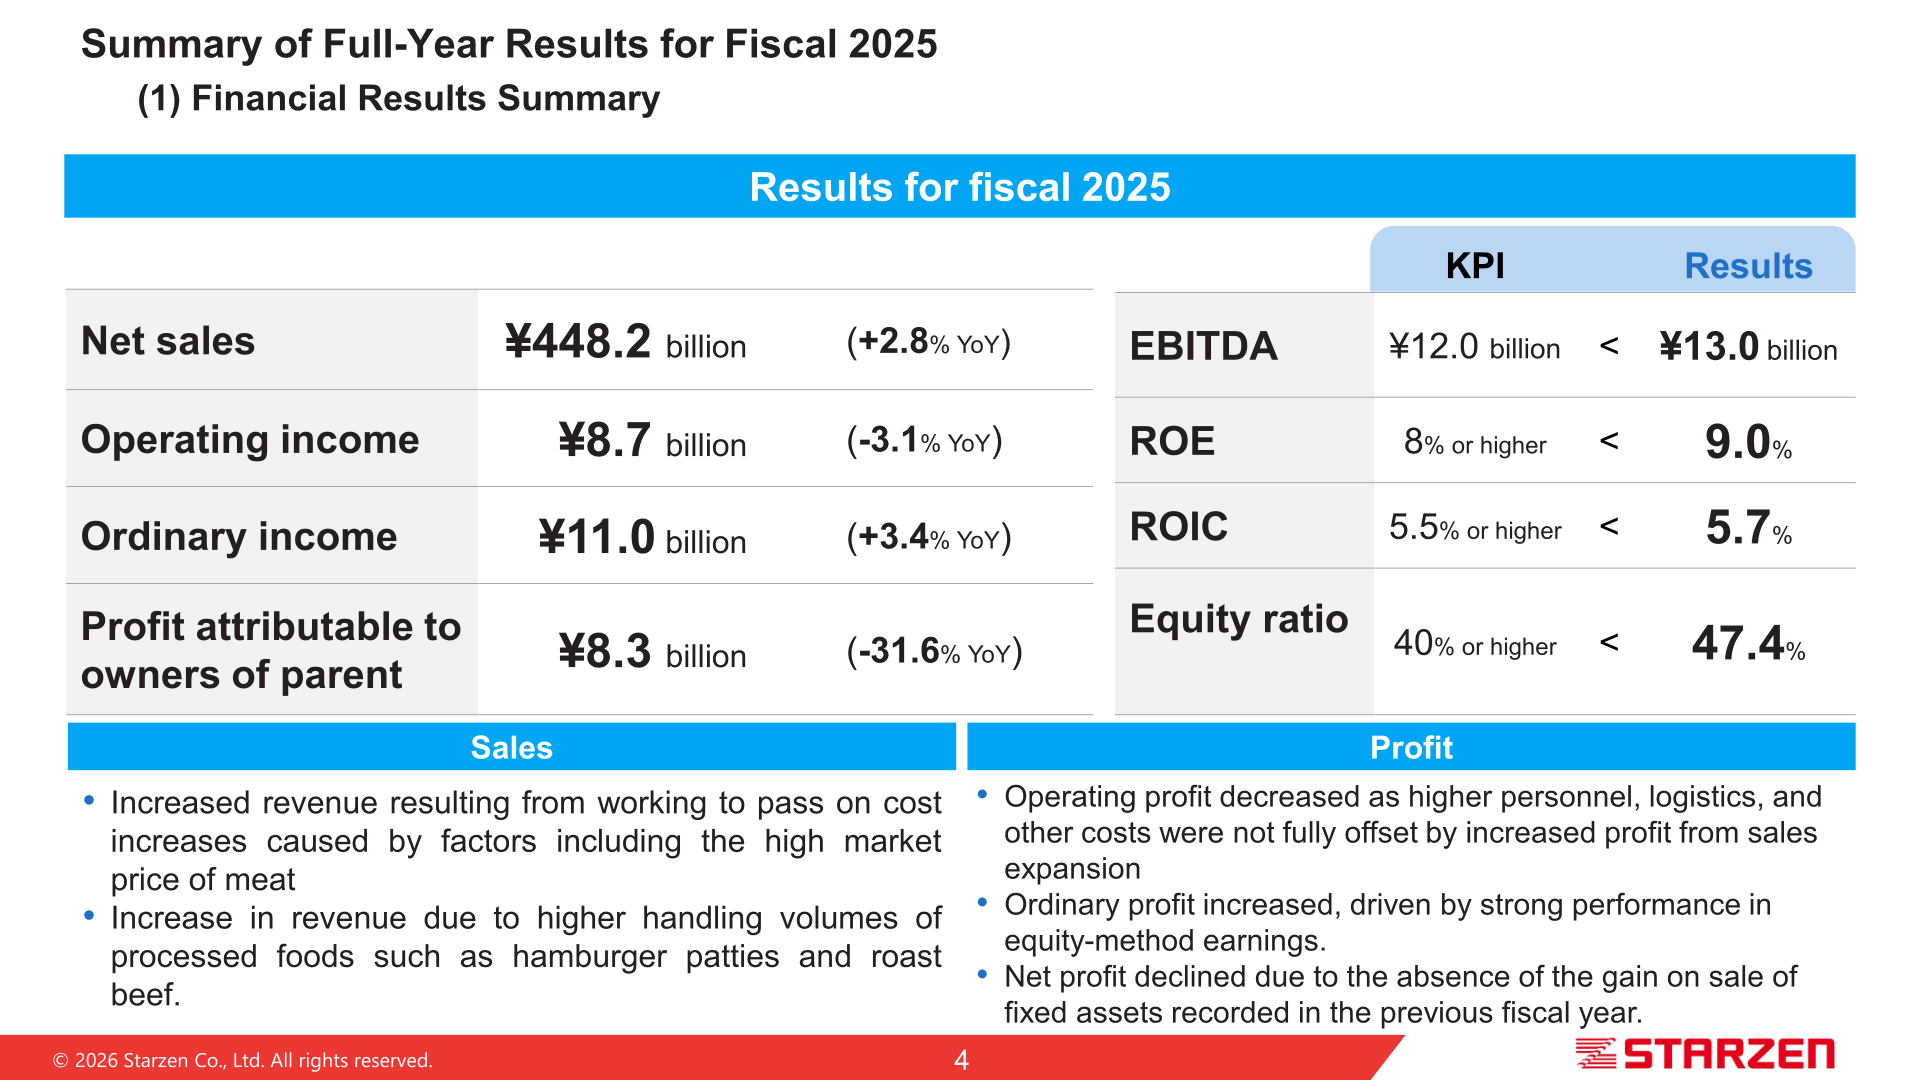
Starzen Co., Ltd. reported consolidated net sales of ¥448.2 billion for fiscal 2025 (the year ended March 31, 2026), up 2.8% year on year, driven by higher volumes of processed foods such as hamburger patties and roast beef and by passing on higher meat market prices to customers. Operating income declined 3.1% to ¥8.7 billion as higher personnel, logistics and other costs were not fully offset by the sales increase, while ordinary income rose 3.4% to ¥11.0 billion on strong equity-method earnings. Profit attributable to owners of parent fell 31.6% to ¥8.3 billion, mainly because the prior fiscal year included a gain on sale of fixed assets that was absent this year. All four of the company’s key performance indicators for fiscal 2025 — EBITDA, ROE, ROIC and the equity ratio — exceeded their targets.
Consolidated Results (Full-Year Actual)
The table below summarizes the year-on-year comparison of Starzen’s consolidated profit and loss for fiscal 2025 (figures in billions of yen, as stated in the source). Total assets increased ¥30.2 billion to ¥202.1 billion, reflecting growth in inventories and advance payments to suppliers and in fixed assets following recent acquisitions; net assets rose ¥6.9 billion to ¥95.7 billion. The equity ratio declined to 47.4% from 51.6% a year earlier as interest-bearing liabilities increased ¥17.6 billion to ¥59.5 billion to fund growth investment.
| Item | FY2025 (Year ended Mar. 2026) | FY2024 (Year ended Mar. 2025) | Amount of Change |
|---|---|---|---|
| Net sales | 448.2 | 436.1 | +12.1 |
| Gross profit (margin) | 44.1 (9.9%) | 41.8 (9.6%) | +2.2 |
| Operating income (margin) | 8.7 (2.0%) | 9.0 (2.1%) | -0.2 |
| Ordinary income (margin) | 11.0 (2.5%) | 10.6 (2.4%) | +0.3 |
| Profit before income taxes (margin) | 11.5 (2.6%) | 17.5 (4.0%) | -6.0 |
| Profit attributable to owners of parent (margin) | 8.3 (1.9%) | 12.1 (2.8%) | -3.8 |
Net Sales by Product
By product category, growth in domestic meat and processed foods more than offset declines in imported meat and ham & sausage (figures in billions of yen).
| Product | FY2025 (Year ended Mar. 2026) | FY2024 (Year ended Mar. 2025) | Amount of Change | YoY Change |
|---|---|---|---|---|
| Domestic Meat | 190.2 | 180.7 | +9.5 | +5.3% |
| Imported Meat | 159.7 | 162.5 | -2.8 | -1.8% |
| Processed Foods | 84.6 | 78.3 | +6.2 | +8.0% |
| Ham and Sausage | 8.3 | 9.1 | -0.8 | -8.8% |
| Other | 5.1 | 5.1 | -0.0 | -0.1% |
| Total | 448.2 | 436.1 | +12.1 | +2.8% |
Profit Bridge: Change in Profit Attributable to Owners of Parent
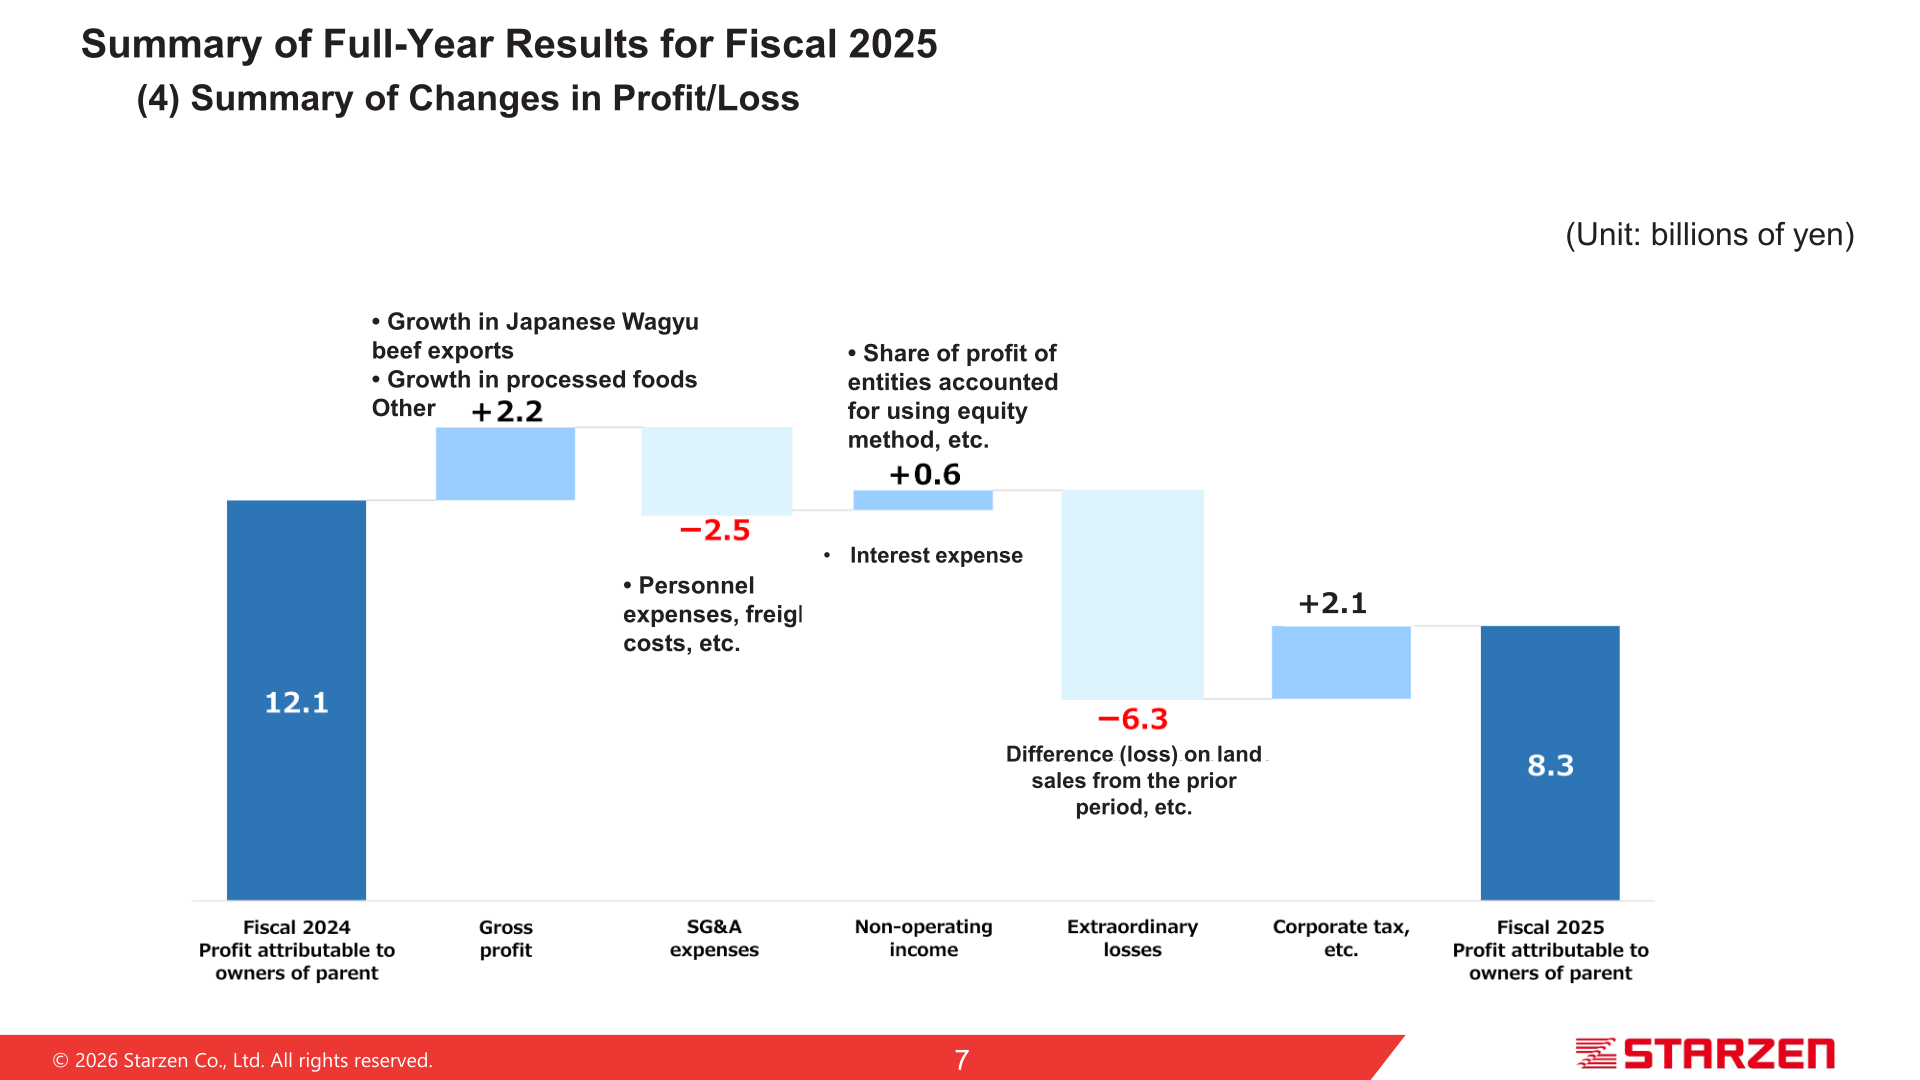
A waterfall chart in the presentation breaks down the ¥3.8 billion year-on-year decline in profit attributable to owners of parent, from ¥12.1 billion in fiscal 2024 to ¥8.3 billion in fiscal 2025 (figures in billions of yen).
| Step | Amount (¥ billion) |
|---|---|
| Fiscal 2024 profit attributable to owners of parent | 12.1 |
| Gross profit (growth in Japanese Wagyu beef exports and processed foods, other) | +2.2 |
| SG&A expenses (personnel expenses, freight costs, etc.) | -2.5 |
| Non-operating income (share of profit of entities accounted for using equity method, etc., net of interest expense) | +0.6 |
| Extraordinary losses (difference/loss on land sales versus the prior period, etc.) | -6.3 |
| Corporate tax, etc. | +2.1 |
| Fiscal 2025 profit attributable to owners of parent | 8.3 |
FY2026 Forecast
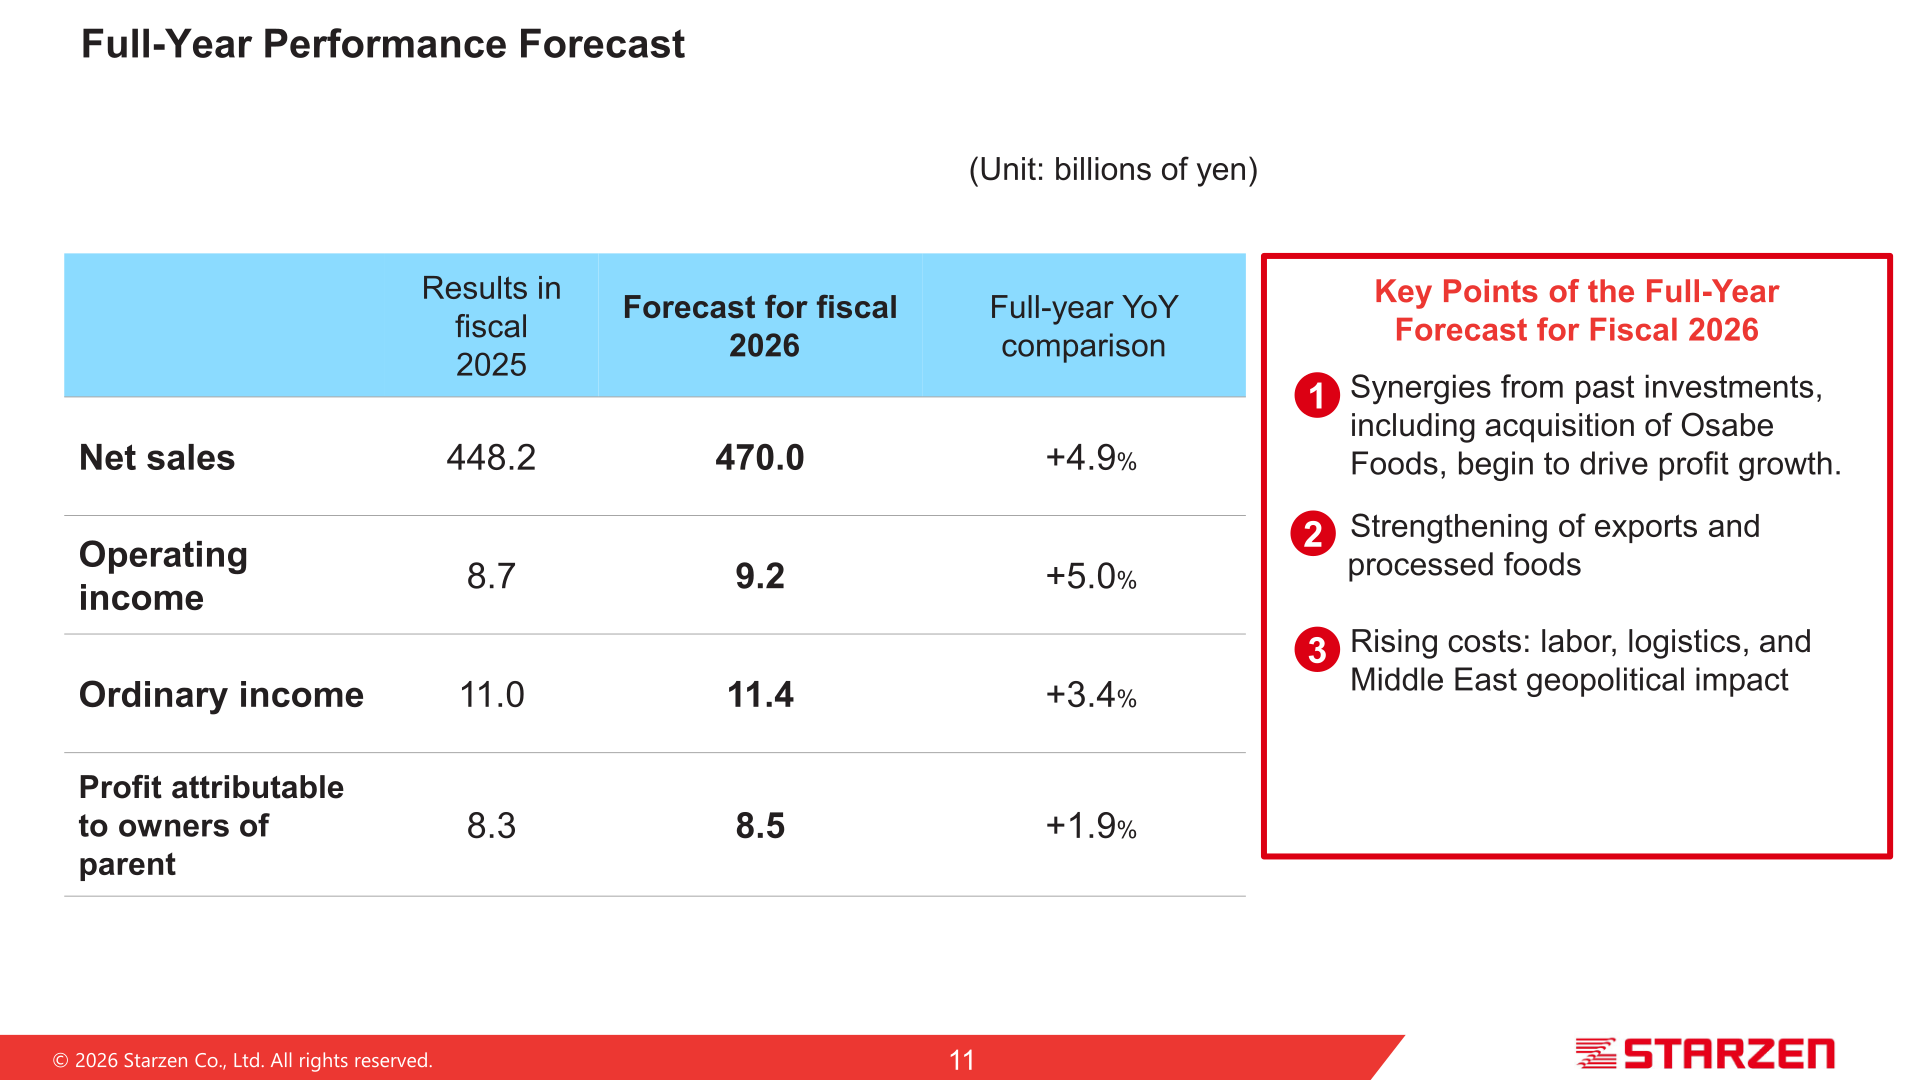
For fiscal 2026, Starzen forecasts continued growth in both sales and profit. Key points cited are synergies from past investments including the acquisition of Osabe Foods, strengthening of exports and processed foods, and rising costs from labor, logistics and the Middle East geopolitical situation (figures in billions of yen).
| Item | FY2025 (Actual) | FY2026 (Forecast) | Full-Year YoY Comparison |
|---|---|---|---|
| Net sales | 448.2 | 470.0 | +4.9% |
| Operating income | 8.7 | 9.2 | +5.0% |
| Ordinary income | 11.0 | 11.4 | +3.4% |
| Profit attributable to owners of parent | 8.3 | 8.5 | +1.9% |
Shareholder Returns
Starzen aims for a consolidated DOE (dividend on equity) of 3.0% and stable, continuous dividend growth. Dividends per share have risen every year, from ¥21.67 (post-split basis; ¥65 pre-split) in fiscal 2021 to ¥43 (¥129 pre-split) in fiscal 2025, and the company forecasts ¥50 (¥150 pre-split) for fiscal 2026 — its first introduction of an interim dividend, subject to approval of a related change to the Articles of Incorporation at the 87th Annual General Meeting of Shareholders on June 26, 2026. The company carried out a three-for-one stock split effective April 1, 2025; figures in parentheses in the table below are pre-split values. Under its cash allocation plan, over fiscal 2023–2025 Starzen generated operating cash flow of ¥19.0 billion and raised ¥24.0 billion through interest-bearing debt and asset reallocation, applying ¥36.0 billion to investment and ¥7.0 billion to shareholder returns. For fiscal 2026–2030 it plans operating cash flow of ¥70.0 billion or more, with ¥70.0 billion earmarked for investment (¥56.0 billion growth investment and ¥14.0 billion maintenance and renewal investment) and ¥20.0 billion or more for shareholder returns, including consideration of flexible treasury share repurchases.
| Metric | Fiscal 2021 | Fiscal 2022 | Fiscal 2023 | Fiscal 2024 | Fiscal 2025 | Fiscal 2026 (Forecast) |
|---|---|---|---|---|---|---|
| Net assets (billions of yen) | 64.0 | 70.2 | 78.0 | 88.7 | 95.7 | 〔101.3〕 |
| Dividends per share (yen) | 21.67(65) | 25(75) | 26.67(80) | 36.67(110) | 43(129) | 50(150) |
| Consolidated DOE | 2.1% | 2.2% | 2.1% | 2.6% | 2.7% | 〔2.9%〕 |
| Consolidated payout ratio | 21.1% | 19.5% | 20.7% | 17.6% | 29.5% | 33.6% |
Medium-Term Management Plan
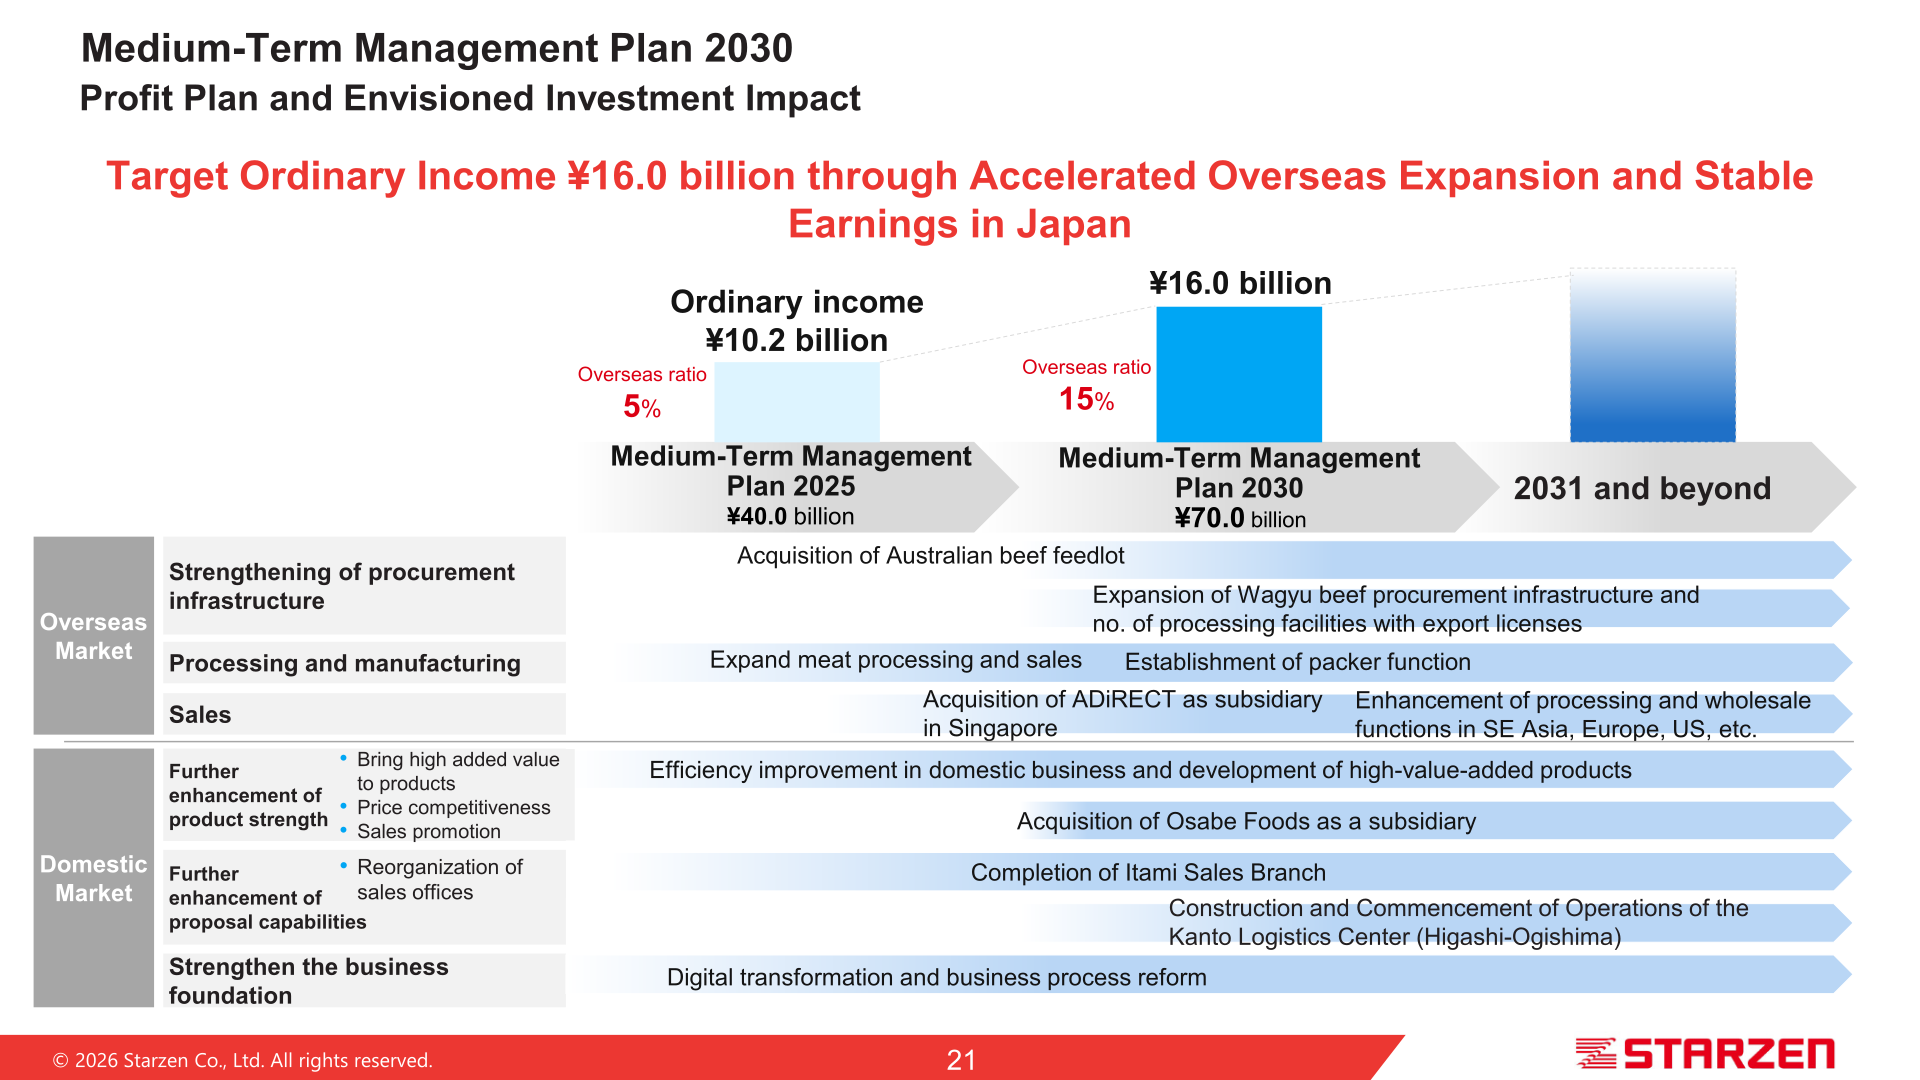
Starzen completed its Medium-Term Management Plan 2025 in fiscal 2025, achieving all initial targets: net sales of ¥448.2 billion versus a ¥440.0 billion target (+¥8.2 billion), ordinary income of ¥11.0 billion versus a ¥10.0 billion target (+¥1.0 billion), EBITDA of ¥13.0 billion versus a ¥12.0 billion target (+¥1.0 billion), and ROE of 9.0% versus an 8.0%-or-higher target (+1 percentage point), driven by higher value-added products and strong Japanese Wagyu beef exports. Under the new Medium-Term Management Plan 2030 (fiscal 2026–2030), the company targets ordinary income of ¥16.0 billion, up from ¥10.2 billion at the start of its medium-term planning horizon, by raising the overseas ratio of ordinary income from 5% to 15% through building a global supply chain — including the acquisitions of an Australian Wagyu feedlot and Singapore-based ADiRECT — alongside continued optimization of the domestic sales structure to address the polarization and diversification of consumption trends. The related five-year investment plan totals ¥70.0 billion, up from ¥40.0 billion under the previous plan.
| Metric | MTP2025 Target | Fiscal 2025 Actual | Difference |
|---|---|---|---|
| Net sales | ¥440.0 billion | ¥448.2 billion | +¥8.2 billion |
| Ordinary income | ¥10.0 billion | ¥11.0 billion | +¥1.0 billion |
| EBITDA | ¥12.0 billion | ¥13.0 billion | +¥1.0 billion |
| ROE | 8.0% or higher | 9.0% | +1% |
This article is an analysis based on publicly available information and is not a recommendation to buy or sell any specific securities. Investment decisions are your own responsibility.
















